Mastering Churn Prediction Models to Keep Customers
Discover how churn prediction models work and learn to implement them. This guide offers proven strategies to reduce customer churn and boost retention.

Churn prediction models are sophisticated tools that sift through customer data to pinpoint who's likely to leave. By looking at past behaviors—what customers did or didn't do—these models can forecast future actions, giving businesses a chance to step in before it's too late. It’s about shifting from damage control to a proactive strategy for growth.
Why Customer Churn Silently Sinks Businesses
Picture your business as a bucket you're working hard to fill with water. Every new customer is another cup poured in. But what if there are small, hard-to-see holes in that bucket? You're losing water constantly, no matter how quickly you pour. That slow, steady drip is customer churn, one of the most insidious problems a business can face.
Churn isn't just a metric on a report; it's a quiet killer of revenue, momentum, and team spirit. The lost subscription fee is obvious, but the real damage often lurks beneath the surface.
The Hidden Costs of a Leaky Bucket
The financial sting of churn goes far deeper than the immediate loss of revenue. For starters, global studies consistently show that acquiring a new customer can cost five times more than keeping an existing one. It's no surprise that companies using predictive models to get ahead of churn have successfully cut it by up to 15-25%, giving their profitability a direct and significant boost. You can find more insights on how retention impacts the bottom line.
But the marketing spend is just the beginning. The ripple effects are what really hurt:
- Lost Brand Advocacy: Your happiest, longest-tenured customers are your most authentic marketing team. When they leave, you lose out on their word-of-mouth referrals, glowing reviews, and the social proof that brings in new customers for free.
- Diminished Team Morale: High churn can be a real downer for your customer success, support, and product teams. It feels like they're constantly fighting a losing battle, which can lead to burnout and a less engaged workforce.
- Wasted Product Knowledge: Every customer who leaves takes their unique experience with your product with them. That hard-won knowledge is gone forever, making it tougher to get the feedback you need to improve.
The table below breaks down the direct and indirect financial blows that come with losing a customer. It’s a clear look at why keeping the customers you have is one of the smartest business moves you can make.
| Cost Category | Description | Example Business Impact |
|---|---|---|
| Direct Revenue Loss | The immediate loss of subscription fees or repeat purchase income from the churned customer. | A SaaS company loses a 200/month subscription, resulting in a ****2,400 annual revenue loss from a single account. |
| Customer Acquisition Cost (CAC) | The money spent to acquire a new customer to replace the one who left. | If the company's CAC is $1,000, they must spend that amount just to get back to their previous customer count. |
| Lost Upsell/Cross-sell | The missed opportunity to sell additional services, features, or products to an existing, loyal customer. | The churned SaaS customer might have upgraded to a 500/month enterprise plan in the next year, representing ****6,000 in lost potential revenue. |
| Brand Advocacy Decay | The loss of positive word-of-mouth marketing and referrals that a happy customer would have generated. | A loyal customer who refers two new clients per year is lost, costing the company two new revenue streams. |
| Negative Social Proof | The potential for a departing customer to leave negative reviews or share their poor experience online. | A single negative review can deter multiple potential new customers, creating an unquantifiable but significant revenue loss. |
| Internal Morale Impact | The demotivating effect on employees who see their hard work undone by high customer turnover. | The customer success team's productivity drops by 10% as they spend more time on "save" calls instead of proactive engagement. |
Ultimately, these costs stack up quickly, turning what seems like a small leak into a major drain on your company's health and future growth potential.
Shifting from Reaction to Prediction
This is where churn prediction models become so powerful. They're more than just a complex data science experiment; they are a fundamental tool for building a sustainable business. Think of them as an early warning system. They analyze subtle changes in user behavior—fewer logins, a drop in support tickets, ignoring new feature announcements—to flag at-risk accounts long before they’re packed and ready to go.
By catching these signals early, you can switch from a reactive, "firefighting" mode to a proactive retention strategy. Instead of a last-ditch effort to win back someone who has already decided to leave, you can intervene with targeted help, a special offer, or helpful content that reminds them why they chose you in the first place. This is how you plug the leaks for good and build a stronger, more profitable business.
How Churn Prediction Models See the Future

So, how do these models actually work? Think of a seasoned detective investigating a case. They don't just rely on a single clue; they piece together evidence from various sources—witness statements, forensic data, past records—to build a coherent theory. A churn prediction model does the same thing, but its suspects are your at-risk customers, and the evidence is their data.
The model systematically sifts through your customer data, looking for patterns that signal trouble ahead. It’s not about guesswork or hunches. It’s a methodical process that uses historical information to learn what "at-risk" behavior looks like, then scans your current customer base for those very same red flags.
At the end of the day, the goal is to produce a churn risk score for every single customer. This is simply a probability—a percentage from 0% to 100%—that tells you how likely a customer is to leave within a set period. It feels like magic, but it’s really just turning past behavior into a very powerful forecast.
Gathering the Clues: Customer Data
First things first, any good detective needs evidence. For a churn model, that evidence is data. Just like a doctor needs a patient's full medical chart, your model needs a complete picture of the customer’s journey with your product.
Each piece of data acts like a "symptom" that the model can analyze. The more relevant, high-quality information you feed it, the more accurate its diagnosis will be.
Here are the usual suspects when it comes to data collection:
- Behavioral Data: This is the big one—what customers actually do with your product. Think login frequency, session length, which features they use (and which they ignore), and the key actions they take.
- Demographic Data: This tells you who the customer is. Details like their industry, company size, or location can reveal churn patterns unique to specific segments.
- Support Interactions: Every helpdesk ticket, chat log, and support call is a potential clue. A sudden spike in bug reports or complaints from a single account is a classic churn signal.
- Billing Information: Money talks. Data on subscription plans, payment history, and recent downgrades is crucial. A failed payment, for instance, is often a direct precursor to involuntary churn.
The Investigation: Analyzing the Patterns
With the data in hand, the real investigation begins. This is where machine learning shines. The model dives into mountains of historical data from thousands of customers, including both those who churned and those who happily stuck around.
It's on the hunt for correlations a human analyst could easily miss. For example, it might uncover that customers who never touch a key feature and have logged more than two support tickets in their first month have a 92% probability of churning within the next 90 days.
This process breaks down into a few key stages:
- Feature Engineering: This is where raw data gets turned into meaningful signals, or "features." Instead of just tracking the number of logins, the model might create a new feature like "30-day decline in login frequency."
- Model Training: The model is given a "training dataset" where the outcome—churn or no churn—is already known. It then works backward, adjusting its logic over and over to find the patterns that most accurately predict those known outcomes.
- Pattern Recognition: Through this training, it learns the subtle combinations of behaviors and attributes that come before a customer leaves. It also learns to weigh certain factors more heavily than others based on how predictive they are.
The Verdict: Generating a Risk Score
Once the model is trained, it's ready to make its predictions. It takes the fresh, current data for all of your active customers and applies the patterns it learned. For each customer, it spits out that all-important churn risk score.
This isn't a simple "yes" or "no" answer. What you get is a prioritized list that tells your team exactly where to focus their attention. You might see that Customer A has a 78% churn risk, while Customer B is sitting comfortably at 12%. That clarity allows your customer success team to direct their energy where it will make the biggest difference.
This is what allows a business to shift from being reactive to proactive. Instead of waiting for the dreaded cancellation email to land in your inbox, you can spot the warning signs weeks or months ahead of time and step in with the right support, training, or incentives to keep a valuable customer on board.
Choosing Your Machine Learning Algorithm
Alright, you’ve gathered your data. Now comes the big question: which machine learning algorithm should you actually use to build your churn prediction model? Think of it like picking the right tool for a job. A simple hammer is perfect for a nail, but you'd grab a power drill for a more serious project. Not all algorithms are the same, and the best one for you will hinge on your data, your team's expertise, and just how much detail you need from the results.
The good news is that you don't have to be a Ph.D. in data science to make a smart choice. We'll start with a reliable, easy-to-understand model and work our way up to more powerful options that can uncover those sneaky, hidden patterns in customer behavior.
This graphic gives a great high-level view of the model selection process, showing how different algorithms fit into the bigger picture.
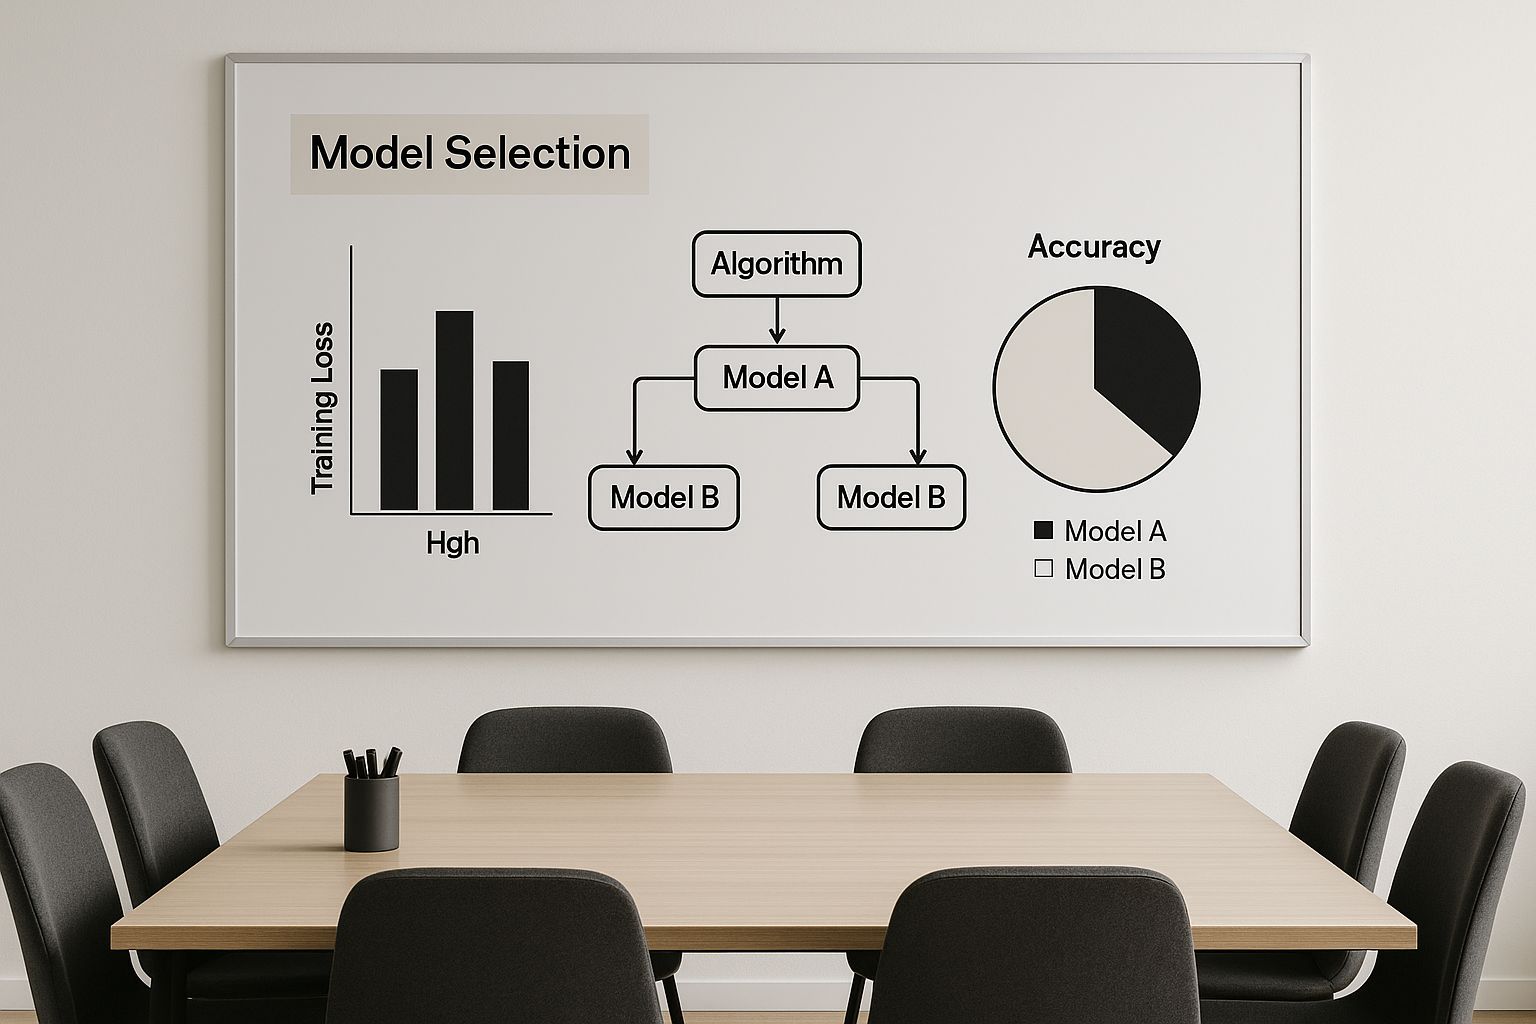
As you can see, it's all about striking a balance. You're trading off the complexity of the model against how easy it is to understand its predictions, trying to find that sweet spot for your business.
H3: Start with a Solid Baseline: Logistic Regression
Imagine you need an expert opinion on a business problem. A fantastic first step is to consult one trusted, experienced advisor. In the world of churn prediction, Logistic Regression is that advisor. It's a straightforward, dependable algorithm that’s been a workhorse in data science for decades.
It functions by looking at various customer attributes—things like usage frequency, plan type, or recent support tickets—and then calculates the probability of a single outcome: will they churn or not? Because it's a simpler model, its results are highly interpretable. You can literally look at the output and see which factors are pushing a customer's churn risk up or down.
This clarity makes it the perfect baseline model. It helps you quickly understand the most obvious drivers of churn and sets a benchmark for accuracy. Any fancier model you try next has to beat this one.
H3: Level Up with Ensemble Methods
While one expert's opinion is great, what if you could assemble a whole panel of diverse experts and let them vote on the outcome? That's the core idea behind ensemble methods. They work by combining multiple machine learning models to produce a more accurate and robust prediction than any single model could on its own.
Two of the heavy hitters in this category for churn prediction are Random Forests and Gradient Boosting.
H4: Random Forests: An Army of Decision Makers
A Random Forest is pretty much what it sounds like: a huge collection of individual decision trees. Each "tree" in this forest is a simple model that makes its own prediction based on a random slice of your customer data and features.
To get a final answer, the algorithm polls every single tree and goes with the majority vote. It’s a truly collaborative approach that brings some major advantages:
- High Accuracy: By averaging out the predictions from hundreds (or even thousands) of trees, the model naturally corrects for the errors and biases of any one tree, leading to a much more accurate result.
- Reduced Overfitting: It's less likely to get fixated on random noise in your training data, which means it's better at predicting outcomes for new customers it has never seen before.
- Feature Importance: It can tell you which features (like login frequency or feature adoption) were the most influential across the entire forest when making predictions.
Think of the Random Forest as a large, diverse committee of specialists. Each one examines the problem from a slightly different angle, and their collective wisdom results in a smart, well-rounded decision.
H4: Gradient Boosting: The Master and the Apprentice
If a Random Forest is a committee of independent experts, then a Gradient Boosting model (like XGBoost or LightGBM) is more like a team of specialists working together in a sequence. It builds one tree, checks to see where it made mistakes, and then builds the next tree specifically to fix those errors.
This process repeats over and over, with each new model learning from the shortcomings of the one that came before it. It’s like a master craftsman training an apprentice—the master points out a mistake, and the apprentice's next attempt is better because of it.
This approach often delivers the highest predictive accuracy, but it does come with a trade-off. These models can take more computing power to train and are generally seen as more of a "black box," making it harder to pinpoint exactly why a specific prediction was made.
Comparing Popular Churn Prediction Algorithms
To help you decide, here's a quick look at how these common algorithms stack up against each other for churn prediction.
| Algorithm | Best For | Key Advantage | Main Limitation |
|---|---|---|---|
| Logistic Regression | Establishing a quick, interpretable baseline. | Simplicity & Interpretability: Easy to understand which factors drive churn. | Lower accuracy with complex, non-linear data. |
| Random Forest | Achieving high accuracy with good feature insights. | Robustness: Handles noisy data well and prevents overfitting. | Can be slower to train and less interpretable than simpler models. |
| Gradient Boosting (e.g., XGBoost) | Maximizing predictive accuracy, even with subtle data patterns. | Peak Performance: Often the most accurate model available. | Can be a "black box" and is computationally intensive. |
Choosing the right algorithm is a key step. While Logistic Regression is a fantastic starting point for its simplicity, more advanced models like Random Forests and Gradient Boosting can seriously improve your prediction accuracy by finding patterns you didn't even know were there. As you can discover in this article from Braze.com, the best choice really depends on your data size, complexity, and how much interpretability your team needs.
A Practical Guide to Building Your First Model
Alright, enough with the theory. Let's roll up our sleeves and actually build something.
Getting your first churn prediction model off the ground might seem daunting, but it's really a sequence of logical steps. Think of it less like launching a rocket and more like assembling furniture—if you follow the instructions, you'll end up with something solid.
The point isn't to create a perfect, crystal-ball-level accurate model on day one. The real goal is to build a functional V1 that gives you actionable insights. We'll start with the most important part—the data—then shape it into something the model can understand, and finally, put it to the test.
https://www.youtube.com/embed/y_28P1ptNWw
Step 1: Gather and Clean Your Customer Data
Every predictive model is a reflection of the data it’s trained on. Garbage in, garbage out isn't just a saying; it's the first law of machine learning. So, your first job is to gather all the raw materials.
This means pulling together everything you know about your customers from all the different places it lives. Then comes the not-so-glamorous but absolutely critical part: cleaning it up.
You wouldn't try to cook a gourmet meal with unlabeled, expired ingredients. In the same way, feeding a model messy, inconsistent data will only produce junk predictions.
So, where do you start looking? Focus on these key areas:
- Behavioral Data: How often do they log in? What features are they actually using? What are the common paths of your stickiest customers?
- Support Interactions: Are they constantly filing support tickets? How long does it take to resolve their issues? Is the tone of their messages getting increasingly frustrated?
- Billing and Subscription Data: Which plan are they on? Did they recently downgrade? Is their payment method consistently failing?
- Demographic Data: What industry are they in? How big is their company? Are they a small startup or a massive enterprise?
Once you have this data, you'll need to scrub it clean. This process, known as data preprocessing, is all about fixing errors, dealing with missing information, and making sure everything is in a standard format. It's the prep work that makes everything else possible.
Step 2: Engineer Features That Matter
With clean data ready to go, we move into the most creative—and arguably most important—part of the process: feature engineering.
This is where you transform raw data points into intelligent signals that a model can interpret. It’s the difference between telling your model "this customer logged in 30 times" versus "this customer's login frequency dropped by 50% last month." The second statement is packed with predictive power.
You're not just a data collector here; you're a detective, looking for clues. This is where your deep, human understanding of your product and your customers becomes an unfair advantage.
This visual shows that feature engineering isn't a one-and-done task. It's a cycle: you create features, train the model, see how it performs, and then go back to refine your features based on what you learned.
Here are a few examples of features that are far more powerful than raw data:
- Engagement Score: A single, composite score that combines metrics like login frequency, key feature usage, and time spent in the app.
- Support Ticket Ratio: Instead of just counting tickets, calculate the number of tickets per month of their subscription. A rising ratio is a huge red flag.
- Time Since Last Key Action: How long has it been since they used a "sticky" feature—one you know correlates highly with retention?
- Onboarding Completion Rate: What percentage of the setup or tutorial did they actually finish? A user who bails on onboarding is a prime churn risk.
Step 3: Train and Test Your Model
Now it's time to bring your model to life. This is where the machine does its learning, finding patterns in your historical data to predict what will happen next. To do this right, you have to follow one non-negotiable rule: split your data.
You’ll break your customer dataset into two distinct piles.
- The Training Set: This is the big chunk, usually about 70-80% of your data. The model studies this set intensely, learning what separates the customers who churned from those who stayed. Think of this as the open-book portion of an exam where it gets to see all the questions and answers.
- The Testing Set: This is the remaining 20-30% that the model has never seen before. After it's done "studying" the training set, you give it this data to see how well it can predict the outcomes on its own. This is the final exam. It proves the model actually learned the concepts, not just memorized the answers.
Why is this split so important? It prevents a classic machine learning pitfall called overfitting. This happens when a model gets so good at explaining the training data that it loses the ability to make accurate predictions on new, real-world data.
By validating your model against a separate testing set, you can be confident that it’s ready to provide reliable churn risk scores for your actual customers.
Turning Model Predictions into Real-World Wins
A highly accurate churn prediction model is a fantastic technical achievement, but let's be honest—its real worth is measured in business impact, not statistical perfection. The magic happens when a model’s predictions don't just confirm what you already know, but actually challenge long-held assumptions and point you toward smarter retention strategies.
There's no better example of this than the story of KKBOX, a major music streaming service in Asia.
Facing a hyper-competitive market, KKBOX needed to get to the bottom of why subscribers were walking away. Their team got to work, building a sophisticated churn prediction model by digging into a massive dataset covering 11 years of user activity. This was more than just a data science project; it was a full-blown investigation into the entire subscriber journey.
Uncovering Surprising Truths
The model they built was impressive, but its biggest win wasn't the accuracy score. It was the completely unexpected insights it surfaced.
Before they started, everyone assumed the biggest red flag for churn would be low user activity. Fewer songs streamed, fewer playlists created—it just makes sense, right? If someone isn't using the service, they're probably on their way out.
But the model told a very different story.
KKBOX's analysis revealed that user activity had almost no correlation with their churn rates. The real drivers were hiding in plain sight: pricing structures, the user's original signup source, and their billing preferences.

This discovery was a total game-changer. It proved that a retention strategy built around re-engaging inactive users would have been a colossal waste of time and money. The real issues were rooted in the commercial side of the relationship, not how much customers were using the product. A landmark case study on Pecan.ai goes into fascinating detail on these findings.
From Insight to Actionable Strategy
Suddenly armed with this knowledge, KKBOX could completely overhaul its retention playbook. Instead of sending out generic "we miss you" emails, they could finally focus their efforts where it would actually make a difference.
This new direction led to a few key strategic shifts:
- Optimized Pricing Tiers: They could pinpoint which pricing plans were bleeding customers and start experimenting with more attractive offers.
- Smarter Acquisition Channels: The data revealed which signup sources brought in the most loyal subscribers, allowing them to shift their marketing budget for better results.
- Proactive Billing Support: By identifying hiccups in the payment process, they could step in before a failed payment turned into an accidental cancellation.
The KKBOX story is the perfect reminder that a churn prediction model isn't just a technical toy. It's a strategic weapon. It gives you the hard evidence you need to stop guessing, challenge sacred cows, and build retention campaigns that actually deliver a measurable return.
Common Questions We Hear About Churn Prediction
When you start digging into churn prediction, a few practical questions almost always come up. Whether you're on the business side or the technical team, getting these sorted out early can save a lot of headaches down the road.
How Much Data Do We Actually Need?
Everyone asks this, but there’s no magic number. Quality beats quantity, every single time.
A good rule of thumb is to start with at least a few thousand customer records. For each of those customers, you'll want several months of historical data that clearly shows whether they churned or not. The dataset should be rich, too—think behavioral data (what they do), demographic data (who they are), and support interactions. The cleaner and more detailed this data is, the better your model will be at spotting the subtle patterns that lead to churn.
The biggest mistake I see is teams treating churn prediction as just a technical exercise. You can build the world's most accurate model, but it's completely useless if you don't have a business plan to act on its predictions.
Can a New Business Predict Churn?
Yes, absolutely, but you have to change your approach. If you don't have years of historical data on customers who’ve actually canceled, predicting that final churn event is nearly impossible.
Instead, new businesses should focus on predicting "proxy" behaviors—early warning signs that a customer is becoming disengaged.
You could look for things like:
- A sudden drop in how often a user logs in.
- Someone failing to complete critical onboarding steps.
- A decline in the use of your most important features.
Think of this as building a leading indicator model. As your company grows and you collect more data on actual churn, you can then evolve this into a more traditional, robust prediction model. It’s a great way to build the foundation early on.
Ready to turn customer feedback into revenue-driving insights? SigOS uses AI to analyze support tickets, chat logs, and usage data to reveal patterns that predict churn and highlight expansion opportunities. Prioritize your roadmap with confidence at https://sigos.io.
Keep Reading
More insights from our blog


Ready to find your hidden revenue leaks?
Start analyzing your customer feedback and discover insights that drive revenue.
Start Free Trial →