Your Guide to Building a Churn Prediction Model
Build a powerful churn prediction model with this step-by-step guide. Learn to identify at-risk customers, choose the right algorithms, and prevent turnover.

At its core, a churn prediction model is a smart system that uses your data to predict which customers are on the verge of leaving. Imagine it as an early-warning system for your business, flagging the subtle signs of customer dissatisfaction before they decide to walk away for good.
Why Churn Prediction Is Your Business Lifeline

Let's face it: losing customers is a painful and expensive reality. If you're stuck in a constant cycle of acquiring new users just to replace the ones heading for the exit, your growth will stall. A churn prediction model fundamentally changes the game, shifting your entire strategy from reactive damage control to proactive relationship building.
Think of it like a doctor spotting early symptoms before they turn into a full-blown illness. The model sifts through mountains of historical data and user behavior, pinpointing the tiny, almost invisible patterns that signal a customer is at risk. This kind of foresight is pure gold—it gives you the chance to step in and make things right at just the right moment.
From Cost Center to Profit Driver
The numbers don't lie. Acquiring a new customer can cost a staggering five times more than keeping an existing one. When you zero in on retention, you’re not just cutting back on marketing spend; you’re building a foundation of loyal, stable revenue. A churn prediction model is the engine that drives this effort.
Here’s how it helps you turn the tide:
- Prioritize Your Efforts: Instead of guessing, you can focus your retention budget and team's energy on the specific customers who are actually in danger of leaving. This maximizes the impact of every dollar and hour spent.
- Personalize Your Interventions: The model helps you understand why someone might be unhappy. You can then reach out with a tailored solution—maybe it's a special offer, a hand-holding support session, or a quick tutorial on a feature they're struggling with.
- Improve Your Product: By analyzing the common reasons people churn, you can uncover and fix the root problems in your product or service. This isn't just about saving one customer; it's about preventing thousands more from leaving for the same reason.
Ultimately, churn prediction is all about arming your customer retention efforts with intelligence. To really see the benefits, it's worth exploring proven customer retention strategies that you can power with these insights. And to measure your success, you’ll need a solid grasp of the essential customer retention metrics. A data-driven approach is how you turn customers who are about to leave into your biggest fans.
The Journey from Basic Metrics to Predictive AI
Predicting customer churn wasn't always so sophisticated. For a long time, businesses relied on simpler, backward-looking metrics to figure out who was walking out the door. The go-to method was often RFM analysis—Recency, Frequency, and Monetary value.
This gave companies a decent snapshot of their best customers, but it was like driving by only looking in the rearview mirror. It told you what had already happened, not what was just around the bend.
This reactive approach was a starting point, but it meant you were always a step behind. By the time you noticed a customer’s purchase frequency had dropped, they might have already mentally checked out. It became obvious that companies needed to get ahead of the problem, moving from historical data to genuine foresight.
The Leap to Machine Learning
This is where machine learning completely changed the game. Instead of just tracking past actions, a churn prediction model learns the subtle, complex patterns that show up before a customer decides to leave. It connects dots a human analyst might easily miss, turning a sea of data into a crystal ball.
This shift brought more powerful techniques into the spotlight, especially ensemble methods. Think of an ensemble method as a "board of expert advisors" for your data. Instead of trusting a single algorithm's opinion, it combines the insights from multiple models to land on a more accurate, robust conclusion. Just as a diverse board makes better decisions than one person, these methods minimize errors and give you more confidence in the final prediction.
Handling Real-World Data Challenges
Modern churn models aren't just powerful; they're also built to handle the messy, imperfect data you find in the real world. One of the biggest hurdles is class imbalance, which is just a fancy way of saying you have far more happy customers than churning ones.
If you're not careful, a simple model could achieve high accuracy just by predicting no one will churn—which, of course, is totally useless.
To get around this, data scientists use specific techniques that force the model to pay close attention to that small but critical group of at-risk customers. And the results speak for themselves. Study after study has shown that advanced machine learning models consistently outperform older statistical methods. For example, research highlights that techniques like random forests and neural networks can hit high accuracy levels, with one study achieving an impressive AUC score of 83% on a massive customer dataset in the home services industry.
You can learn more about how machine learning elevates churn prediction on a large scale. Ultimately, this ensures the model isn't just a technical showpiece but a tool that delivers real business value by reliably flagging the customers who truly need your attention.
Choosing the Right Algorithm for the Job

Picking the right machine learning algorithm for your churn model feels a lot like choosing a vehicle for a road trip. A sleek sports car is great for a highway cruise, but you wouldn't take it through a rugged mountain pass. In the same way, each algorithm has its own strengths perfectly suited for different types of data and business problems.
The real challenge is balancing interpretability, accuracy, and complexity. A hyper-accurate model is practically useless if you can't explain its predictions to the marketing team who needs to act on them. On the other hand, a simple, easy-to-understand model might not be powerful enough to pick up on the subtle signals that precede a customer leaving.
The Reliable Workhorse: Logistic Regression
Think of Logistic Regression as the dependable sedan of machine learning. It’s not flashy, but it’s incredibly reliable, easy to understand, and gets the job done without much fuss. The algorithm works by calculating the probability of an event happening—in our case, a customer churning—by weighing different factors like login frequency or the number of support tickets.
Because it's so straightforward, data scientists often build a logistic regression model first. It gives you a solid performance baseline, and its results are highly interpretable. You can literally look at the output and see exactly which factors are pushing a customer’s churn risk up or down.
The Transparent Flowchart: Decision Trees
A Decision Tree is basically a flowchart for your data. It works by asking a series of simple "yes" or "no" questions to classify a customer. For instance, it might start with, "Did the customer log in this week?" and follow up with, "Have they submitted more than two support tickets in the last month?"
Its biggest strength is its transparency. You can visually trace the entire decision-making path, which makes it incredibly easy to explain to non-technical folks why a specific customer was flagged as a high churn risk.
The Wisdom of the Crowd: Random Forests
A single decision tree can be a bit unstable and prone to making mistakes. That’s where Random Forests come in. This algorithm takes a "wisdom of the crowd" approach by building hundreds, or even thousands, of individual decision trees and then letting them vote on the final prediction.
This ensemble method dramatically boosts both accuracy and stability. By averaging out the quirks and biases of any single tree, you end up with a much more robust and reliable churn prediction model. It’s a very popular and powerful choice for a reason.
The High-Performance Engine: Gradient Boosting
When you absolutely need the highest possible predictive power, Gradient Boosting is your high-performance engine. Like Random Forests, it's an ensemble method, but its approach is different. It builds trees one after another, with each new tree designed specifically to correct the errors of the one before it. It learns from its mistakes, getting progressively smarter with each step.
These more complex models, often called gradient boosting machines (GBMs), are incredibly good at finding complex, non-linear patterns in data that simpler models miss. They do, however, require more computing power and expertise to tune properly.
Comparing Popular Churn Prediction Algorithms
To make the choice a little clearer, here's a quick comparison of the most common algorithms used for churn prediction. Think of this as a spec sheet to help you match the right "engine" to your business needs.
| Algorithm | Best For | Interpretability | Accuracy Potential | Implementation Complexity |
|---|---|---|---|---|
| Logistic Regression | Establishing a quick, understandable baseline. | High | Moderate | Low |
| Decision Trees | When you need to clearly explain the "why" behind predictions. | Very High | Low to Moderate | Low |
| Random Forests | A great balance of high accuracy and reasonable interpretability. | Moderate | High | Moderate |
| Gradient Boosting | Squeezing out the absolute best predictive performance. | Low | Very High | High |
Ultimately, there’s no single "best" algorithm—the right choice depends entirely on your specific goals, data, and team resources. Understanding these trade-offs is the first step toward building a model that truly works for your business.
As you explore your options, you'll find that many of the best predictive analytics software platforms offer several of these algorithms out of the box, letting you experiment to find the perfect fit.
A Step-by-Step Framework for Your First Model
Diving into your first churn prediction model can feel like a huge undertaking, but it’s less about arcane data science magic and more about following a structured process. Think of it like building a piece of furniture—if you follow the instructions step-by-step, you end up with a solid, functional result.
The journey doesn't start with code or algorithms. It starts with a simple, foundational business question: what does "churn" actually mean to us? Is it when a customer cancels their subscription? Or is it after a certain period of inactivity? Maybe it's when they fail to renew a contract. Without a concrete definition, your model will be built on shaky ground. Pinpointing a precise, measurable event is the absolute first task.
Once you know exactly what you're trying to predict, it's time to tackle the most important phase: the data.
Gathering and Preparing Your Data
A model is fundamentally a reflection of the data it’s trained on. If you feed it garbage, you’ll get garbage out. The objective here is to gather a rich, historical dataset that captures the full customer story, pulling from every touchpoint you have.
You'll want to bring together a few key categories of information:
- User Attributes: Who are they? Think subscription plan, company size, or even their role.
- Product Usage Data: How do they use your product? This includes login frequency, which features they’ve adopted, and how long they spend in the app.
- Customer Feedback: What are they telling you? Pull from support tickets, NPS survey scores, and even chat logs.
- Billing Information: What's their payment behavior? Look at their payment history, any failed transactions, and contract renewal dates.
This raw data will arrive messy. It always does. You’ll need to clean it up by handling missing values, fixing errors, and merging it all into one master dataset. Getting this right requires solid infrastructure, and you can get a deeper look at designing these systems in our guide on how to build data pipelines.
Feature Engineering and Model Training
With clean data in hand, you move on to feature engineering. This is where the real creativity comes in. It's the process of transforming raw data points into meaningful signals—or "features"—that your model can interpret. For instance, you could create a "support ticket ratio" from raw ticket counts or a "feature adoption score" based on usage patterns.
Finally, it's time to actually train the model. You’ll split your historical data into two piles: a training set and a testing set. The model chews on the training data, learning the subtle patterns that precede churn. Then, you unleash it on the testing data—information it has never seen before—to see how well it performs. This back-and-forth process of training and validating is what makes your model trustworthy and ready for the real world.
This infographic breaks down the entire flow, from data prep all the way to deploying a retention strategy.
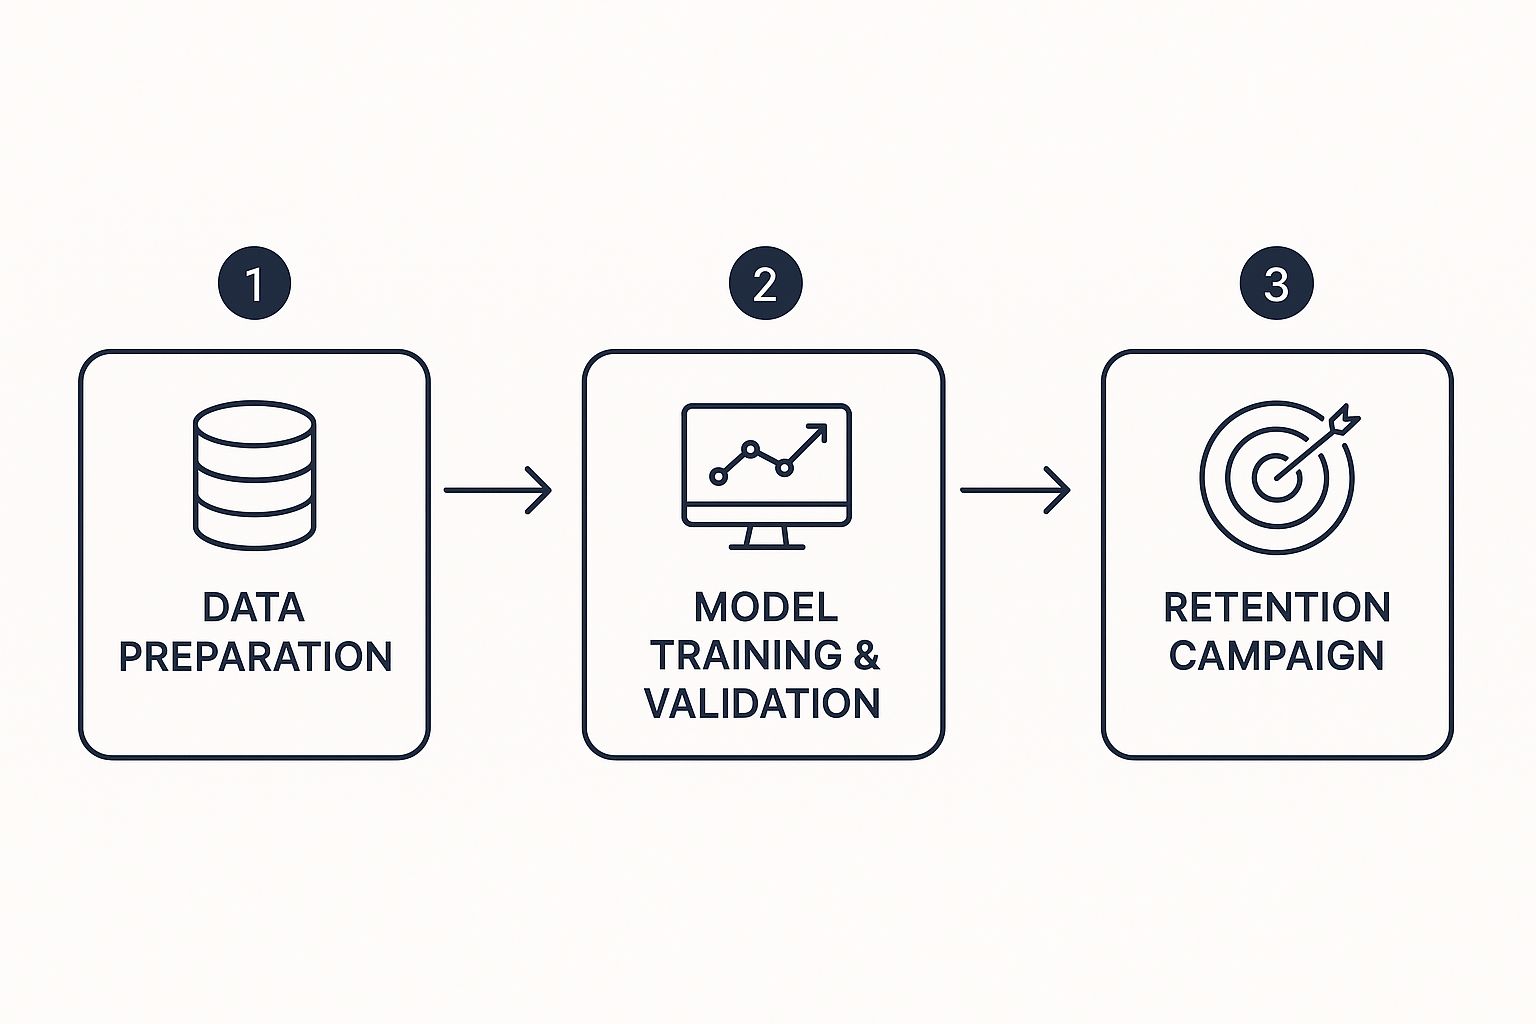
As the visual shows, a successful model isn't the finish line. It's the starting gun for proactive retention campaigns that can make a real difference to your bottom line.
How Churn Prediction Drives Real-World Success
This is where the rubber meets the road. All the theory about algorithms and data pipelines doesn't mean much until it starts saving you revenue and keeping your customers happy. Across every industry imaginable, companies are using these models to uncover some truly surprising insights that fuel proactive, high-impact retention strategies.
Often, the most valuable discoveries are the ones you'd never guess. For instance, a telecom provider might logically assume that dropped calls are the biggest reason customers leave. But a good model could flip that assumption on its head, revealing that customers who never contact support are actually the most likely to churn. This points to a kind of silent disengagement—a problem you can't fix if you don't know it's happening.
It’s a similar story in the SaaS world. You might think low feature usage is the classic churn signal, and it's certainly a factor. But a smarter model could pinpoint that a sudden drop in a team's active user count—say, from ten users down to five—is a much more potent red flag than any simple usage metric could ever show.
Uncovering What Really Matters
The real magic of a custom churn prediction model is its ability to find the unique signals for your business. And trust me, they're rarely what you expect.
A fascinating example comes from the music streaming service KKBOX. They built a model using a whopping 11 years of data and achieved an incredible 96% accuracy in predicting cancellations. The most shocking discovery? How often a user played a song had almost zero connection to whether they would churn.
Instead, the factors that really mattered were:
- Pricing Plan: Which subscription tier a customer had selected.
- Signup Source: The channel through which the customer originally signed up.
- Auto-Renewal Status: Whether their subscription was set to renew automatically.
This case study is a perfect reminder that the most obvious predictors can be total red herrings. The real gold is often buried in your business-specific data. You can dig deeper into these surprising churn prediction findings and their implications.
Of course, prediction is only half the battle. Other AI tools are also making a huge impact on retention. For example, there are many ways chatbots help retain customers by providing instant support and personalized interactions. When you combine proactive prediction with automated, helpful intervention, you create a powerful system for protecting your customer base.
Measuring How Good Your Model Actually Is

So, you’ve built a churn prediction model. That's a huge step. But the real question is, how do you know if it's any good? It's easy to get hung up on a single number: accuracy.
A model that’s 95% accurate sounds amazing on paper, right? But that single stat can be incredibly misleading, especially when you're dealing with churn.
Think about it. Let's say only 5% of your customers churn in a given month. A lazy, useless model could achieve 95% accuracy just by predicting that no one will leave. It would be right about all the happy customers who stay, but it would completely fail at its only real job—flagging the handful who are about to walk out the door. That's why we have to dig deeper.
To get a true sense of a model's value, we need to look beyond vanity metrics and focus on a few key indicators that tell the full story.
The Fisherman's Dilemma: Precision vs. Recall
When it comes to churn models, the two most critical metrics are Precision and Recall. I like to explain this with a simple analogy: imagine you’re a fisherman who only wants to catch salmon.
- Precision is your ability to catch only salmon. When you pull up your net, how many of the fish are actually the ones you wanted? In our world, this measures how many of the customers you predicted would churn actually did. High precision means your retention team isn't wasting its efforts calling happy customers.
- Recall is your ability to catch all the salmon in the lake. You cast a wide net and make sure you don't miss any. For your model, this means successfully identifying the vast majority of customers who are genuinely at risk, even if you accidentally flag a few loyal ones in the process.
This trade-off is so important that there's a metric specifically for it: the F1-Score. It combines Precision and Recall into one, tidy number. A high F1-Score tells you that your churn model is both effective and efficient—delivering real business value, not just a nice-looking accuracy percentage.
Got Questions About Churn Prediction? We've Got Answers.
Even with the best roadmap, hitting the ground running with a new strategy like churn prediction always brings up a few questions. That's perfectly normal. Let's tackle some of the most common ones that pop up when teams are just getting started.
Getting these cleared up from the get-go helps everyone set realistic expectations and makes sure you’re pointed in the right direction.
How Much Data Do We Actually Need?
This is probably the number one question I hear. The honest answer? Quality always, always trumps quantity. There's no magic number, but having a few thousand customer records where you know for sure whether they churned or not is a great place to start.
What's far more critical is having clean, reliable historical data, ideally stretching back at least a year or two. This isn't just about purchase history; you need the full picture—customer behavior, transaction details, and every support ticket or interaction. It’s much smarter to start with a smaller, pristine dataset than to wrestle with a massive, messy one.
Should We Build Our Own Model or Buy a Tool?
The classic "build vs. buy" debate. The right choice here really boils down to your team's resources and long-term goals.
Off-the-shelf tools are fantastic for getting up and running quickly. They don't require a deep bench of data scientists and can start delivering value almost immediately, which is a huge plus for many teams.
But if customer retention is the lifeblood of your business, a custom-built model will pay for itself over and over again. It gives you incredible flexibility and accuracy because it’s built specifically for your business, your data, and your customers' unique behaviors. A custom churn prediction model almost always delivers a higher long-term ROI by finding the subtle signals that generic tools might miss.
At SigOS, we close the loop between what your customers are saying and what your product team is building. Our platform digs through support tickets, sales calls, and usage data to find the exact friction points causing churn and the features that customers are begging for. We help you build what matters. Discover how SigOS can reduce your churn.
Keep Reading
More insights from our blog


Ready to find your hidden revenue leaks?
Start analyzing your customer feedback and discover insights that drive revenue.
Start Free Trial →