How to Reduce Customer Churn and Boost Retention
Learn how to reduce customer churn with proven strategies. Discover how to analyze churn drivers, personalize outreach, and boost customer loyalty.

To really get a handle on customer churn, you have to do two things: first, figure out why people are leaving, and second, build an experience that makes them want to stick around. This means shifting your mindset from putting out fires to using data to proactively deliver value, keep customers engaged, and constantly get better. When you do this, retention stops being an afterthought and becomes a central part of how you do business.
Why Churn Is More Than Just a Number

Losing customers is obviously expensive, but the true damage from churn runs much deeper than a single lost account. It’s a silent killer of growth that slowly eats away at your revenue, drives up acquisition costs, and can destabilize your entire business.
Too many companies look at a small monthly churn rate and think it's manageable. That's a dangerous mistake.
Even a seemingly tiny monthly churn percentage can have a massive impact over a year. For instance, a 5% monthly churn rate doesn't sound terrible, but it adds up to losing nearly 46% of your customers annually. Think about that—you'd have to replace almost half of your entire customer base every year just to stand still. You can dig deeper into the state of retention and its business impact by reviewing the full report.
The Compounding Effect of Monthly Churn on Annual Customer Loss
This table shows just how quickly a small monthly churn rate can snowball into a major annual problem. A percentage point or two might seem insignificant month-to-month, but the long-term difference is stark.
| Monthly Churn Rate | Annual Customer Retention Rate | Annual Customer Churn Rate | Customers Remaining (from 1,000) |
|---|---|---|---|
| 1% | 88.6% | 11.4% | 886 |
| 2% | 78.5% | 21.5% | 785 |
| 3% | 69.4% | 30.6% | 694 |
| 4% | 61.3% | 38.7% | 613 |
| 5% | 54.0% | 46.0% | 540 |
As you can see, the gap between a 1% and 5% monthly churn rate means the difference between keeping 886 customers and only 540 over the course of a year. That's why getting ahead of churn is so critical.
The True Cost of Inaction
When you don't tackle the root causes of why customers leave, you're not just losing their subscription fees. You're losing valuable data, potential brand advocates, and opportunities to expand those accounts.
The strain on your internal teams is huge, too. Your sales and marketing departments have to work overtime just to tread water, constantly trying to replace the customers who are quietly slipping away. It’s an exhausting cycle.
This creates a hamster wheel of customer acquisition that makes real growth incredibly difficult. Just think about the resources you end up wasting on:
- Increased marketing spend to keep filling a leaky bucket.
- Higher sales commissions and effort to close new deals.
- Reputational damage from unhappy former customers sharing their experiences.
A Tale of Two Companies
Let's make this real with a quick example. Imagine two SaaS companies, "Company A" and "Company B," both starting the year with 1,000 customers.
Company A has its churn under control at a healthy 2% per month. Company B is struggling a bit more, with a 4% monthly churn rate.
On the surface, a 2% difference doesn't sound like a catastrophe. But let’s see what happens after 12 months.
- Company A (2% monthly churn) ends the year with around 785 customers.
- Company B (4% monthly churn) finishes the year with only 613 customers.
That "small" 2% difference cost Company B nearly a quarter of its customer base compared to Company A. That gap will only get wider over time. This is exactly why tackling churn head-on isn't just a "nice-to-have"—it's an essential function for building a resilient and profitable business.
Finding the Real Reasons Customers Leave

You can't fix a problem you don't truly understand. Trying to reduce customer churn without first figuring out the root causes is like throwing darts in the dark. You might hit the board once in a while, but you're mostly just wasting time and money on solutions that don't stick. We often assume it's about price or a missing feature, but the real story is usually far more nuanced.
The clues are already there, scattered across thousands of data points your business creates every single day. The trick is knowing where to look and how to connect the dots. Instead of just guessing, you need a solid way to uncover the specific friction points that are actually pushing your customers out the door.
Moving Beyond Surface-Level Surveys
Exit surveys have their place, but let's be honest—they often give you lagging, incomplete, or even misleading information. A customer who has already made up their mind to cancel is just looking to get the process over with and might give you the simplest answer possible.
Real insight comes from digging into behavior and feedback before they decide to leave. To get this right, you have to bring three critical data sources together:
- Product Usage Metrics: How are people really using your product? Which features are part of their daily workflow, and which ones are collecting dust?
- Support and Communication Data: What are the common threads in your support tickets, live chats, and sales calls? What problems keep coming up again and again?
- Direct Customer Feedback: What are customers telling you in surveys, reviews, and one-on-one interviews?
When you start looking at these sources in unison, clear patterns begin to emerge. This is where a platform like SigOS can be a game-changer. It’s built to pull in all these different data streams and use AI to make sense of them, moving you from a mountain of raw data to insights you can actually act on.
A Practical Framework for Churn Diagnosis
Let's walk through a real-world scenario. Imagine you're a product manager at a SaaS company that makes project management software. You've noticed a worrying spike in churn among your mid-market accounts. Here’s how you could get to the bottom of it.
Dig into Product Analytics
First, you need to look at what churned accounts were doing differently from your happy, retained customers, especially in the 90 days before they canceled. Don't just look at logins; that’s too high-level. You have to get more granular.
Using your analytics, you might find that 80% of churned accounts shared a common behavior: they stopped using the "Team Collaboration" feature after the first month. That’s a massive red flag. It’s a powerful leading indicator that points to a breakdown in feature adoption or a failure to see its value.
Analyze Your Support Tickets
Next, pivot to your support data. No one has time to read thousands of tickets manually, but an AI-powered tool can spot themes in seconds. You could feed your Zendesk or Intercom data into SigOS and ask it to find common complaints from that same mid-market segment.
Suddenly, a theme pops up. The platform flags a ton of tickets where users complained about setting permissions within the "Team Collaboration" feature. They used words like "clunky" and "unintuitive." Now, the product usage data clicks into place. Customers weren't ignoring the feature because it was useless; they were giving up on it because it was too frustrating to set up.
Correlate with Qualitative Feedback
The final step is to connect this with your qualitative feedback. You filter your recent Net Promoter Score (NPS) survey comments to see what detractors in that segment were saying. The comments seal the deal, with quotes like, "Great tool, but inviting my team was a nightmare," or "We couldn't figure out who could see what."
You’ve just connected the dots. The journey went from behavior (abandoning a feature) to support tickets (permission issues) to direct feedback (frustrating UX). The real reason for churn wasn't price or a competitor—it was a specific, fixable usability problem in a core feature.
Now you know exactly how to reduce customer churn for this group. The answer isn't a discount. It’s redesigning the permissions workflow, creating better onboarding materials for that specific feature, and maybe even proactively reaching out to new accounts to walk them through team setup. This targeted, data-backed approach is worlds more effective than a generic retention campaign because it solves the actual problem.
Building a Proactive Customer Experience

If you really want to slash your churn rate, you have to build an experience so good that leaving doesn't even cross your customers' minds. This means ditching the reactive, fire-fighting mindset where you only jump in when something breaks. It’s time to start looking for the smoke, not waiting for the alarm.
A proactive approach is all about anticipating needs, making your communication feel personal, and constantly showing your value before a customer starts to drift away. You're building a real relationship, not just processing another transaction. When you nail this, your customer service team stops being a cost center and becomes one of your most powerful tools for retention.
The link between service quality, loyalty, and spending is undeniable. In the US, 59% of people will walk away from a brand after a few bad experiences, and a staggering 17% will leave after just one. But on the flip side, customers who feel heard are 74% more loyal, and those who have great experiences end up spending 140% more. You can dig into more of these stats on the connection between customer experience and retention from Sprinklr.
Anticipate Needs Before They Arise
Being truly proactive means solving problems before your customers even know they have them. You have to learn to read the signals they're sending through their behavior, their feedback, and every interaction they have with your product. When you start connecting those dots, you can stop guessing what they want and start knowing what they’ll need next.
Let's say you notice in your usage data that new users who fail to invite a teammate within their first week are 50% more likely to churn. Don't just sit on that information. You can build an automated, yet thoughtful, workflow to guide them.
- Day 3: Send a friendly email with a quick video showing the perks of collaborating with their team.
- Day 5: If they still haven't invited anyone, pop up an in-app message offering a quick tour of the collaboration features.
- Day 7: At this point, you could trigger a task for a customer success manager to reach out personally and see if they need a hand.
This isn’t about badgering them. It's about giving timely, helpful guidance that helps them get to that "aha!" moment with your product much faster.
Personalize Every Interaction
In a market this crowded, generic, one-size-fits-all communication just gets deleted. Personalization is what makes a customer feel like you actually see them and value their business. It’s a critical piece of any strategy for how to reduce customer churn, and it goes way beyond just using a {first_name} tag in your emails.
Real personalization means using what you know about a customer to make every single touchpoint feel relevant to them. Think about things like:
- Behavior-Based Messaging: Send tips based on the features a customer is using—or more importantly, the ones they aren't using but should be.
- Lifecycle Communication: The way you talk to a brand new trial user should be completely different from how you talk to a power user who's been with you for years.
- Role-Specific Content: Share case studies or best practices that are specific to their industry or job title.
This is where platforms like SigOS really shine. By digging through customer data from support tickets, calls, and product usage, it can surface patterns you might otherwise miss. This allows you to spot a group of users who are all getting stuck in the same place and create a tailored outreach campaign to help them through that exact friction point—long before they get frustrated enough to leave.
Turn Feedback into a Retention Tool
Every single piece of feedback you get—from a five-star review to an angry support ticket—is a golden opportunity to strengthen your customer relationships. A proactive experience means you're not just collecting this feedback, you're actively seeking it out and, crucially, showing that you're acting on it.
When someone submits a feature request, don't let it vanish into a black hole. Acknowledge it right away, give them updates on its status, and make sure to notify them personally if you end up building it. That simple act of closing the loop proves you're listening.
And honestly, a complaint is a gift. It's a chance to turn a bad experience into a great one. By responding quickly, with empathy, and with a clear solution, you can often save an at-risk account and even turn a detractor into a huge fan. Empower your support team to do more than just close tickets; train them to find the root cause of an issue and propose fixes that prevent anyone else from having the same problem. That's how you build real trust and make your customer experience an advantage that your competitors can't easily copy.
Launching Retention Campaigns That Actually Work
You've identified the churn drivers and started building a more proactive customer experience. Now comes the critical part: intervention. But let's be honest, a generic, last-ditch "please don't go" email with a 10% discount is a waste of everyone's time. It feels desperate and completely misses the real reason a customer is heading for the exit.
The real art of retention is launching personalized campaigns that feel helpful, not panicked. This means moving past the one-size-fits-all offers and getting smart about segmenting your at-risk customers. The goal is to deliver the right solution at the right time, turning a potential loss into a loyal fan.
Segmenting for Smarter Interventions
The first thing you need to do is group your at-risk customers into meaningful segments. A high-value account that suddenly goes dark needs a completely different approach than a low-engagement user who never really got started. You have to match the intervention to the specific problem.
Here are a few practical segments I've seen work time and again:
- The Quiet Ones: These are customers who haven't logged in or used key features in over 30 days. They've likely lost momentum or simply forgotten the value your product brings to their workflow.
- The Budget-Conscious: This group includes customers who have asked about pricing, viewed the cancellation page multiple times, or belong to an industry known for tight budgets.
- The Fading Champions: Your power users whose engagement is suddenly dropping off. This is a massive red flag. It often means they've hit a new point of frustration or are actively looking at your competitors.
- The Frustrated Users: These are the folks who have recently filed multiple support tickets or been impacted by a known bug. Their patience is thin, and they need immediate, effective help.
When you start identifying these distinct groups, you can stop guessing and start creating targeted campaigns that actually address their specific pain points.
The proof is in the data. We've seen that as personalized retention efforts are implemented and refined, the churn rate steadily decreases. This chart shows a real-world example of churn dropping from 8% to 6% in just three months after a targeted strategy was put in place.
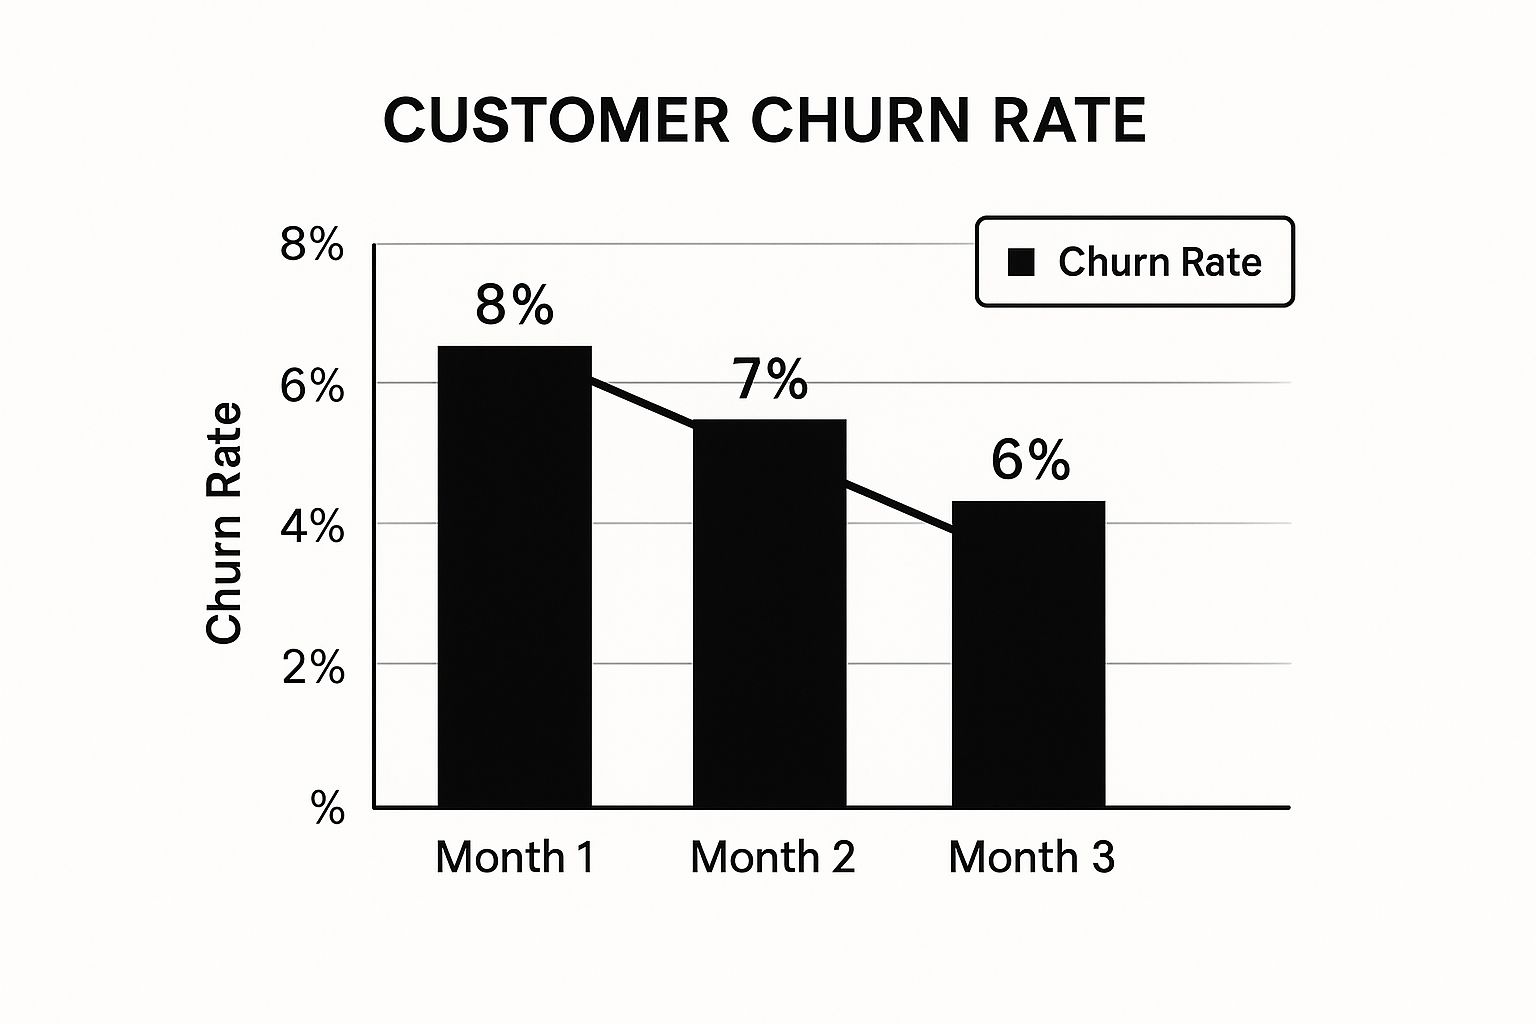
It’s a clear visual of how a data-driven approach pays off.
Crafting Campaigns That Resonate
Once your segments are defined, you can start designing interventions that will actually make a difference. Let's get practical and look at what this means for different at-risk customers.
Instead of spamming everyone with the same offer, you need a more nuanced playbook. The table below breaks down how to move from ineffective, generic offers to personalized interventions that get results.
Churn Intervention Strategies by Customer Segment
| Customer Segment | Churn Indicator | Ineffective Generic Offer | Effective Personalized Intervention |
|---|---|---|---|
| Inactive Users | No login for 30+ days. | "We miss you! Here's 10% off." | A re-engagement email highlighting a new, relevant feature they haven't tried. |
| Price-Sensitive | Visited cancellation page multiple times. | "Stay with us and get a discount!" | Proactively offer to pause their subscription or suggest a downgrade to a more affordable plan. |
| Fading Champions | Usage of key features drops by 50%. | An automated "checking in" email. | A personal outreach from a Customer Success Manager to diagnose the issue and offer expert help. |
| Frustrated Users | Multiple support tickets in one week. | A survey asking about their support experience. | A direct, personal apology and a clear action plan from a support lead to resolve the core problem. |
These tailored approaches show customers you're paying attention to their individual needs, which is far more powerful than any blanket discount. Let's break down how to execute this.
For the Quiet Ones: A simple re-engagement email series can work wonders here. The goal isn't just to remind them you exist, but to remind them of the value they're missing out on.
- Try this subject line: "Did you see what's new in [Your Product], [First Name]?"
- Make the call to action easy: "Explore the new reporting dashboard in just 2 minutes."
For the Budget-Conscious: Blasting a discount can devalue your product in the long run. A much better approach is to offer flexibility and understanding.
- Example offer: "Need to adjust your budget? Let's find a plan that works for you." This opens a conversation rather than just throwing money at the problem.
For your Fading Champions: This is where you need to roll out the white-glove treatment. An automated email simply won't cut it for these valuable accounts.
- High-touch outreach: "Hi [First Name], I noticed your team's usage has dipped recently and wanted to check in personally. Is everything okay? I have a few ideas for how you can get more from [feature X] if you have 15 minutes to chat."
This level of personalization is how you save your most important accounts. By using a product intelligence platform like SigOS, you can automate the detection of these churn signals, which makes it much easier to trigger the right intervention for the right customer segment. This helps you build a scalable retention engine that not only saves at-risk customers but actually strengthens your overall customer relationships.
Measuring and Refining Your Retention Strategy
Getting your first retention campaigns out the door is a big win, but the work doesn’t stop there. The real secret to a lasting strategy for reducing customer churn isn't a single silver bullet—it's building a cycle of continuous improvement. You can't just launch a campaign and hope for the best. You have to constantly measure, learn, and adjust based on what the data is telling you.
This means shifting your mindset from one-off fixes to creating a data-driven retention engine that sits at the very core of your business. It's an ongoing process, not a one-time project. Your goal is to figure out what's working, what's falling flat, and where you should focus your energy for the biggest impact.
Defining Your North Star Metrics
You can't improve what you don't measure. Before you do anything else, you need to define what success actually looks like. While there are dozens of metrics you could track, getting lost in the weeds is easy. My advice? Focus on a handful of key performance indicators (KPIs) that tell the true story of your customer relationships.
Start with these three essentials:
- Customer Churn Rate: This is your primary health check. Track it monthly and quarterly to get a clear picture of how your interventions are moving the needle.
- Customer Lifetime Value (CLV): This number tells you the total revenue you can expect from a single customer over their entire relationship with you. As churn goes down, CLV should go up—proving the real financial return on your efforts.
- Retention Cohorts: Don't just look at the overall churn number. A cohort analysis groups customers by their sign-up date (e.g., the "January 2024 cohort") and tracks their behavior over time. This is how you spot trends and see if, for example, your new onboarding flow is actually better at keeping customers around than the old one.
Tracking these KPIs is how you move from guesswork to making decisions based on cold, hard facts.
Building Your Retention Dashboard
Once you know what you’re measuring, you need a single place to see it all. This is where a dedicated retention dashboard comes in—it’s your command center. Whether you build it in a business intelligence tool or use a platform like SigOS, your dashboard should give you an at-a-glance view of your most important metrics.
This is about more than just pretty charts. It's about creating a single source of truth that your whole team can get behind. When the product team sees how a feature release impacted the churn rate for a key segment, they can make smarter roadmap decisions.
Your dashboard should answer one critical question instantly: "Are our efforts to keep customers actually working?" If the answer is no, it should give you the clues you need to figure out why.
This kind of visibility turns churn reduction from a siloed task into a shared, company-wide mission.
From Data to Actionable Insights
Collecting data is the easy part. The real skill is in turning that data into insights you can act on. It’s all about connecting the dots between your actions and the results you see on your dashboard.
For instance, customer churn rates can swing wildly depending on the industry. The consumer packaged goods (CPG) sector saw median churn rates hit 40% in 2025. This was partly driven by the pandemic, which caused 76% of consumers to experiment with new shopping habits. You can explore more industry churn rates here. That volatility forces CPG brands to listen intently. Coca-Cola HBC, for example, started using customer feedback platforms to get ahead of problems before they led to churn, allowing them to tweak products and messaging based on real-time sentiment.
So how does this look in practice? Imagine a CPG brand with a subscription box service. They roll out a discount offer to at-risk customers but see only a tiny drop in churn. Discouraging, right?
But then they look at their cohort analysis. They spot an alarming trend: customers are churning at a huge rate right after receiving their second box. Digging into customer feedback, they find a pattern of complaints about a lack of product variety.
Now they have a real insight. They scrap the generic discount and instead A/B test a new campaign that lets subscribers customize one item in their second box.
The result? The churn rate for that specific cohort drops by 15%. That’s the cycle in action: measure, analyze, hypothesize, and test. By constantly refining your strategy with real data, you turn churn reduction from a reactive chore into a proactive advantage that fuels sustainable growth.
Got Questions About Churn? Let's Dig In.
Even with the best strategy, tackling customer churn can bring up some tricky questions. You’re in the trenches, dealing with real customers and unique situations, and sometimes the standard advice just doesn't cut it. Let’s go through some of the most common questions I hear and get you some practical, no-nonsense answers.
How Do I Actually Calculate My Churn Rate?
This seems simple on the surface, but the truth is, there's more than one way to slice this data. The classic formula is (Customers Lost ÷ Total Customers at Start of Period) × 100. It's a decent starting point, but it barely scratches the surface.
To get a real feel for the health of your business, you need to look at it from a few different angles:
- Logo Churn: This is the one most people start with—it’s the percentage of customers (or "logos") you've lost. It’s a great barometer for overall customer happiness and whether your product is hitting the mark.
- Revenue Churn (MRR Churn): This, in my opinion, is where things get serious. It measures the percentage of revenue lost from those canceled accounts. Losing one enterprise customer paying 10,000/month hurts a whole lot more than losing ten small accounts paying ****50/month, and this metric makes that pain crystal clear.
- Net Revenue Churn: This is the holy grail. It takes your revenue churn and then subtracts any expansion revenue you've gained from your existing customers (think upgrades, add-ons, and cross-sells). If you can achieve negative net revenue churn, you've hit a major milestone. It means your existing customer base is growing in value faster than you're losing revenue from cancellations.
So, which one should you use? Honestly, you should track both logo and net revenue churn. Together, they give you the most complete picture of both customer health and financial momentum.
What Are the Real, Early Warning Signs of Churn?
Customers rarely leave out of the blue. They almost always leave a trail of breadcrumbs, and your job is to spot them before they walk out the door.
A drop in product usage is the obvious one, but don't just look at logins. You need to get more granular. Are they still using the "sticky" features? You know, the core functions that solve their biggest pain points. For a project management tool, that could be a sudden drop in creating new projects or collaborating with team members.
One of the most telling signs is also one of the most overlooked: silence. If a once-active customer who regularly submitted support tickets or offered feedback suddenly goes quiet, don't assume they're happy. They might have just given up.
Keep an eye out for these other subtle red flags:
- Suddenly ghosting their customer success manager on scheduled check-in calls.
- Letting their payment method fail multiple times without a quick update.
- Checking out the pricing or cancellation page a few too many times.
- When their main champion or power user leaves the company (this is a big one!).
A platform like SigOS can be your eyes and ears here, automatically flagging these behavioral shifts so you can see which accounts are at risk in real-time.
Is It Ever Okay to Let a Customer Go?
It sounds crazy in a guide about reducing churn, but yes, absolutely. Not all business is good business, and sometimes the smartest move you can make is to strategically let a customer go. Trying to be the perfect solution for everyone will burn out your team and dilute your product.
It’s probably time to part ways if a customer fits into one of these buckets:
- They’re a Terrible Fit: They’re constantly trying to jam a square peg into a round hole, using your product for something it was never built to do. They’ll never be truly happy, their feature requests will pull your roadmap off course, and they’ll drain your support team’s resources.
- They’re Unprofitable: Some customers cost you more than they pay. If one account is gobbling up a disproportionate amount of support time and engineering resources, you need to do the math. You might be losing money by keeping them.
- They’re Abusive to Your Team: This is a hard line. No subscription fee is worth the mental and emotional toll on your employees. Your team’s well-being always comes first.
Letting go of a bad-fit customer isn't a failure. It’s a strategic decision that frees up your team to focus on serving your ideal customers—the ones you can truly help succeed.
Ready to turn customer feedback into actionable revenue insights? SigOS uses AI to analyze support tickets, calls, and usage data to pinpoint exactly what's driving churn and what features will unlock growth. Learn how to prioritize your product roadmap with confidence at SigOS.
Keep Reading
More insights from our blog


Ready to find your hidden revenue leaks?
Start analyzing your customer feedback and discover insights that drive revenue.
Start Free Trial →