Predictive Churn Modelling That Actually Works
A practical guide to predictive churn modelling. Learn the methods, models, and real-world strategies that help businesses proactively reduce customer turnover.

Predictive churn modelling is all about using the customer data you already have to get a jump on who might be thinking of leaving. It’s a complete shift in mindset—instead of just reacting when a customer cancels, you get ahead of the problem and work to prevent it from happening in the first place. By spotting those at-risk accounts, you can step in with the right message at the right time.
Why Churn Modelling Is a Business Imperative

Think of your business like a bucket you're trying to keep full of water. Every new customer is another splash of water you pour in. But what if that bucket has holes? You're constantly losing water, no matter how quickly you try to fill it. That’s customer churn—a quiet but steady leak that drains your resources and kills your growth.
The hamster wheel of customer acquisition is exhausting and expensive. In fact, it can cost five times more to bring in a new customer than to hold on to an existing one. This is exactly where predictive churn modelling becomes less of a "nice-to-have" and more of a core business tool. It’s the art and science of patching the leaks before they start.
Moving from Reactive to Proactive Retention
Instead of just reacting to a cancellation notice, this kind of modelling helps you read the tea leaves. It picks up on subtle changes in behavior—maybe a customer is logging in less often, using fewer features, or has stopped submitting support tickets. These are the tell-tale signs of someone quietly drifting away, and having this foresight is a huge competitive advantage.
This proactive approach means you can intervene with surgical precision. No more guessing who needs a little extra attention; the data points you right to them. This kind of data-backed strategy is quickly becoming a non-negotiable for any modern business.
The Financial Impact of Predicting Churn
The value here isn't just theoretical. The global predictive analytics market—the tech that powers these models—was valued at a staggering 18.02 billion in 2024. It’s projected to explode to ****91.92 billion by 2032, which is a compound annual growth rate of 22.5%. North America is leading the charge, making up 38.73% of that market in 2024.
When a business gets predictive churn modelling right, the financial upside is significant:
- Increased Customer Lifetime Value (CLV): Keeping a customer around for just a few extra months can dramatically boost their total value to your business.
- Improved Marketing Efficiency: You can stop wasting money on broad acquisition campaigns and instead focus your budget on targeted retention efforts for the specific segments that need it.
- Enhanced Product Development: The reasons people churn often shine a bright light on product flaws or missing features, giving you a clear roadmap for what to build next.
Understanding churn is a cornerstone of any of the top customer retention strategies. It’s about more than just numbers on a dashboard; it’s about having a deep, honest understanding of your customer base and the long-term health of your company. A great first step is to master the key customer retention metrics that will eventually fuel your predictive model.
Speaking the Language of Churn Prediction
Before you can build a model to predict churn, you need to get comfortable with the terminology. Think of it less like learning academic jargon and more like learning the key phrases that unlock a powerful retention strategy. Nailing these core concepts is the first step in turning raw data into real-world decisions.
The most basic metric is, of course, the churn rate—the percentage of customers who walk away during a specific period. But that single number is just a headline; it doesn't tell you the full story. To get actionable insights, we have to look closer at the why and the when.
This brings us to the customer lifecycle. It's the entire journey a customer takes with your business, from the day they sign up, to becoming a power user, and maybe, to the moment they start looking for the exit. A good churn model is constantly scanning for red flags at every single stage of that journey.
The Ingredients for a Solid Prediction
So, how do you spot those red flags? A predictive model is like a detective, and it needs clues. When you piece these clues together, you start to see a clear picture of who is at risk of leaving.
- Historical Data: This is your evidence locker. It contains everything a customer has ever done: past purchases, how often they use your product, the number of times they've contacted support. Every interaction leaves a digital footprint.
- Prediction Window: This is your crystal ball. It sets the timeframe for your forecast. For instance, a 30-day window tries to pinpoint customers who are likely to churn in the next month, giving your team a crucial heads-up to intervene.
- Feature Importance: This tells you which clues matter most. The model might discover that a sharp drop in weekly logins is a far more powerful churn indicator than, say, the customer's pricing plan.
By analyzing these elements, patterns begin to emerge. It's crucial to know if these patterns are real signals or just random noise. To learn more about that, check out our guide on what is statistical significance.
Focusing on the Churn You Can Actually Prevent
It’s also important to understand that not all churn is the same. Your models need to zero in on the customers you have a realistic chance of saving.
We can split churn into two major types:
- Voluntary Churn: This is when a customer makes a conscious choice to cancel. Maybe they weren't happy, found a competitor, or their needs simply changed. This is the holy grail for predictive modeling because you can often do something about it.
- Involuntary Churn: This happens for reasons beyond the customer's immediate control, like a credit card expiring and a payment failing. This is more of an operational issue, usually handled by automated payment recovery systems, not complex predictive models.
By concentrating your predictive efforts on voluntary churn, you make sure your retention budget and team's energy are spent on customers you can actually win back. Getting this foundation right is what prepares you to pick the right tools for the job.
Choosing The Right Churn Prediction Model

Alright, you've defined what churn means for your business and wrangled your data into shape. Now for the exciting part: picking the right tool for the job. Think of machine learning models as a specialized toolkit for predicting churn. Just as a mechanic wouldn't use a hammer for an oil change, a data scientist selects a model based on the specific problem, the data on hand, and what they need to accomplish.
There's no single "best" model that works for every company. It's all about understanding the trade-offs. You're typically balancing three key things:
- Accuracy: How good is the model at making correct predictions?
- Interpretability: Can you easily understand why the model made a certain prediction?
- Complexity: How much time and computational power does it take to build and run?
Let's look at the most common tools in the churn prediction toolkit.
H3: Logistic Regression: The Reliable Starting Point
If your toolkit had a trusty Swiss Army knife, it would be Logistic Regression. This model is straightforward, runs efficiently, and is incredibly easy to interpret. It works by calculating the probability of a simple, binary outcome—in our case, will a customer churn, or will they stay?
Its biggest advantage is its crystal-clear logic. The model spits out a simple equation showing how factors like "days since last purchase" or "number of support calls" directly impact the churn risk score. This makes it a fantastic starting point for any team just dipping their toes into predictive analytics. You get real, actionable insights without the "black box" mystery of more advanced techniques.
Of course, that simplicity is also its main limitation. Logistic Regression assumes a linear relationship between your inputs and the outcome, which isn't always how messy, real-world customer behavior works. For more complex patterns, you'll need to reach for a more powerful tool.
H3: Random Forests: The Power of Collective Wisdom
When you absolutely need higher accuracy, it’s time to bring in the heavy machinery. A Random Forest is a perfect example. It operates on a simple but incredibly powerful idea: the wisdom of the crowd.
Think of it this way: instead of asking one expert for their opinion, you assemble a large panel of diverse experts and take a vote. A Random Forest does exactly this, but with your data. It builds hundreds (or even thousands) of individual decision trees—simple flowchart-like models—and then averages their predictions to arrive at a highly accurate and stable final answer.
This collective approach allows the model to uncover complex, non-linear relationships in your data that a simpler model would completely miss. The trade-off? It's less of a glass box. While you can see which factors were most important overall, pinpointing the exact logic behind a single customer's churn score is much harder than with Logistic Regression.
H3: Gradient Boosting and Neural Networks: The High-Performance Engines
For businesses that demand the absolute highest predictive power, models like Gradient Boosting Machines (GBMs) and Neural Networks are the top-of-the-line options. Gradient Boosting is a cousin to Random Forests, but it builds its decision trees one after another. Each new tree focuses on correcting the mistakes made by the previous one, creating an incredibly precise and powerful ensemble.
Neural Networks go even further, mimicking the structure of the human brain to find incredibly subtle and complex patterns within massive datasets. These are the high-performance engines you bring in when every percentage point of accuracy matters.
A Practical Comparison of Churn Prediction Models
Choosing the right machine learning model involves balancing simplicity, interpretability, and raw predictive power. Logistic Regression is often the go-to for its clarity, while models like Random Forests and Gradient Boosting are favored in sectors like telecom and finance where accuracy is paramount. The table below breaks down the key trade-offs to help you decide.
| Model Type | Best For | Key Advantage | Main Limitation |
|---|---|---|---|
| Logistic Regression | Teams needing clear, explainable results and a solid baseline model. | Highly Interpretable: Easy to understand which factors drive churn. | Simplicity: May miss complex, non-linear patterns in customer behavior. |
| Random Forest | Achieving high accuracy while maintaining some insight into feature importance. | Robust and Accurate: Excellent at handling complex data without much tuning. | Less Interpretable: Hard to trace the logic for a single prediction. |
| Gradient Boosting | Squeezing out the maximum possible accuracy for critical business decisions. | Peak Performance: Often the most accurate model for structured data. | Complexity: Requires careful tuning and can be prone to overfitting. |
| Neural Networks | Analyzing massive, complex datasets with very subtle behavioral patterns. | Uncovers Deep Patterns: Can model highly intricate, non-linear relationships. | "Black Box" Problem: Extremely difficult to interpret and requires huge amounts of data. |
Ultimately, the goal is to pick a model that not only delivers the accuracy you need but also provides insights you can act on. The best choice often depends on your team's skills and the tools at your disposal.
Many modern platforms are designed to simplify this selection process. If you're exploring your options, our guide on the best predictive analytics software can provide some valuable direction.
Your Step-By-Step Implementation Playbook
Building a predictive churn model from scratch might feel like a massive undertaking, but it’s really just a series of well-defined steps. Think of this as your playbook—a proven guide to get you from an idea to a fully working model that actually helps your business.
The whole process is a loop, not a straight line. You'll find yourself revisiting earlier stages as you uncover new insights from your data, and that’s perfectly normal. The most important thing is to have a clear plan and keep moving forward.
Stage 1: Defining Churn
First things first: you can't predict what you haven't defined. What does "churn" actually mean for your business? The answer isn't universal; it's unique to your specific model.
- For a SaaS company, churn is often straightforward: a customer cancels their subscription or doesn't renew.
- In e-commerce, it's more nuanced. You might define a churned customer as someone who hasn't bought anything in the last 90 days.
- For a mobile app, churn could be a user who hasn't logged in for 30 days.
This definition becomes your north star. Everything that follows—from the data you collect to the model you build—is aimed at this single, crucial metric. A fuzzy definition will only lead to a useless model.
Stage 2: Data Collection And Preparation
With a solid definition of churn, it’s time to gather your raw materials: the data. This is where the old saying "garbage in, garbage out" isn't just a cliché; it's an absolute truth. Your model’s predictive power is completely dependent on the quality of the data you feed it.
The goal here is to build a complete, 360-degree picture of each customer. This means pulling data from all the places your customers interact with you:
- CRM Systems: Customer info, contract details, and interaction history.
- Product Analytics Tools: How often people log in, which features they use, how long they stay.
- Billing Systems: Payment history, subscription plans, and any failed transactions.
- Support Platforms: How many support tickets they've raised and how satisfied they were with the help.
Once you have it all, the real work begins. You'll need to clean up this messy data—filling in missing values, standardizing formats, and merging it all into one master file that gives you a single, unified view of each customer.
Stage 3: Feature Engineering
This is where the art meets the science. Feature engineering is the process of turning that raw data into meaningful signals—or "features"—that a machine learning model can actually understand. You're basically a data detective, looking for the clues that point toward a customer leaving.
It’s all about creating new variables from the data you already have. For example, a customer's sign-up date is okay, but engineering new features from it is much more powerful:
- Customer Tenure: How many days have they been with you?
- Days Since Last Login: A huge red flag for declining engagement.
- Support Ticket Ratio: The number of support tickets they’ve filed divided by their tenure.
- Usage Trend: Is their activity in the app increasing or decreasing over the last month?
This infographic shows how these stages flow together, starting with raw data and ending with a trained model.
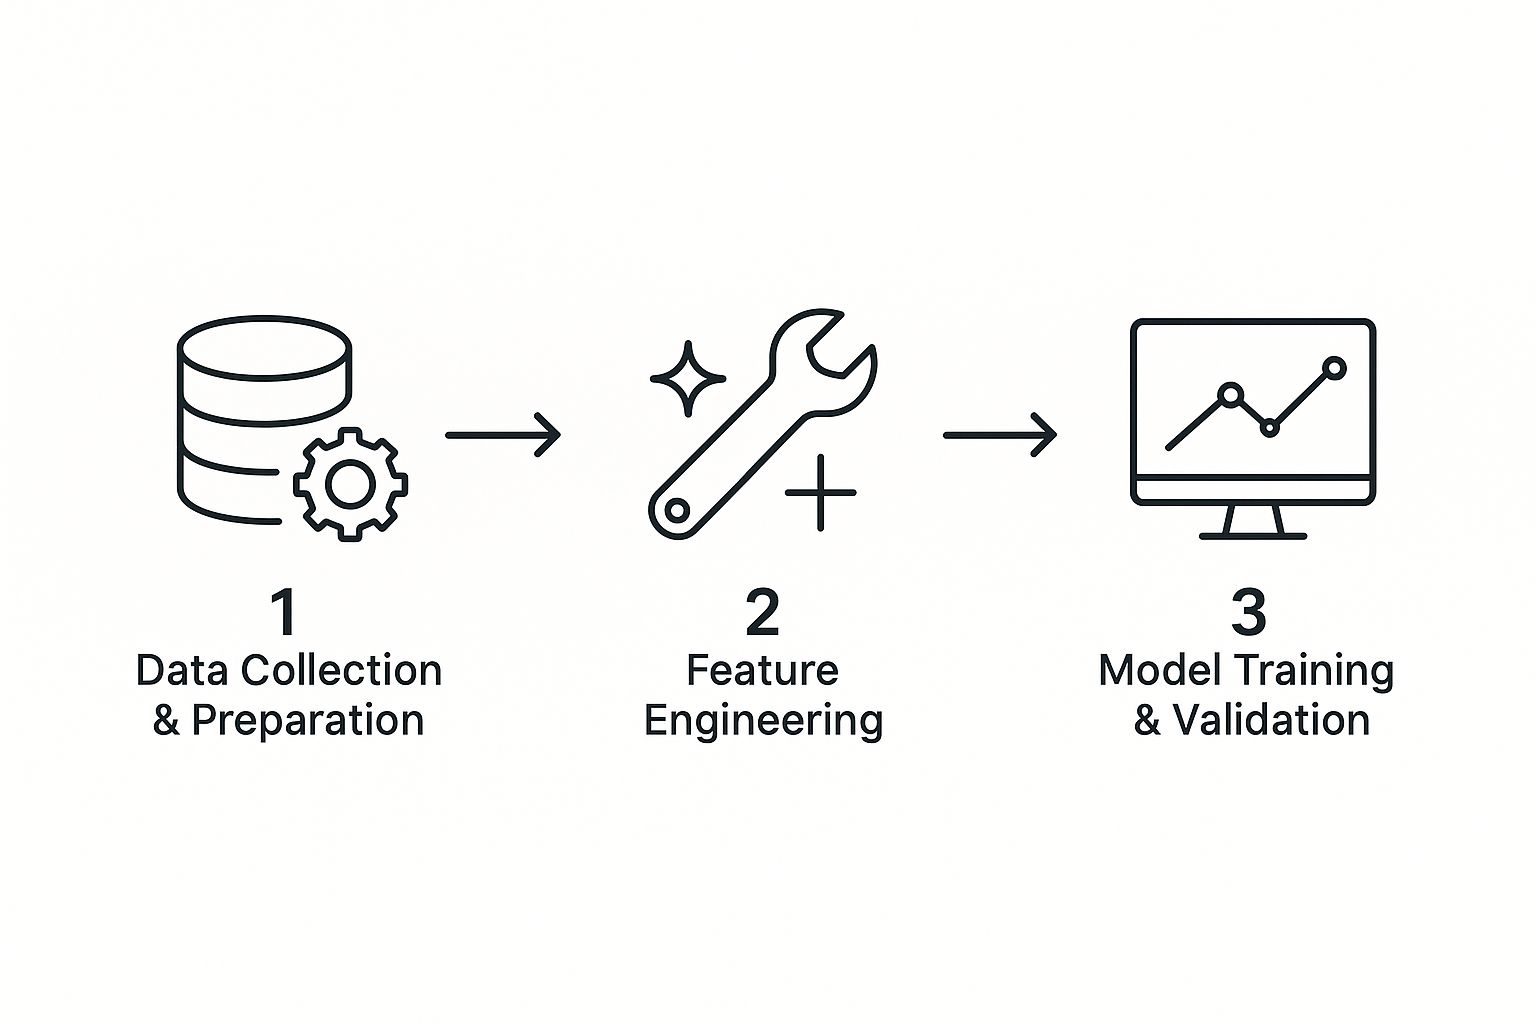
You can see how each step builds on the last, creating a strong foundation for accurate predictions.
Stage 4: Model Training And Validation
With your data prepped and features engineered, you're finally ready to train the model. This is where you feed all your historical customer data—now neatly labeled as "churned" or "not churned"—into a machine learning algorithm. The algorithm crunches the numbers and learns the subtle patterns that separate your happy customers from the ones who are about to leave.
But training is only half the battle. You have to validate the model's performance by testing it on a fresh set of data it has never seen before. This crucial step ensures your model can make accurate predictions on new customers and hasn't just memorized the old data.
Stage 5: Deployment And Monitoring
A predictive model sitting on a data scientist's laptop is worthless. To get value, you need to deploy it into your live business operations. This means setting up a system that can automatically score your customers on a regular schedule, raising a flag for anyone with a high probability of churning.
This is where the loop closes. The model’s output should kick off real-world actions, like automatically adding at-risk users to a re-engagement email sequence or creating a task for an account manager to call them. As you shift from planning to go-live, you might find that expert implementation support services can help make the transition much smoother.
Finally, remember that a model is never "done." Customer behavior is always changing, so you need to constantly monitor your model's performance to make sure its predictions are still on the money. This cycle of monitoring, retraining, and refining is what separates a one-time project from a long-term business asset.
Real-World Examples of Churn Modelling in Action

The theory is great, but the real magic happens when predictive churn modelling gets out into the wild. When a model moves from a data scientist's laptop to the front lines of a business, it becomes a powerful tool for getting ahead of customer loss. The applications are as different as the industries themselves, each tackling its own unique set of customer behaviors and churn triggers.
These examples show how a well-built model can stop you from playing a guessing game and start you on a precise, data-driven retention strategy. The impact is so significant that it's created a booming market for these tools.
Just look at the numbers. The customer churn software market in North America was already valued at over 1 billion in 2024 and is expected to climb to nearly ****2.84 billion by 2035. That's a growth rate of about 9.8% every year, which tells you just how essential these predictive tools have become in sectors from retail to healthcare. You can read more about the customer churn software market growth and its trajectory.
SaaS: Proactively Boosting User Engagement
In the Software-as-a-Service (SaaS) world, user engagement is everything. It's the pulse of your customer base. A smart subscription business will build a churn model that keeps a close eye on subtle but telling shifts in how people use the product.
Take a project management tool, for example. The model could flag a user who hasn't created a new project in 30 days or whose team suddenly stopped using a key collaboration feature. This isn't just a data point; it's a story unfolding—a story of declining value.
A churn model in SaaS acts as an early-warning system. It doesn’t just tell you who is at risk; it tells you why, allowing you to intervene with a solution that directly addresses their waning engagement.
Instead of just waiting for the cancellation email to land, the system can automatically trigger a tailored response. For this specific user, that might mean an email series highlighting advanced features they’ve never touched, or maybe an in-app pop-up inviting them to a live tutorial. The goal is to reignite that "aha!" moment and remind them why they signed up in the first place—before they start looking elsewhere.
E-commerce: Winning Back Lapsed Shoppers
For an e-commerce brand, churn is rarely a dramatic breakup. It's more like a slow fade. A customer doesn't call to cancel; they simply stop buying. A retail churn model might define a "churned" customer as someone who hasn't made a purchase in 90 days, especially if they used to buy something every month.
The model gets good at spotting these at-risk shoppers by analyzing patterns like:
- Slowing Purchase Cadence: Their time between orders gets longer and longer.
- Shrinking Basket Size: They start spending less with each purchase.
- Tuning Out: They stop opening promotional emails or clicking on links.
Once a previously loyal customer gets flagged, the marketing team can spring into action with surgical precision. They can send a personalized "we miss you" email with a tempting discount on products related to their past purchases. This is so much more effective—and cheaper—than a generic, sitewide sale. It's how you turn a potential loss into a renewed relationship.
Telecom: Preventing Network-Related Frustration
Telecom is a cutthroat industry. One bad experience—like a string of dropped calls—is all it takes for a customer to jump ship. Because of this, their churn models often zero in on a mix of service quality data and usage patterns.
For instance, a model might flag a customer who has called support multiple times to complain about poor network coverage at their home. If that same customer’s data usage and average call times also start to dip, their churn risk score will shoot through the roof.
Armed with this insight, the retention team doesn't have to sit back and wait. They can proactively reach out with a real solution, like offering a free network signal booster or a temporary discount for the trouble. It's a simple gesture that shows the company is listening and values their business, and it can be incredibly effective at stopping churn in its tracks.
Frequently Asked Questions About Churn Modelling
Even with a clear game plan, diving into predictive churn modeling can raise a few practical questions. This is where we shift from theory to reality, tackling the common hurdles and curiosities businesses face when they start turning data into a retention strategy. Let's clear up some of that uncertainty.
How Much Data Do I Need to Build an Effective Churn Model?
There’s no magic number here, but a good starting point is at least a few thousand customer records, each with a clear outcome—they either churned or they didn't. Honestly, though, quality and richness trump sheer volume every time. A smaller, cleaner dataset will always be more powerful than a massive, messy one.
You’ll want enough history to see real patterns emerge, which usually means having 12 to 24 months of data. This timeframe helps you smooth out any seasonality in your business, giving the model a much clearer picture.
The real key, however, is collecting the right kind of data. You should prioritize behavioral signals that tell a story about how engaged (or disengaged) your customers are. Things like:
- Transaction History: Are they buying consistently? Has their spending dropped off?
- Product Usage Metrics: How many times did they log in this month? What features are they actually using? Which ones are they ignoring?
- Customer Service Interactions: Are they flooding your support team with tickets? That’s often a huge red flag.
What Are the Most Common Implementation Challenges?
Interestingly, the biggest roadblocks are often operational, not technical. While picking the right algorithm matters, the real challenges usually pop up long before you get to the modeling stage.
The number one problem is almost always poor data quality or siloed information. When customer data is scattered across a dozen different systems that don't talk to each other, you can't get a complete picture of their journey. It's impossible to predict churn when you can only see a fraction of the story.
The next major hurdle is what we call feature engineering. This is the creative, and frankly crucial, process of turning raw data into meaningful predictors. It’s not enough to know a customer's sign-up date; you need to transform that into something powerful, like "days since last login." This step takes a deep, intuitive understanding of your customers and your product.
A highly accurate model is completely useless if its insights are ignored. Success demands a tight feedback loop between your data, marketing, product, and sales teams so they can act on the model’s predictions and measure what works.
Finally, getting buy-in from the rest of the organization is absolutely critical. A model might correctly flag a customer as high-risk, but that prediction is worthless unless a team is empowered and equipped to do something about it.
How Should We Measure the Success of Our Churn Model?
While data scientists live and breathe technical metrics like "precision" and "recall" to validate a model's accuracy, those terms don't mean much to the rest of the business. Real success should always be measured by its tangible impact on your bottom line.
The ultimate key performance indicator (KPI) is a measurable reduction in your overall churn rate. That's the north star your entire effort should be judged against. Simple as that.
Beyond that single metric, you can calculate the direct return on investment (ROI) of your retention campaigns by running simple A/B tests. Here’s a quick example:
- Your model identifies a group of 100 at-risk customers.
- You give a special offer or proactive support to 50 of them (Group A).
- You do nothing for the other 50 (Group B, your control group).
The difference in the retention rate between these two groups, minus the cost of your intervention, shows the clear financial value your predictive modeling program is delivering.
Can Small Businesses Realistically Use Predictive Churn Modelling?
Absolutely. This kind of technology is no longer just for massive enterprises with huge data science teams. The rise of user-friendly analytics platforms and no-code machine learning tools has made it accessible to businesses of all sizes.
Many modern CRM and marketing automation platforms even offer built-in predictive features that can get you started. A small business can begin with a simpler model using the data they already collect from tools like Stripe, Zendesk, or Mailchimp. The key is to start small, define churn clearly, and focus on the most impactful data you already have. The principles are the same, no matter your scale.
At SigOS, we help you move beyond just predicting churn to understanding the "why" behind it. Our platform analyzes customer feedback and behavior from all your existing tools to connect churn risk directly to specific product gaps, bugs, and feature requests. Learn how SigOS can help you build a better product and reduce churn.