Measuring Customer Lifetime Value Done Right
A practical guide to measuring customer lifetime value. Learn the formulas, strategies, and common mistakes to unlock sustainable SaaS growth.

Measuring customer lifetime value isn't just another task for your BI team; it's a vital sign for the health and long-term potential of your entire business. Think of it as the total revenue you can reasonably expect from a single customer throughout your relationship. Getting a handle on this number helps you shift from chasing short-term wins to building sustainable, long-term growth.
Honestly, mastering CLV is the key to making smarter decisions across the board.
Why Most Companies Get CLV Wrong

Everyone in SaaS loves to talk about Customer Lifetime Value (CLV), but very few actually measure it in a way that truly informs their strategy. It often gets treated like a vanity metric—a number that looks impressive on a slide deck but doesn't actually influence day-to-day decisions.
This guide is designed to cut through that noise. We're going to move past a vague appreciation for CLV and start using it as a reliable compass for your business. It’s a metric that should guide everything from how you allocate your marketing budget to which features you build next and how you approach customer retention.
The gap between knowing CLV is important and actually measuring it well is surprisingly wide.
The data backs this up. While a whopping 89% of companies see CLV as a critical part of building brand loyalty, only 42% feel confident they can measure it accurately. This disconnect often boils down to a classic problem: siloed data that makes it impossible to see the full customer journey. You can dig into more of these customer lifetime value statistics if you're curious.
Moving from Theory to Action
We're here to give you a practical framework to finally get this right. The goal is to turn CLV from an abstract concept into an actionable tool that helps you unlock real, sustainable growth.
When you start measuring customer lifetime value correctly, you can:
- Pinpoint your most profitable customer segments and figure out what makes them stick around.
- Optimize your marketing spend by pouring resources into channels that bring in high-value users.
- Prioritize product features that directly impact customer retention and satisfaction.
- Forecast future revenue with a much higher degree of confidence.
Before you can calculate anything, you need to gather the right ingredients. These are the fundamental metrics that feed into any CLV formula, whether you're starting simple or aiming for a more complex model.
Essential Metrics for CLV Calculation
Here’s a quick look at the core data points you'll need to gather before you can start measuring customer lifetime value.
| Metric | What It Measures | Why It Matters for CLV |
|---|---|---|
| Average Purchase Value (APV) | The average dollar amount a customer spends in a single transaction. | Forms the base of your revenue-per-customer calculation. |
| Purchase Frequency (PF) | How often the average customer makes a purchase in a given period. | Shows how engaged and reliant customers are on your product. |
| Customer Value (CV) | The average revenue generated per customer over a specific time frame (e.g., a year). | Combines APV and PF to give a snapshot of a customer's annual worth. |
| Customer Lifetime Span (CLS) | The average length of time a customer continues doing business with you. | This is the "lifetime" part of CLV; a longer span means more value. |
| Churn Rate | The percentage of customers who stop using your service over a given period. | The inverse of retention; it directly impacts how long you keep customers. |
Getting these numbers from your CRM, billing system, and analytics tools is the first real step. With this data in hand, you're ready to start putting the pieces together and calculate a CLV that actually means something.
Building Your CLV Data Foundation
Let's be honest: your CLV calculations are only as good as the data you feed them. Before you even think about plugging numbers into a formula, you have to play detective and piece together the story of your customer.
This isn't about complex math—at least not yet. It's about centralizing information that’s probably scattered all over your company, tucked away in different tools and departments. Your goal is to create a single, unified view of the entire customer journey.
Sourcing Your Core CLV Metrics
The metrics you need for CLV are almost certainly living in separate systems. The first real step is to map out where to find each piece of the puzzle.
Here’s where I typically start looking:
- Customer Relationship Management (CRM): Your CRM, whether it's Salesforce or HubSpot, is a treasure trove. This is where you’ll find the customer lifetime span and crucial details for segmenting your audience.
- Billing and Payment Platforms: Go straight to the source of truth for revenue. Tools like Stripe or Chargebee hold the hard numbers for Average Purchase Value (APV) and Purchase Frequency (PF).
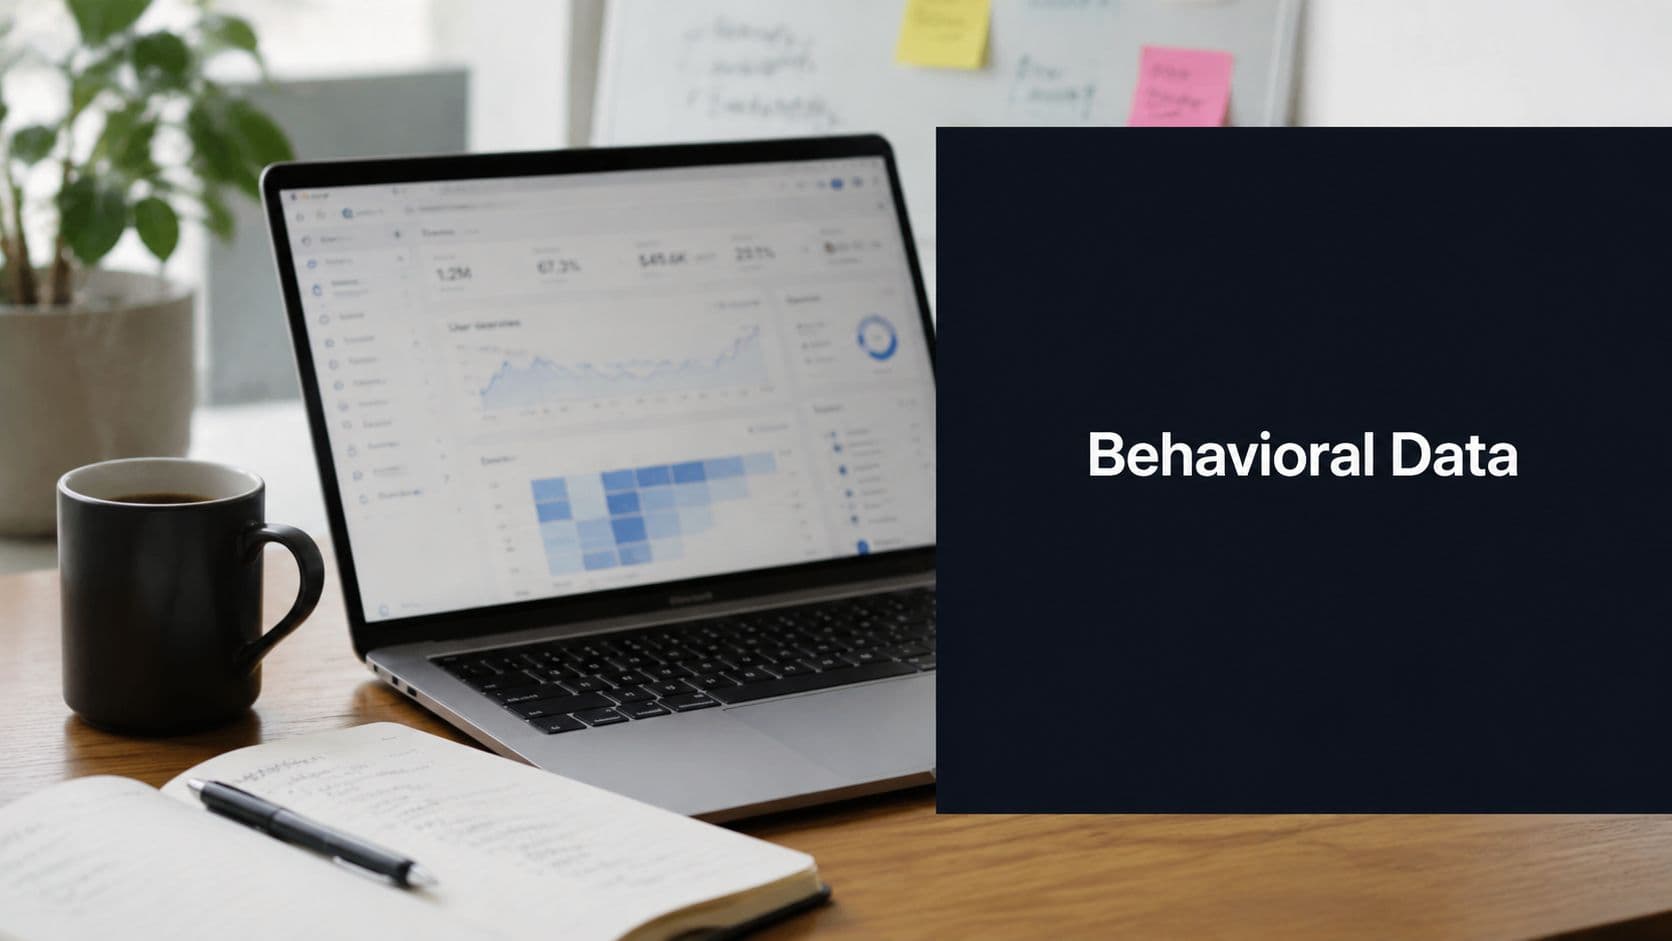
- Analytics and Product Usage Tools: Platforms like Mixpanel or Amplitude show you what customers are actually doing. This behavioral data is gold for understanding retention and calculating your churn rate.
Overcoming Common Data Roadblocks
Just finding the data isn't the finish line. You'll almost certainly run into problems with consistency and cleanliness. One of the most common headaches I see is duplicate customer records—maybe one was created by sales and another from a support ticket. That tiny issue can completely throw off your averages.
This is where a clear data governance strategy comes in. You need to establish ground rules for how data is entered, managed, and merged across all your systems. For larger teams, a solid framework for making sense of complex datasets is non-negotiable. We dive deeper into this in our guide on enterprise data analytics.
Another classic roadblock is inconsistent tracking. If marketing defines a "lead" one way and sales tracks a "contact" another way, you’ll never get a clear picture of the full journey. You absolutely have to standardize these definitions across the board.
By taking the time to clean and unify your data first, you're building a foundation that makes your CLV calculations reliable. This upfront work is what elevates CLV from a vanity metric to a genuinely powerful tool for your business.
Choosing the Right CLV Calculation Method
Once your data is clean and in one place, you've got a choice to make: how are you actually going to calculate CLV? The truth is, you can get lost in a sea of complex formulas, but for most product teams, it really boils down to two main approaches. You can either look at what's already happened or try to predict what's coming next.
The path you take depends entirely on your business. How old is your company? What kind of data are you sitting on? And most importantly, what do you plan to do with this number once you have it?
Let's break down the two most practical models you can start with.
This visual gives you a great high-level view of how the different pieces of the CLV puzzle fit together.
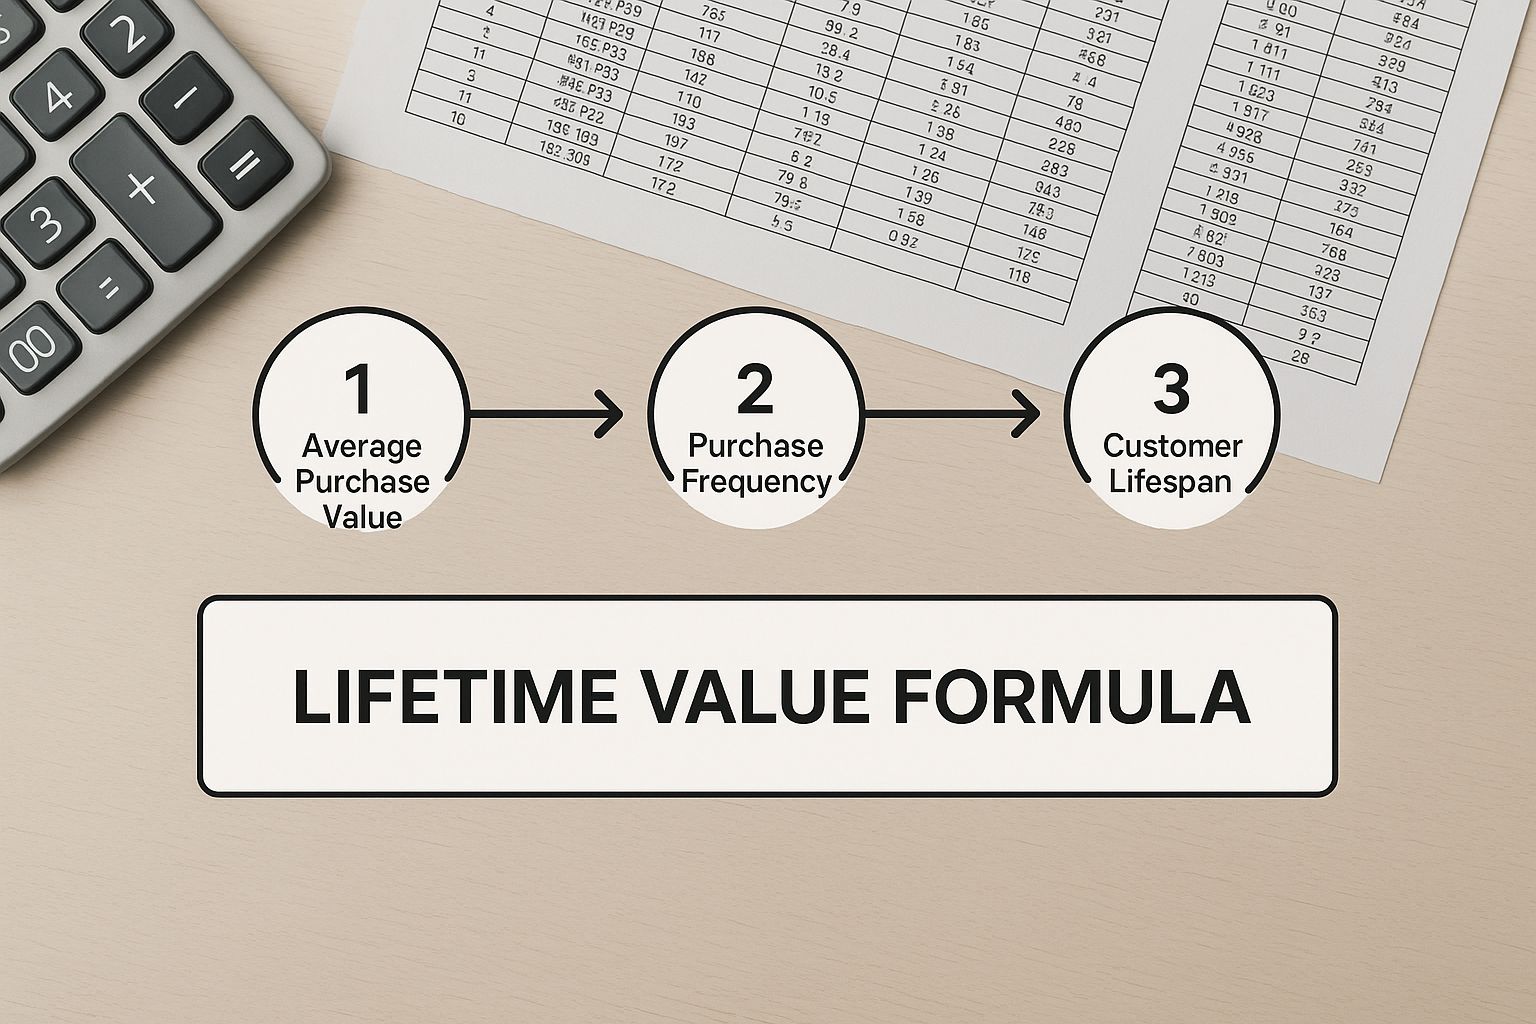
Seeing the formula laid out like this really helps demystify the whole process. It shows you exactly how metrics like purchase value and customer lifespan come together to create that final CLV figure.
The Simplicity of Historical CLV
If you're just dipping your toes into CLV, the Historical model is the perfect place to start. It’s exactly what it sounds like—it uses past data to give you a concrete number for the total profit a customer has generated for you up to this point. Think of it as a historical record of that customer's value.
The formula couldn't be more direct:
Historical CLV = (Transaction 1 + Transaction 2 + ... + Last Transaction) x Average Gross Margin
This is a fantastic starting point for newer businesses or teams that don't have a ton of data science resources. It's easy to calculate using information you probably already have in your payment processor or CRM, and it gives you a solid, factual baseline.
The major downside? It’s completely rearview-mirror-focused. It tells you nothing about a customer’s future potential or how their behavior might change. That makes it less useful when you're trying to make proactive decisions about the future.
The Power of Predictive CLV
Now, if you want to get more strategic, Predictive CLV is where the real magic happens. This approach uses historical data and behavioral patterns to forecast how much revenue a customer is likely to generate over their entire lifetime with your product.
It's definitely more complex, factoring in variables like your churn rate and how long you expect a customer to stick around. A common (and simplified) predictive formula looks something like this:
Predictive CLV = (Average Monthly Revenue per Customer x Gross Margin) / Monthly Churn Rate
This model is a powerhouse for strategic planning. It lets you spot high-potential customers from the get-go, tells you where to best spend your marketing budget for long-term growth, and helps you prioritize features that keep people from churning. If you’re ready for a deeper dive, check out our full guide on how to calculate customer lifetime value for more advanced takes.
The catch with predictive models is that they are built on assumptions. If your churn rate estimate is off, your entire CLV calculation will be skewed. It's crucial to constantly refine your inputs as you get more data.
The context of your business model also makes a world of difference. A coffee shop customer who spends 4 twice a week for five years could have a CLV of around ****2,000. Contrast that with a car dealership where a customer buying a 30,000 car every five years might have a CLV closer to ****90,000. The model has to fit the reality of your customer relationships.
Historical vs Predictive CLV Models
To help you decide, here's a side-by-side look at the two main CLV calculation methods. This should make it clearer which one fits your immediate business needs.
| Method | Best For | Pros | Cons |
|---|---|---|---|
| Historical CLV | New businesses, teams new to CLV, or for simple financial reporting. | • Easy to calculate • Based on actual, concrete data • Provides a reliable baseline | • Backward-looking only • Ignores future potential • Doesn't differentiate between new and old customers |
| Predictive CLV | Established businesses, SaaS, subscription models, strategic planning. | • Forward-looking and strategic • Helps prioritize marketing spend • Identifies high-value customer segments early | • More complex to calculate • Relies on assumptions • Requires more data and regular refinement |
Ultimately, many seasoned teams use both. Historical CLV gives you the hard facts of what's happened, while Predictive CLV provides the forecast you need to grow smarter.
Putting CLV to Work for Your Business
Figuring out your customer lifetime value is a huge step, but it’s really just the beginning. A CLV number stuck in a spreadsheet doesn't actually do anything for your bottom line. The real magic happens when you start using that number to make smarter, data-informed decisions across your entire company.
Think of CLV as less of a static health metric and more of a strategic compass. It points everyone—from marketing to product to customer success—toward the actions that will create the most sustainable value. It helps you stop guessing what will work and start building a unified plan for growth.
Guide Your Marketing and Acquisition Spend
For any marketing team, CLV is the ultimate gut-check. It finally provides a clear answer to the question, "Is our ad spend really profitable?" By knowing the lifetime value of customers from different channels, you can stop obsessing over initial acquisition costs alone.
Let’s look at a classic scenario. You're running two campaigns:
- Campaign A: Brings in new customers for $150 a pop.
- Campaign B: Costs $300 to acquire each customer.
At first glance, Campaign A seems like a no-brainer. Cheaper is better, right? But once you layer in CLV, the picture can flip entirely.
What if customers from Campaign B have an average CLV of 1800, while Campaign A customers top out at ****600? Suddenly, Campaign B is delivering a 6:1 return on your investment, making it a far more lucrative bet for long-term growth. This is the kind of insight that lets you confidently double down on the channels that attract your best users.
Inform Your Product Roadmap and Prioritization
Product teams are in a constant state of prioritization. CLV data can cut through the noise and tie development work directly to revenue and retention. By segmenting your users by their lifetime value, you'll start to see behavioral patterns you never noticed before.
For example, you might dig into the data and discover that your highest-CLV customers are 50% more likely to set up a specific integration within their first month. That’s not just a fun fact; it’s a roadmap directive. This single piece of information can shape your strategy:
- Onboarding: You could redesign your onboarding to nudge new users toward that "sticky" feature.
- Feature Development: That integration should probably jump to the top of your list for future improvements.
- Expansion Strategy: It might be time to explore building similar integrations for that same high-value customer profile.
Transform Customer Success and Retention Efforts
Your customer success team is on the front lines, keeping customers happy and engaged. CLV helps them focus their energy where it will make the biggest difference. When you identify the key actions that correlate with a high CLV, your CS team can be proactive instead of reactive.
Imagine you learn that customers who complete a specific training module in their first week have a 2x higher CLV. Your team can immediately build a targeted campaign to encourage every new user to do just that.
This proactive approach is everything. When your team can spot the early warning signs of a customer going quiet, they can step in before it's too late. If you want to dive deeper into these kinds of strategies, check out our guide on how to reduce customer churn.
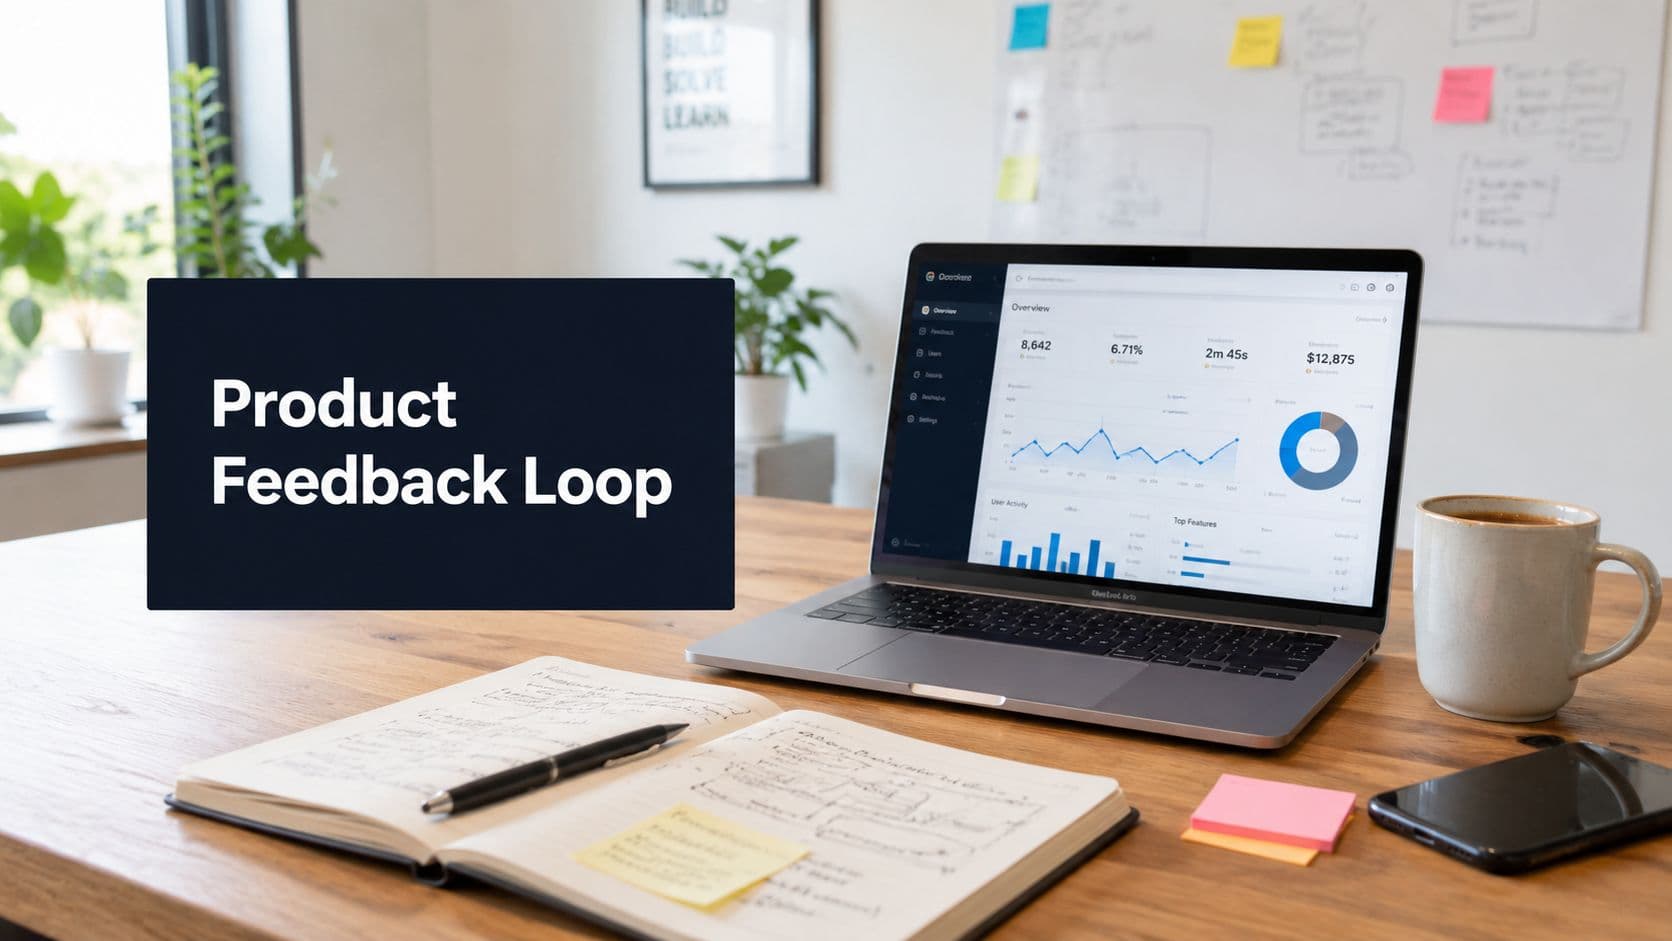
Ultimately, when CLV is woven into the fabric of your organization, you create a powerful feedback loop. Marketing brings in better customers, the product team builds features that make them more valuable, and the success team makes sure they stick around for the long haul.
Common CLV Measurement Mistakes to Avoid

Measuring customer lifetime value can feel like you're navigating a minefield. A few seemingly small errors can completely throw off your numbers, leading you to make big decisions based on bad data. The whole point is to build a reliable compass for your business, not a broken one.
So, let's talk about the classic mistakes that trip up even experienced teams. Avoiding these common pitfalls is the first step toward getting a CLV figure you can actually trust. The good news? They're all preventable with a bit of foresight.
Ignoring Customer Acquisition Costs
This is probably the biggest and most common mistake I see. Teams get so focused on the CLV number itself that they calculate it in a vacuum, completely forgetting what it cost to get that customer in the door.
A 1,000 CLV sounds great, right? But what if you find out you spent ****1,200 in marketing and sales to acquire that customer? Suddenly, that impressive figure is actually a net loss.
Your CLV only becomes a powerful, actionable metric when you put it right next to your Customer Acquisition Cost (CAC). The CLV:CAC ratio is your true north for sustainable growth. For most SaaS companies, a healthy benchmark is a ratio of 3:1 or higher. That means for every dollar you spend on acquisition, you’re getting at least three dollars back over the customer's lifetime.
Treating All Customers as an Average
Another critical misstep is boiling everything down to a single, company-wide CLV average. This approach completely hides the incredible variance in your customer base. You're lumping your power users in with the folks who barely log in, creating a misleading middle ground that represents no one.
The real magic happens when you start segmenting. Instead of one number, you should be looking at CLV for different customer groups.
- By Acquisition Channel: Do customers from paid search have a higher CLV than those from your content marketing? This is gold. It tells you exactly where to double down on your marketing spend.
- By Initial Product Usage: What’s the CLV of users who adopt a key feature in their first week versus those who don’t? The answer can directly shape and improve your onboarding flow.
- By Subscription Plan: Are your enterprise customers genuinely more valuable over their lifetime, or does their churn rate cancel out the higher price? You won't know until you segment.
Using Inconsistent Timeframes
This one is a bit more subtle but just as dangerous. Using inconsistent time periods for your analysis can quietly wreck your calculations. For instance, if you calculate churn monthly but measure average revenue annually, your final CLV number will be skewed.
To get an accurate result, every single component of your CLV formula needs to be on the same clock—whether that’s monthly, quarterly, or annually. Consistency is non-negotiable.
Pick a timeframe that makes sense for your business model and stick to it religiously across all the related metrics. This simple discipline prevents you from making apples-to-oranges comparisons that can lead your strategy astray.
Got Questions About CLV? We've Got Answers
Even after you've got the formulas down, some practical questions always pop up when you start calculating customer lifetime value. It's one thing to know the math, and another to apply it effectively in the real world.
Let's walk through some of the most common sticking points I see teams run into. Getting these details right is what turns CLV from a vanity metric into a genuinely useful tool.
How Often Should I Actually Be Measuring CLV?
For most SaaS businesses, I've found that running the numbers on a quarterly basis hits the sweet spot. It's frequent enough to catch important trends and see if your strategic shifts are paying off, but not so often that you're just reacting to noise in the data. This cadence usually lines up nicely with your broader business planning and reporting cycles, too.
Now, if you're in a full-on growth sprint or A/B testing a bunch of new acquisition channels, checking in monthly can give you the faster feedback loop you need. The most important thing, though, is consistency. Whatever rhythm you choose, stick with it. That’s the only way you’ll be able to track your progress accurately over time.
What's a Good CLV to CAC Ratio to Aim For?
This is a big one. The go-to benchmark for a healthy SaaS business is a CLV to Customer Acquisition Cost (CAC) ratio of 3:1. In simple terms, for every dollar you put into getting a new customer, you should be getting three dollars back over their lifetime. A 3:1 ratio is a strong signal that you have a sustainable, profitable business model.
If you're at 1:1, you're basically breaking even on the acquisition itself, which means you're losing money once you account for all your other operational costs. On the flip side, a ratio of 4:1 or higher is fantastic—it means your growth engine is incredibly efficient and you likely have room to get more aggressive with your acquisition spend.
Keep a close eye on this ratio; it's one of the best indicators of the long-term health of your entire customer acquisition strategy.
Is It Even Possible to Measure CLV for a New Business?
Absolutely, you just have to adjust your approach. When you're just starting out, you won't have years of historical data to pull from. That’s okay. You'll need to rely on predictive models and some well-educated assumptions instead of hard data.
Here’s a practical way to get started:
- Look at industry benchmarks. See what typical churn rates and average customer spending look like for companies similar to yours. It's not perfect, but it's a solid starting point.
- Study your early adopters. The behavior of your first few customers can give you initial clues to build your first hypotheses around.
- Update constantly. Start with these assumptions, but commit to revisiting and refining them every single month as your own real-world data starts rolling in.
An estimated CLV is always better than no CLV. It gives you an early North Star to guide your initial marketing and product decisions, making sure you’re focused on long-term value right from day one.
By transforming qualitative feedback into actionable, revenue-driving insights, SigOS empowers product teams to reduce churn, accelerate expansion, and build features customers actually use. Learn how SigOS can help you prioritize your roadmap with confidence.
Ready to find your hidden revenue leaks?
Start analyzing your customer feedback and discover insights that drive revenue.
Start Free Trial →