How to Calculate Customer Lifetime Value Accurately
Learn how to calculate customer lifetime value (CLV) with our guide. We cover the formulas, data, and strategies to turn CLV into a powerful growth driver.

Figuring out your Customer Lifetime Value (CLV) is simpler than it sounds. At its core, you just multiply the average purchase value by the average purchase frequency, and then multiply that total by the average customer lifespan. This simple math gives you a powerful number: the total revenue you can expect from a single customer over time. Getting a handle on this is a game-changer for sustainable growth.
Why CLV Is More Than Just a Metric
Before we jump into the different formulas, let's get one thing straight. CLV isn't just another number to clutter up your dashboard; it's a strategic compass. I've personally seen companies completely overhaul their marketing budgets after just one solid CLV analysis. They stopped chasing cheap, one-off sales and started investing in relationships that pay dividends for years.
When you truly understand CLV, you start making smarter decisions across the board. It becomes a north star, especially for high-growth companies, giving them the confidence to make long-term investments that build a more resilient and profitable business.
Shifting from Acquisition to Retention
So many businesses get stuck in the customer acquisition cost (CAC) trap. Bringing in new customers is obviously important, but the real money is made in keeping them around. The data doesn't lie: boosting customer retention by a mere 5% can increase profits by a staggering 25% to 95%. CLV is the metric that makes this truth impossible to ignore.
Once you know what a customer is worth over their lifetime, you can confidently decide how much to spend to keep them happy. Suddenly, customer support doesn't look like a cost center anymore—it looks like a revenue driver.
A Guide for Strategic Decisions
A clear picture of your CLV brings focus to several critical parts of your business. It helps you pinpoint your most valuable customer segments, which means you can tailor marketing campaigns and even product development directly to their needs.
Here’s a quick look at how CLV can steer your strategy:
- Marketing Spend: It sets a realistic cap on your acquisition costs. If you know a customer is worth 1,000 over their lifetime, spending ****300 to acquire them is a no-brainer.
- Product Development: By looking at the CLV of users who love certain features, your product teams can prioritize updates that actually create long-term value. For a platform like SigOS, that might mean doubling down on features that lead to expansion revenue or reduce churn.
- Customer Segmentation: You can finally group your customers into meaningful tiers—think VIPs, loyal regulars, and at-risk accounts. This lets you design targeted retention campaigns for each group, squeezing the most value out of every relationship.
- Sales Prioritization: Your sales team can stop chasing every lead and start focusing on prospects that fit the profile of your existing high-CLV customers. That’s just smart selling.
In the end, calculating customer lifetime value is about more than just math. It's about taking the pulse of your business's health. It turns fuzzy ideas like "customer loyalty" into a concrete number that can guide your company toward real, long-term success.
Getting the Right Data for Your CLV Calculation
An accurate CLV is only as good as the data behind it. Before you can plug numbers into any formula, you need to feel confident that you’re pulling clean, relevant, and consistent information. Let's walk through how to source those essential inputs without getting lost in a sea of spreadsheets.
Your goal here is to pinpoint exactly what you need: transaction histories, customer behaviors, and retention metrics. The good news? Most of this data is probably already sitting in tools you use every day. Your job is to extract it, clean it up, and get it ready for analysis.
Locating Your Essential Data Inputs
For most businesses, customer data is scattered across a few key platforms. Your first task is to simply identify these sources and understand what each one holds. Don't worry about consolidating everything just yet; just map out where the information lives.
Here are the most common places to find your CLV data points:
- Customer Relationship Management (CRM) System: This is usually your main hub for customer lifespan and segmentation data. It tracks when a customer first came on board and their last interaction date, which is crucial for figuring out churn.
- E-commerce Platform or Payment Processor: Tools like Shopify or Stripe are goldmines for transactional data. This is where you’ll find your Average Purchase Value (APV) and Purchase Frequency.
- Analytics and Product Intelligence Tools: Platforms like SigOS can give you much deeper behavioral insights, like feature adoption rates or how often a customer submits a support ticket. This kind of data is invaluable for more advanced, predictive CLV models.
Think of it like getting ingredients ready for a recipe. You need to know which cupboard has the flour and which drawer has the spices before you can start cooking. It's the same idea here—map your data sources first.
Key Metrics You Need to Collect
Once you know where to look, you need to know what to grab. Getting a solid customer lifetime value calculation requires a few specific metrics.
Here’s a quick rundown of the most critical data points, where to find them, and why they’re so important for your formula.
Essential Data Inputs for CLV Calculation
| Data Point | Common Source | Importance to CLV Formula |
|---|---|---|
| Average Purchase Value (APV) | E-commerce Platform | This metric determines the value of each transaction, forming the base of your CLV calculation. |
| Purchase Frequency | Payment Processor | Measures how often a customer buys, directly impacting their total value over time. |
| Average Customer Lifespan | CRM System | Defines the duration of the customer relationship, setting the time horizon for their value. |
| Churn Rate | Subscription Management | The inverse of customer lifespan; understanding churn is critical for predictive modeling. |
Collecting these raw numbers is the foundational step. Each metric tells a piece of the customer's story, and when you put them together, they build a complete picture of their long-term worth.
Avoiding Common Data Traps
I’ve seen so many teams get excited about CLV, only to have their efforts derailed by messy data. It’s a common and frustrating problem. Frankly, an inaccurate calculation is often worse than no calculation at all because it can lead you to make some really poor strategic decisions.
To avoid this, invest time in data hygiene before you start calculating. A few proactive steps can save you countless hours of headaches down the road. Here are some actionable tips I always recommend:
- Standardize Customer IDs: Make sure you have a single, unique identifier for each customer that is used across all your platforms.
- Define Your Time Period: Decide whether you'll analyze data monthly, quarterly, or annually, and then stick to it. Mixing timeframes will only create confusing and unreliable results.
- Clean Your Transactional Data: Go through and remove test orders, refunded purchases, and any other anomalies that don’t reflect genuine customer spending.
Getting your data right from the start is non-negotiable for anyone serious about understanding how to calculate customer lifetime value. It ensures your final number is a reliable compass for your business, not just a misleading distraction.
Diving Into the Core CLV Formulas
Alright, with your data cleaned up and ready to go, it's time for the fun part. You don't need to be a data scientist to calculate customer lifetime value, especially when you're just starting. The basic formulas are actually pretty straightforward, and they'll give you a powerful baseline for making much smarter business decisions right away.
We'll kick things off with the most common and accessible method: the historical CLV model. This approach looks at what your past customers have done to create a picture of what a typical customer is worth. It's the perfect place to start because it uses information you almost certainly have sitting in your CRM or e-commerce platform already.
This visual breaks down the three core pieces that feed into the calculation.
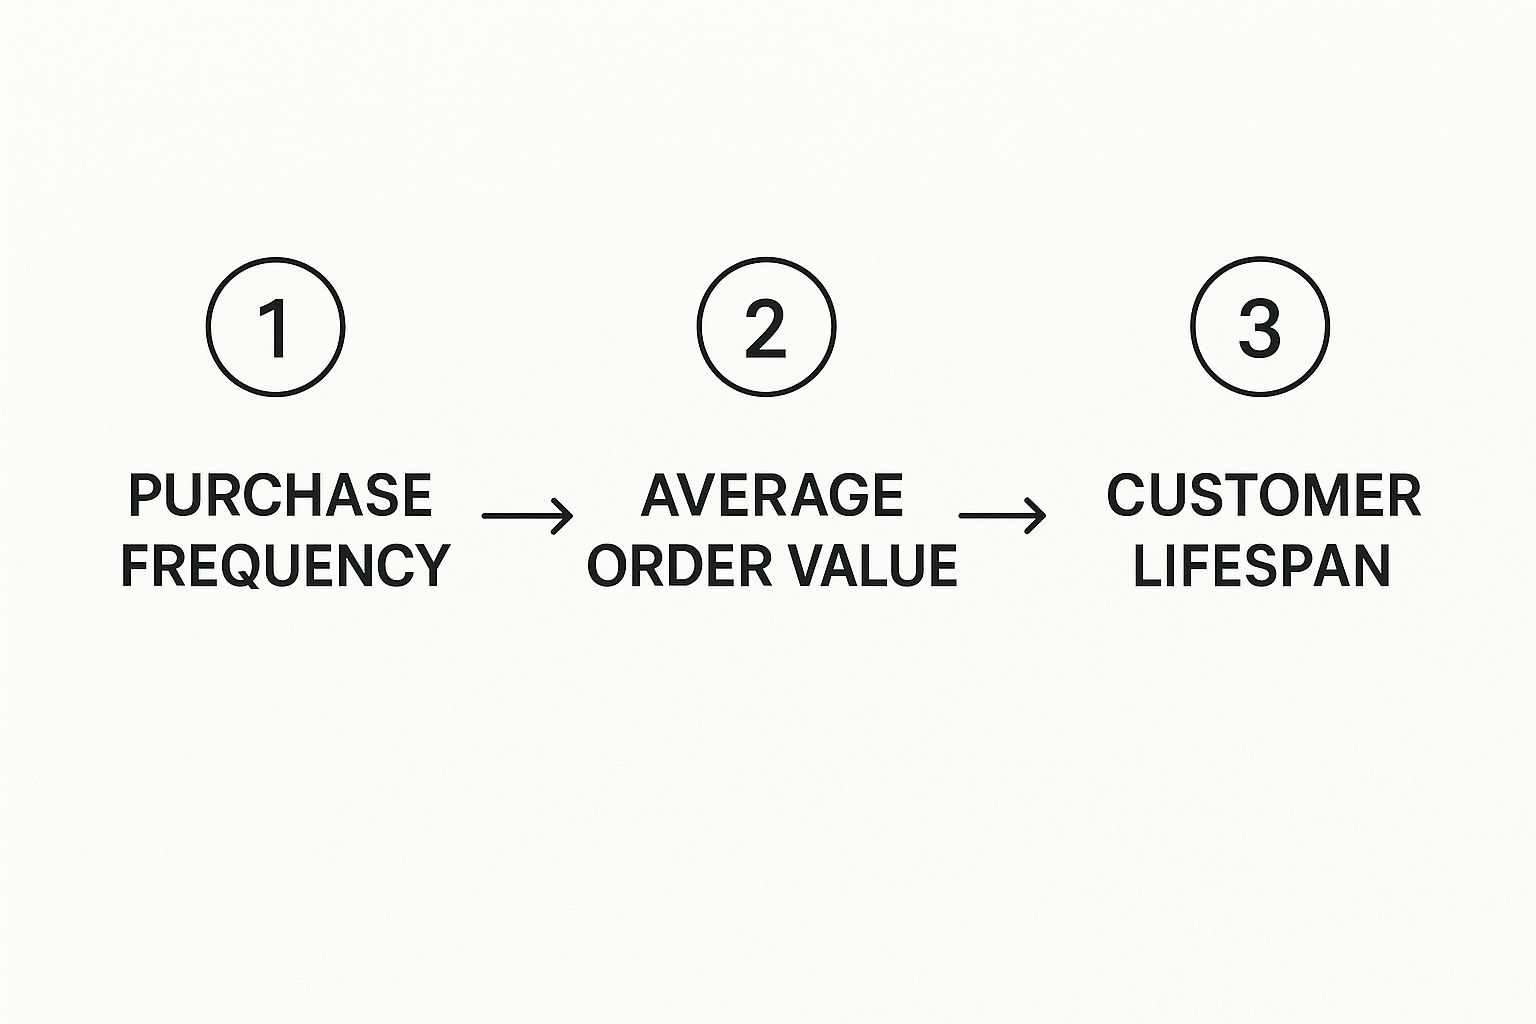
As you can see, the three key metrics—how often someone buys, how much they spend, and how long they stick around—all build on each other to reveal the full picture of a customer's total worth.
Your First CLV Calculation: The Simple Model
The most direct way to get a handle on historical CLV is by multiplying three key variables. A widely used, no-fuss formula brings together the average purchase value, how many times a customer buys per year, and how many years they stay with you. This gives you a really practical estimate of the revenue you can expect from a single customer over their time with your brand.
For example, if a customer typically spends 50 per order, makes 6 purchases a year, and remains a customer for 3 years, their CLV is simply ****50 × 6 × 3 = $900. If you want to see more examples like this in action, you can dive deeper into how to measure customer lifetime value.
Let's ground this in a real-world scenario.
Example: A Direct-to-Consumer Coffee Subscription
Imagine you run "BeanBox," a monthly coffee subscription. To figure out your simple CLV, you just need to pull three numbers:
- Average Purchase Value (APV): Looking at last year's sales, you see the average order is $40.
- Purchase Frequency (F): Your subscribers get a box every month, so that’s a frequency of 12 times per year.
- Average Customer Lifespan (ACL): After digging into your CRM, you find the average subscriber sticks with BeanBox for 2.5 years.
Now, you just plug those numbers into the formula:
CLV = $40 (APV) × 12 (F) × 2.5 (ACL)
The result? 1,200. This tells you that, on average, a BeanBox subscriber will generate ****1,200 in revenue over their entire relationship with your company.
Leveling Up with Profit Margin
While that first formula is a great start, it has one major blind spot: it’s based on revenue, not profit. A 1,200 CLV looks fantastic on paper, but if it costs you ****1,100 to serve that customer, the story changes completely. A far more accurate and useful calculation factors in your actual profit margin.
To do this, you first need to calculate your Customer Value (CV), which is just the first part of our previous formula:
Customer Value = Average Purchase Value × Purchase Frequency
Using our BeanBox example again:
Customer Value = $40 × 12 = $480 per year
Next, you'll multiply this by your gross margin percentage. Let's say the cost of your coffee, packaging, and shipping adds up to 60% of the revenue. That leaves you with a 40% gross margin.
Now we can calculate a profit-driven CLV:
Profit-Driven CLV = Customer Value × Average Customer Lifespan × Gross Margin
Profit-Driven CLV = $480 × 2.5 × 0.40 = $480
All of a sudden, that customer's lifetime value is 480 in actual profit, not ****1,200 in revenue. This is the number you should be using to make critical decisions about ad spend and retention efforts.
Uncovering Trends with Cohort Analysis
Calculating a single, universal CLV for your entire customer base is useful, but it masks some really important details. The truth is, not all customers are created equal. This is where cohort analysis becomes so valuable.
A cohort is just a group of customers who share a common characteristic. When it comes to CLV, the most common approach is to group them by when they were acquired—for instance, all customers who first signed up in January 2023.
When you start calculating CLV for different cohorts, you can uncover some powerful trends:
- Marketing Campaign Effectiveness: Did the group you acquired during that big summer sale have a higher or lower CLV than customers from other months?
- Product and Onboarding Impact: Did customers who signed up after you launched that new onboarding flow stick around longer and spend more?
- Seasonal Differences: Do customers you acquire during the holidays behave differently than those who join in the spring?
This approach transforms CLV from a static, company-wide number into a dynamic tool for analysis. It helps you see which acquisition channels are actually bringing in your most valuable customers and lets you measure the long-term impact of your product and marketing changes. For a platform like SigOS, this could mean tracking the CLV of cohorts who adopted a specific new AI feature to prove its direct impact on customer retention.
Using Predictive CLV Models to See the Future

While looking at historical CLV is useful—it gives you a solid rearview-mirror perspective on customer worth—what if you could look through the windshield and see what’s coming? That’s exactly what predictive CLV models do. They go beyond past averages to forecast future value, often with surprising accuracy.
This shift gives you a massive strategic advantage. Instead of waiting for trends to play out over several years, this forward-looking approach helps you spot your future VIPs almost as soon as they sign up. It’s all about moving from reactive analysis to making proactive decisions that secure long-term revenue.
How Predictive CLV Works Its Magic
Predictive CLV models are far more dynamic than their historical cousins. They rely on statistical methods and machine learning to analyze a huge range of customer behaviors and attributes. The goal isn't just to see what a customer has done, but to predict what they are most likely to do next.
A critical piece of this puzzle is the model's ability to calculate churn probability for each individual customer. It doesn't just assume everyone will stick around for an "average" lifespan. Instead, it looks at factors like recent purchase behavior, how they're engaging with your product, and how often they contact support to estimate the real-world likelihood that a specific customer will leave.
This gives you a much more nuanced picture of value. For instance, two customers who have spent the same amount might have wildly different predicted CLVs if one is showing clear signs of disengagement while the other is using your product more and more.
The Data That Fuels the Forecast
A predictive model is only as good as the data you feed it. While it still needs the same foundational transactional data as historical models, it becomes much more powerful when you layer on richer behavioral and demographic information.
To get a reliable forecast, you'll need to pull together several types of data:
- Transactional History: This goes beyond just purchase value. You'll want to include the recency, frequency, and monetary value (RFM) of every transaction.
- Product Usage Metrics: For a SaaS company like SigOS, this is gold. Think login frequency, feature adoption rates, and average session duration.
- Customer Support Interactions: The number and nature of support tickets can signal anything from deep engagement to growing frustration.
- Demographic and Firmographic Data: Details like company size, industry, or customer location can help you spot patterns across different customer segments.
Ultimately, the goal is to build a complete customer profile that tells you much more than just what they’ve spent.
Moving Beyond Simple Averages
One of the biggest wins with predictive analytics is that it lets you account for individual customer lifespans. Modern data science can estimate future value far more accurately than historical averages ever could. A key part of this involves folding in churn prediction, which refines the expected lifespan used in traditional CLV math.
For example, imagine a customer brings in £500 in revenue annually and you project they'll stick around for 10 years, giving you a £5,000 total. After subtracting acquisition costs (£50) and a decade of servicing costs (£500), the net CLV comes out to £4,450. You can see a more detailed breakdown of how this advanced calculation works.
This individualized approach is a true game-changer. It means you can tailor your marketing and retention efforts with incredible precision. You can confidently invest more to keep a customer with a high predicted CLV and low churn risk, while using more automated, lower-cost methods for customers who show less long-term potential. It’s the ultimate way to put your resources where they’ll make the biggest impact.
Putting Your CLV Insights into Action
https://www.youtube.com/embed/4yE4Aq58Idg
Figuring out your Customer Lifetime Value is a huge step, but the number itself doesn't drive growth. Its real power comes from what you do with it.
Once you know what a customer is worth, you can transform your approach to everything from marketing and sales to product development. The goal is to make CLV an active, daily driver of your strategy, not just a passive metric you report on every quarter.
This is where the rubber meets the road—and where many businesses get stuck. They’ve done the math but aren't sure how to translate that number into tangible actions that actually boost revenue and keep customers around.
Let's break down how to put these powerful insights to work.
Segmenting Customers for Targeted Action
One of the most immediate ways to use CLV is through customer segmentation. A single, company-wide CLV average is useful for a quick health check, but it hides the massive variation within your customer base. The reality is, you have different tiers of customers, and each one deserves a unique strategy.
By segmenting based on CLV, you can create practical tiers that tell your team exactly where to focus their energy:
- VIPs (High-CLV): These are your champions. They spend the most, stick around the longest, and are often your best source of referrals. Your entire strategy here is about retention and advocacy. Think white-glove service, early access to new features, and exclusive perks that make them feel valued.
- Loyal Regulars (Mid-CLV): This group is the stable core of your business. They're consistent, but they have the potential to become VIPs. Your focus should be on increasing their purchase frequency or introducing them to higher-tier products through smart, targeted cross-selling and upselling campaigns.
- At-Risk Accounts (Low-CLV): These customers either spend very little, churn quickly, or are showing clear signs of disengagement. The goal here is efficient nurturing. Use automated email sequences or digital success motions to re-engage them without burning out your team.
This approach lets you allocate your resources—time, money, and people—far more effectively. You stop using a one-size-fits-all strategy and start delivering personalized experiences that actually match each customer's value.
Balancing Acquisition Costs with Lifetime Value
Here's where CLV really proves its worth: mastering your customer acquisition economics. This is all about the CLV:CAC ratio. It’s a simple but incredibly powerful formula that tells you if your marketing spend is actually profitable in the long run.
The CLV:CAC Ratio: A healthy benchmark for a growing SaaS business is generally 3:1. This means for every 1 you spend to acquire a customer, you should expect to get ****3 back in lifetime value. A ratio of 1:1 means you're just breaking even, and anything below that means you're actively losing money on each new customer you bring in.
This ratio should become the north star for your marketing budget. If a specific ad campaign is bringing in customers with a CLV:CAC ratio of 5:1, you have a green light to scale that channel aggressively. On the other hand, if another channel is barely hitting 1:1, it's a clear signal to re-evaluate your strategy or optimize your spend there.
Analyzing past sales data to calculate a Historical CLV is a foundational starting point. When you juxtapose that CLV with your Customer Acquisition Cost (CAC), you get a clear picture of profitability. A sustainable business model absolutely requires the average CLV to exceed CAC. You can discover more insights about CLV and CAC on Stripe to dive deeper into this relationship.
Informing Product and Marketing Strategy
Your CLV data is a goldmine of insights that can directly inform what you build next and how you market it. By analyzing the CLV of different customer cohorts, you can start connecting specific actions and behaviors to long-term value.
For example, imagine a product intelligence platform like SigOS analyzes the CLV of users who adopt a new AI-powered analytics feature within their first 30 days. They discover this cohort has a 25% higher CLV than those who don't. That's not just an interesting stat; it's a clear roadmap for action:
- For Marketing: The marketing team should immediately start highlighting this feature in their campaigns to attract more of these high-potential customers.
- For Onboarding: The customer success team should make driving adoption of this specific feature a top priority during the onboarding process.
- For Product: The product team now has concrete evidence that this feature is a major driver of retention and value, justifying further investment in its development.
This approach shifts your decision-making from subjective opinion to objective data. You stop guessing which features are valuable and start knowing which ones directly contribute to your bottom line. Suddenly, CLV becomes the ultimate feedback loop, connecting the dots between what you build, who you attract, and how much they're truly worth to your business.
Common Questions About CLV

As you start weaving Customer Lifetime Value into your strategy, you’re bound to run into a few questions. These are the same practical hurdles I've seen countless teams face when they move CLV from a theoretical concept to a real-world tool.
Let's cut through the noise and tackle some of the most common questions head-on. Getting these right will make the entire process smoother and a whole lot more effective.
What Is a Good CLV to CAC Ratio?
This is the big one. Once you have your CLV and your Customer Acquisition Cost (CAC), how do you know if you're in good shape?
A healthy benchmark for the CLV to CAC ratio is 3:1. This is the sweet spot. It means for every dollar you spend bringing a new customer through the door, you’re getting three dollars back over their lifetime. That signals a sustainable, scalable business.
If you’re sitting at 1:1, you’re just breaking even on your marketing spend, leaving no margin for profit or other operating costs. But interestingly, a ratio that’s too high—say, 5:1 or more—can also be a red flag. It often means you're not investing enough in growth and are probably leaving a ton of potential customers on the table.
How Often Should I Calculate CLV?
There's no single right answer here; it really comes down to the rhythm of your business.
- For fast-paced businesses like e-commerce or monthly SaaS platforms, you should be looking at CLV at least quarterly, if not monthly. This frequency lets you catch trends early and see the immediate impact of your strategic shifts.
- If you have a longer sales cycle or your customers purchase less frequently, a semi-annual or even annual calculation can work just fine.
The key is consistency. Make it a rule to recalculate CLV after any major change to your pricing, marketing strategy, or product. This keeps the metric sharp and relevant for decision-making.
Don't treat CLV as a "set it and forget it" number. Your business evolves, and so does your customer value. Regular recalculation keeps it from becoming a stale, misleading metric.
What Are the Biggest Mistakes When Calculating CLV?
Getting the formula right is just the start. I’ve seen a few common missteps completely derail the usefulness of a CLV calculation.
The single biggest mistake is using revenue instead of gross margin. This inflates your CLV and gives you a false sense of security, which can lead to disastrous overspending on customer acquisition. You're budgeting with money you don't actually get to keep.
Another classic error is calculating one "blended" CLV for your entire customer base. This average figure hides the massive value differences between your best customers and everyone else. You have to segment your customers to get a true picture.
Finally, don't get stuck only looking backward. Historical data is useful, but it’s just that—history. By ignoring predictive models, you miss the chance to spot your future high-value customers from day one and start treating them like the VIPs they are.
Can I Calculate CLV Without Much Historical Data?
Absolutely. This is a common situation for startups and new ventures, and it just means you need a different approach.
Instead of relying on past purchase data, you'll build a predictive model using early customer behaviors. Zero in on the metrics you can track from the get-go, like the average order value of their first purchase, how they engage with your product initially, or which acquisition channel brought them in. You can also use proxy data from similar companies in your industry to set a starting benchmark. It won’t be perfect at first, but you can continuously sharpen the model as you collect more of your own data.
Ready to turn customer feedback into actionable, revenue-driving insights? SigOS uses AI to analyze customer behavior and pinpoint the exact issues and feature requests that impact your bottom line. Prioritize development with confidence and build a product your customers truly value. Start quantifying your customer feedback today.
Keep Reading
More insights from our blog

Ready to find your hidden revenue leaks?
Start analyzing your customer feedback and discover insights that drive revenue.
Start Free Trial →