What Is Qualitative Data Analysis A Practical Guide for Product Teams
What is qualitative data analysis? Learn how to turn customer feedback into product breakthroughs with practical methods, tools, and real-world examples.

Qualitative data analysis is all about making sense of non-numerical information. Think of things like interview transcripts, open-ended survey answers, or raw customer feedback. The goal is to dig into this mountain of words to understand concepts, opinions, and experiences. It’s how you find the why behind the numbers by spotting themes, patterns, and stories hidden in plain sight.
You’re essentially playing detective, but for user sentiment.
Understanding Qualitative Data Analysis Beyond the Jargon

While quantitative data gives you the hard numbers—like which pages people visit or how many users click a button—qualitative data provides the rich, human context. It’s the difference between knowing 70% of users abandon their shopping cart and understanding exactly why they’re leaving.
Imagine you're a product manager. You could spend weeks buried in clickstream data, but just a few well-run customer interviews might uncover the real issue in a matter of hours. Maybe it’s a confusing checkout button or surprise shipping fees that are derailing the sale. This process of listening, reading, and interpreting is the heart of qualitative data analysis.
Qualitative vs Quantitative Data at a Glance
To make this crystal clear, here’s a quick comparison of the two data types. They aren't in competition; they work best together, each telling a different part of the story.
| Aspect | Qualitative Data | Quantitative Data |
|---|---|---|
| What It Is | Non-numerical: text, audio, video | Numerical: counts, measurements, ratings |
| Purpose | To explore ideas, themes, and motivations | To measure, test, and confirm hypotheses |
| Answers | "Why?" and "How?" | "How many?" and "How much?" |
| Examples | Interview transcripts, support tickets, user reviews | Website traffic, conversion rates, survey scores |
| Output | Insights, themes, user stories | Charts, graphs, statistical models |
The real magic happens when you pair the "what" (quantitative) with the "why" (qualitative) to get a complete picture of the user experience.
The Goal Is Deeper Insight
The main goal here isn't to just count things but to understand them on a fundamentally human level. It’s about getting past surface-level metrics to really grasp the motivations, frustrations, and desires that drive how people behave.
This approach helps product teams to:
- Uncover "Unknown Unknowns": Find problems and opportunities you didn't even know you should be looking for.
- Build Real Empathy: Gain a genuine, firsthand understanding of your users' experiences and biggest pain points.
- Validate Your Assumptions: Confirm or completely debunk the hypotheses you have about your product and the market.
This method has deep roots in the social sciences and really took off after World War II as researchers looked for ways to understand human behavior beyond cold statistics. By the 1970s, formalized approaches like grounded theory changed the game. The landmark 1967 book 'The Discovery of Grounded Theory' laid the foundation and now has over 50,000 citations—a testament to its impact.
At its core, qualitative data analysis is the art and science of finding the signal in the noise of human feedback. It’s about turning messy, unstructured comments into clear, actionable direction.
For product teams, this means translating customer stories from support tickets, sales calls, and app reviews into a prioritized and intelligent roadmap. To get deeper into the nuts and bolts, it's worth checking out guides on how to analyze qualitative data effectively.
The Core Methods for Analyzing Qualitative Data
Think of qualitative data analysis methods as different lenses for viewing your customer feedback. Each one brings a unique part of the user experience into focus, helping you see the whole picture. While there are dozens of approaches out there, a handful of core methods are the go-to for researchers and product teams worldwide, consistently turning messy feedback into a clear, actionable story.
Getting to know these key methods helps you pick the right tool for the job. You wouldn't use a microscope to look at a distant star, and you wouldn't use a telescope to examine a cell. In the same way, the method you choose depends on what you’re looking for—broad patterns, individual stories, or the hidden meaning behind words.
While many techniques exist, a "Big 6" really dominate the field of modern qualitative data analysis. For instance, Content Analysis is a long-standing favorite, showing up in 40% of dissertations in 2024. Meanwhile, Thematic Analysis has seen a huge surge in popularity, now used in 35% of cases. These methods, along with others like Narrative and Discourse analysis, are the essential toolkit for any team that's serious about understanding its users. You can dig deeper into these trends and their applications in this in-depth overview of qualitative data methods.
Thematic Analysis: Finding the Patterns
For teams just dipping their toes into qualitative data, Thematic Analysis is often the perfect starting point. It's a straightforward but powerful method for finding, analyzing, and reporting on patterns—or themes—within your data. The whole point is to spot the recurring ideas that keep popping up across all those interviews, surveys, or support tickets.
For a product team, this might mean grouping a bunch of different user comments under a single theme like "Onboarding Friction."
- One user says, "I didn't know where to click first."
- Another mentions, "The setup process was overwhelming."
- A third complains, "The tutorial video was just too long."
See how those distinct comments all point to the same powerful theme? By identifying these patterns, you can zero in on the parts of your product that need immediate attention. It’s a really flexible approach that helps you see the forest for the trees.
Content Analysis: Counting and Categorizing
Where Thematic Analysis is all about finding the underlying meaning, Content Analysis is more systematic and, well, quantitative. This method is about categorizing your qualitative data by counting how often certain words, phrases, or concepts show up. It’s brilliant for getting a high-level view of massive datasets.
Let's say you're trying to make sense of 1,000 app store reviews. Instead of reading every single one, you could use content analysis to count how many times words like "bug," "crash," "slow," or "confusing" appear. This gives you a clear, data-backed snapshot of the most common complaints without getting lost in the details.
Key Takeaway: Thematic analysis finds the story by interpreting meaning. Content analysis quantifies the data by tracking specific terms.
Narrative Analysis: Understanding the Journey
We all think in stories. It’s just how our brains are wired. Narrative Analysis leans into this by focusing on how people construct stories to make sense of their experiences. Instead of chopping feedback into small themes, it looks at the entire user journey as one complete narrative.
This is perfect for understanding complex, multi-step processes. For example, you might analyze a long interview to map out a user's entire journey—from the moment they discovered your product to the day they became a paying customer. This approach is fantastic at revealing critical touchpoints, moments of pure delight, and frustrating roadblocks you might otherwise miss. It's about seeing the plot, characters, and climax of each user's personal story with your product.
A Step-by-Step Workflow for Analyzing Feedback
So, you're staring at a mountain of raw customer feedback. It's messy, it's unstructured, and turning it into something useful can feel overwhelming. The key is having a solid, repeatable process. A structured workflow for qualitative data analysis takes the guesswork out of the equation and ensures your insights are solid, trustworthy, and ready to inspire action.
Think of this less as a set of rigid rules and more as a clear path. It guides you from that initial pile of raw comments all the way to a compelling story that can actually shape your product roadmap.
Stage 1: Get Familiar with Your Data
Before you can even think about analyzing, you have to get your hands dirty. The first step is to simply immerse yourself in the feedback. This isn't about deep analysis yet; it’s about getting a feel for what people are saying. If you have interview recordings, get them transcribed. If you've got survey responses, pull them into a clean spreadsheet.
Then, just read. Go through everything. Make a few notes on the side about interesting quotes or ideas that keep popping up. The goal here is pure familiarization. You're just trying to get a gut feeling for the landscape before you start drawing the map. Having a clear plan from the start is crucial; you can learn more by reviewing a https://www.sigos.io/blog/sample-research-plan to see how this initial phase fits into the bigger picture.
Stage 2: Create Your Initial Codes
Alright, now the real analysis begins. We start with coding, which is just a fancy way of saying we're going to label small chunks of data. Think of it like using different colored highlighters to tag key concepts as you read. A user saying, "I couldn't figure out where to add my credit card," might get tagged with a code like "payment friction."
There are two main ways to tackle this:
- Deductive Coding: You come to the data with a list of codes already in mind, usually based on your research questions (e.g., "Usability," "Pricing," "Performance").
- Inductive Coding: You let the data speak for itself. You create new codes as you go, based on what you’re actually seeing in the feedback.
In reality, most teams end up using a blend of both. This stage is all about bringing some order to the chaos, creating manageable pieces that will help you spot the bigger patterns later on.
This diagram shows how this foundational process of coding and theming applies to a few common analysis methods.
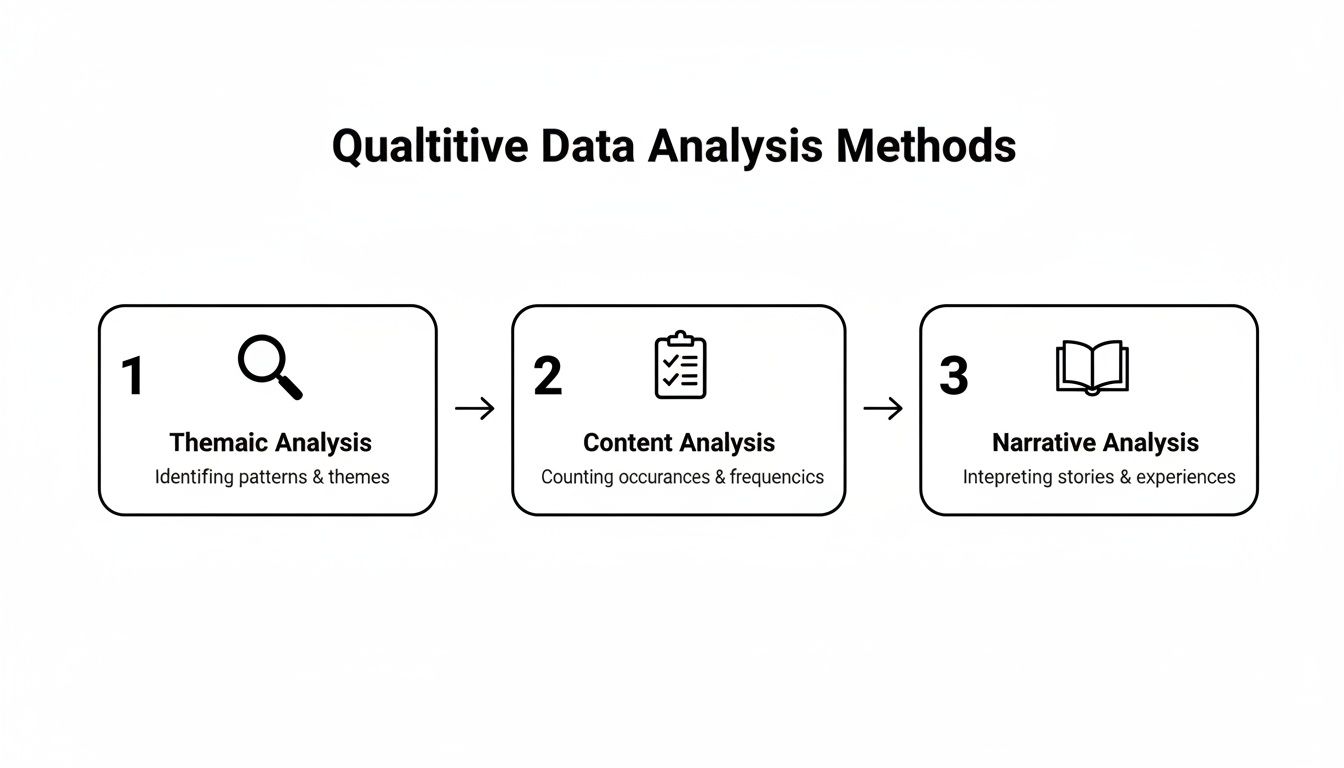
Whether you're looking for themes or counting keyword frequency, it all starts with this fundamental step of breaking down and organizing the raw feedback.
Stage 3: Group Codes into Themes
Once you've coded your data, it's time to zoom out. Look at all the little labels you've created and start clustering related ones into broader themes. A theme isn't just a category; it's a significant, recurring pattern that tells you something important.
For instance, you might notice that codes like "confusing navigation," "unclear icons," and "too many clicks" all point to the same larger issue. You could group them all under a powerful theme like "Poor User Interface."
This is the point where a real story starts to emerge. You’re moving from a jumble of individual comments to a cohesive set of insights that explain what's actually going on with your users.
Stage 4: Review and Present Your Findings
Now, take a critical look at the themes you've identified. Do they accurately reflect the data? Do they tell a clear, coherent story? Make sure each one is backed by strong quotes and examples from your feedback. Tweak them until they feel distinct and convincing.
Finally, you need to share what you've found. Don't just hand your team a list of themes. Tell the story behind them. Use vivid user quotes and hard numbers to build a narrative that gets your team to sit up and listen. The goal is to build empathy and, most importantly, drive action. For product teams looking to go deeper, this guide on mastering customer feedback analysis is an invaluable next read.
Putting Qualitative Analysis into Practice with Real Examples

Theory is one thing, but let's walk through a real-world scenario to see how this all clicks into place. Picture a product team at a SaaS company feeling stuck. They’ve just rolled out a slick new analytics feature, but the adoption rates are frankly terrible. It's time to figure out why.
This is the perfect moment to move beyond the cold, hard usage metrics and get into the much messier, more human side of things. The team needs to understand the story behind the numbers.
Uncovering Themes from User Interviews
First things first: they need to talk to their users. The team sets up five in-depth interviews with people who gave the new feature a try but quickly dropped off. Once the calls are transcribed, the real work begins. They start coding the transcripts, essentially slapping short, descriptive labels on key quotes and comments.
It doesn't take long for a few obvious patterns to bubble up from the data:
- Code "Confusing UI": One user flat-out said, "I had no idea what the charts were even showing me." Another pointed out, "The filters were buried three clicks deep."
- Code "Missing Integration": A third user was blunt: "It's useless unless it connects to our CRM." This exact sentiment came up in three of the five conversations.
- Code "Slow Performance": Several users complained about how long it took to load, with one calling the feature "painfully sluggish."
By clustering these codes together, the team identifies two major themes: "Severe Usability Issues" and "Critical Integration Gaps." Just like that, they have a clear, evidence-based direction for what to fix.
The real power of qualitative analysis is its ability to transform vague problems like "low engagement" into specific, actionable insights like "users can't find the filters."
Pinpointing Issues with Survey Responses
At the same time, the team digs into 50 open-ended responses from an in-app survey that asked, "What was the most frustrating part of using the new feature?" This is their chance to see if the themes from that small interview group hold true across a larger set of users.
Sure enough, 70% of the comments mention confusion or usability, and 40% bring up the missing integration. This validates their initial findings and gives them the confidence they need to make these issues a top priority. This is a classic example of effective voice of customer analysis, where you weave together different feedback threads to see the whole story.
Mapping the Journey with Timeline Interviews
To get even deeper, the team pulls out a more advanced technique: the Timeline Interview Method. Instead of just asking about the feature in isolation, they ask a user to walk them through their entire experience over the past month. They map out key events, frustrations, and wins on a visual timeline together.
This approach uncovers something crucial: users were most excited about the feature before they actually used it. Their frustration didn't just happen at first glance—it peaked when they tried to share a report with their boss and hit a wall because the CRM integration wasn't there. This method, which emerged in research around 2004, helps teams co-create a story with users, revealing those make-or-break moments that a standard interview might completely miss. You can read more about the evolution of this powerful research method to see how it developed.
Choosing the Right Tools for Modern Qualitative Analysis
When you're just starting out, sifting through feedback with spreadsheets and sticky notes works fine. But that system breaks down fast. As the volume of customer comments, survey responses, and interview notes grows, you need tools to handle the load and find the signal in the noise.
The right software can turn qualitative analysis from a time-consuming chore into a real strategic advantage. It’s not just about fancy features; it's about finding a tool that fits your team's workflow, skill level, and budget. The options range from heavy-duty academic software to newer, AI-driven platforms built specifically for product teams.
Dedicated Academic and Research Software
This category is home to the powerhouses of qualitative analysis, like NVivo or ATLAS.ti. For decades, they’ve been the gold standard for academics and social scientists because they offer an incredible depth of features for coding, memoing, and mapping out complex relationships in your data.
They’re built for deep, exhaustive analysis. But that power comes with a price. These tools often have a steep learning curve and can feel like using a sledgehammer to crack a nut for a product team that just needs to analyze last week’s user interviews. They’re fantastic for long-term research projects but can slow you down in a fast-paced product environment.
It's all about balancing power with practicality. A tool with a hundred features you'll never touch can be more of a hindrance than a simpler solution that just works for you.
Modern User Research Platforms
A new wave of tools has popped up to serve the specific needs of product and UX teams. Platforms like Dovetail or Condens are designed to be a central "research repository" where all your qualitative data lives. They make it incredibly easy to store, tag, and analyze everything from interview transcripts to survey results in one shared space.
Their biggest strength is their user-friendly design and focus on collaboration. They shine when it comes to creating highlight reels from user calls or making key insights easy for stakeholders to find and understand. For teams trying to get a handle on all their feedback, looking at different customer feedback analysis tools is a great way to see what's out there.
AI-Powered Analysis Tools
The newest kids on the block are AI platforms that do most of the heavy lifting for you. Tools like SigOS can churn through thousands of support tickets, app store reviews, or NPS comments in minutes. They automatically pull out key themes, track sentiment, and can even connect customer complaints to potential revenue loss.
The obvious win here is speed and scale. You can get a high-level overview of what your customers are talking about almost instantly, freeing up your team to think about strategy instead of spending weeks manually tagging data. The key is to remember that this automation is best paired with human judgment to catch the subtle context that a machine might miss.
Choosing Your Qualitative Data Analysis Tool
Picking the right tool depends entirely on your team's specific goals. Do you need a centralized home for all research artifacts, or are you trying to process massive volumes of unstructured feedback quickly? Here’s a quick breakdown to help you decide.
| Tool Category | Best For | Key Strengths | Potential Drawbacks |
|---|---|---|---|
| Academic Software | In-depth academic studies, long-term research projects, and social science research. | Unmatched analytical depth, rigorous coding, and complex relationship mapping. | Steep learning curve, expensive, often overkill for fast-moving product teams. |
| User Research Platforms | Product & UX teams needing a central repository for interview notes, surveys, and insights. | Collaborative, user-friendly, great for sharing findings with stakeholders. | Can become costly as data volume grows; may lack advanced analytical features. |
| AI-Powered Tools | Teams analyzing high volumes of feedback from sources like support tickets, reviews, and surveys. | Incredible speed and scale, automates theme detection and sentiment analysis. | Requires human oversight to ensure nuance is captured; less control over fine-grained coding. |
Ultimately, the best tool is the one your team will actually use. Start by identifying your biggest pain point—is it organizing research, or is it processing a firehose of feedback? Your answer will point you toward the right category and, eventually, the perfect tool for the job.
Common Questions About Qualitative Data Analysis
Even with a solid plan, jumping into qualitative data analysis can feel a bit fuzzy. It’s natural to have questions. Product teams often get hung up on things like staying objective, figuring out how many people to talk to, or whether it's okay to mix and match different kinds of data. Nailing these concepts down is what separates good research from great research.
Let's walk through some of the most common questions and get you some clear, practical answers.
How Do You Ensure Objectivity in Qualitative Analysis?
This is a big one. Let's be honest: pure, 100% objectivity is a myth. We all have our own perspectives. The real goal isn't to become a robot, but to be rigorous, transparent, and aware of your own biases. It’s about building a process that is so clear and systematic that anyone can follow your logic and trust your conclusions.
Here are a few powerful techniques to keep your analysis fair and grounded:
- Member Checking: Go back to the source. Once you've pulled out what you think are the key themes, share them with some of your original participants. Ask them, "Does this sound right? Does this reflect what you were trying to tell us?" It's one of the best ways to reality-check your interpretations.
- Peer Debriefing: Grab a teammate who has no skin in the game. Walk them through your data, your codes, and how you arrived at your themes. A fresh set of eyes is fantastic for catching assumptions you didn't even know you were making.
- Triangulation: Never rely on a single data source. If you hear something in a user interview, see if you can find similar feedback in support tickets or open-ended survey responses. When the same theme pops up in different places, you know you're onto something real.
- Maintain a Clear Audit Trail: Write everything down. Document why you created a certain code or how a few smaller ideas merged into a larger theme. This transparency makes your work defensible and easy for others to understand.
What Is the Right Sample Size for Qualitative Research?
Everyone asks this, and the answer is usually not what they expect: there is no magic number. Unlike quantitative research where you need a certain sample size for statistical significance, the game here is all about depth. The guiding principle isn't a number, but a concept called thematic saturation.
Thematic saturation is the point you reach when new interviews stop giving you new insights. You start hearing the same stories, the same pain points, and the same ideas over and over. More data just confirms what you already know.
For most product discovery projects, you might be surprised to find you can hit this point with just 5 to 15 in-depth interviews, especially if your user group is well-defined. Remember, ten rich, detailed conversations are infinitely more valuable than fifty shallow ones.
Can I Mix Qualitative and Quantitative Data?
Not only can you, but you absolutely should! This is called a mixed-methods approach, and it’s how you get a complete, 360-degree view of what's really going on with your product. Think of it this way: quant and qual data answer different parts of the same question, and together they tell a powerful story.
For example, your analytics (the quantitative part) might tell you what is happening. You might see that "75% of users are dropping off at the final checkout screen." That's a huge problem, but it doesn't tell you anything about the cause.
Then, your user interviews (the qualitative part) reveal the why. You hear people say they were blindsided by high shipping costs or that the "apply discount" button was confusing.
When you bring both together, you have an airtight case. You can validate your human stories with hard numbers and explain the story behind the data drop-off. This dual-lens approach is the foundation for making smart, confident product decisions.
At SigOS, we transform messy, qualitative feedback into the clear, revenue-driving insights your team needs. Our AI-driven platform analyzes support tickets, sales calls, and user reviews to automatically identify the bugs costing you money and the features your best customers are asking for. Stop guessing and start prioritizing with SigOS.
Keep Reading
More insights from our blog


Ready to find your hidden revenue leaks?
Start analyzing your customer feedback and discover insights that drive revenue.
Start Free Trial →