What Is Statistical Significance? A Clear Explanation
Discover what is statistical significance and learn how p-values help you interpret data confidently. Get the insights you need today!

Statistical significance gives us a way to figure out if the results we're seeing are real or just a fluke. In a nutshell, it’s the tool that lets you say with confidence, “Yep, the change we made actually worked,” instead of just crossing your fingers and hoping you got lucky. It's the bedrock of making smart, data-driven decisions.
What Is Statistical Significance in Simple Terms
Let's say you're A/B testing two different headlines on your homepage. Headline A is the one you’ve been using, and Headline B is the new one you want to try. After running the test for a day, you see that Headline B got 15% more clicks. Awesome, right?
But hold on. The big question is: Is Headline B actually better, or was that 15% lift just random noise? This is exactly where statistical significance comes in. Think of it as your BS detector for data.
Without it, you could waste a ton of time and money rolling out a change that was based on a meaningless, temporary spike. By running a significance test, you get to measure how strong your evidence really is and decide if the result is big enough to trust.
Introducing the Null Hypothesis
To get there, statisticians start with a skeptical mindset. They create a "what if" scenario called the null hypothesis. This is just a fancy way of saying we assume there's no difference between the things we're testing.
For our headline example, the null hypothesis would be: "There is no difference in click-through rates between Headline A and Headline B." The whole point of our experiment is to collect enough evidence to prove that this default assumption is wrong.
If we can show that our results would be super unlikely to happen by pure chance, we can "reject the null hypothesis." That's when we can finally say our result is statistically significant. This rigorous approach is a cornerstone of effective enterprise data analytics, helping turn messy data into clear, actionable insights.
To help you get comfortable with the lingo, here's a quick rundown of the core concepts we'll be discussing.
Core Concepts of Statistical Significance
| Term | Simple Explanation | Role in Testing |
|---|---|---|
| Null Hypothesis (H₀) | The default assumption that there is no effect or difference. | It's the idea you're trying to disprove with your data. |
| Alternative Hypothesis (H₁) | The idea that there is an effect or difference. | This is what you hope your experiment will provide evidence for. |
| P-value | The probability of seeing your results if the null hypothesis were true. | A small p-value (e.g., < 0.05) means your results are unlikely to be random chance. |
| Significance Level (α) | The threshold you set for how much doubt you're willing to accept (often 5%). | If your p-value is below this threshold, you declare the result significant. |
These concepts work together to give you a clear framework for making decisions.
It’s what takes you from, "I have a gut feeling this worked," to, "I have solid proof this worked." For a more in-depth look at the fundamentals, check out this great explainer on What is Statistical Significance. Ultimately, it’s about making confident, evidence-backed moves that drive your product forward.
The Surprising History of Significance Testing

To really understand statistical significance, it helps to know it didn’t just appear in a modern data lab. Its roots go back centuries, telling a human story of trying to find real patterns in a world full of random noise. The journey started long before big data was even a dream.
The first whispers of these ideas emerged back in the 1700s. People like John Arbuthnot were using simple probability to argue that the consistent surplus of male births over female births wasn’t just a fluke—it had to mean something more. This was one of the first times anyone used statistics to question the idea that an outcome was purely random chance.
But the framework we rely on today was really built by one brilliant mind.
The Architect of Modern Testing
The whole concept was properly formalized in the 1920s, thanks to a biologist and statistician named Ronald Fisher. He was working at an agricultural research station and had a very practical problem: did a new fertilizer actually make crops grow better, or were the good results just a lucky coincidence?
This real-world challenge drove him to develop the ideas we now take for granted.
Fisher introduced the p-value as a tool to measure the evidence against a "null hypothesis"—the assumption that nothing special is happening. He also put forward the 0.05 significance level, a threshold that has become a standard in research worldwide. It's crucial to realize this wasn't some magic number pulled from a complex equation.
His work, especially his 1925 book Statistical Methods for Research Workers, gave scientists a clear, structured way to make claims based on data. You can explore more about the foundational development of statistical methods if you're curious. This history shows how a simple, practical guideline became a cornerstone of modern data analysis.
Decoding P-Values and Significance Levels

So, how do we know if a change in our data is a real trend or just random noise? It all comes down to two key ideas: the p-value and the significance level.
Think of the p-value as an "evidence-o-meter." It’s a number between 0 and 1 that tells you how strong your evidence is against the idea that nothing changed (the null hypothesis).
In simple terms, the p-value is the probability you’d see your results—or something even more dramatic—if your changes actually had zero effect. A tiny p-value suggests that your outcome would be a huge fluke if nothing was really going on.
That naturally brings up a question: how tiny is tiny enough?
Setting the Bar With Alpha
Before you even begin analyzing results, you have to decide where to draw the line. This cutoff point is your significance level, often called alpha (α). It’s the threshold you pre-set to determine if your evidence is strong enough to matter.
The most common alpha used in business and research is 0.05, or 5%. By choosing this level, you're saying you're comfortable with a 5% risk of being wrong—that is, seeing a significant result when it was just a random fluctuation.
Once you have your p-value and your alpha, the decision is straightforward:
- If p-value ≤ alpha: The result is statistically significant. You can reject the null hypothesis.
- If p-value > alpha: The result is not statistically significant. You don't have enough evidence to say anything changed.
Let's say you set your alpha at 0.05. You run an A/B test on a new headline, and the results come back with a p-value of 0.02. Since 0.02 is less than 0.05, you have a statistically significant finding. The data suggests your new headline genuinely had an impact.
Getting a handle on this relationship is the key to truly understanding what your product metrics are telling you. It gives you a reliable framework for making decisions based on data, not just a gut feeling.
How Businesses Use Statistical Significance
In the business world, statistical significance is what helps you tell the difference between a real trend and just random noise. It’s the tool that keeps you from making expensive decisions based on a fluke. Think of it as a way to turn raw data into a trustworthy guide for action, making sure you put your resources behind changes that will actually move the needle.
Companies use this concept every single day to check if their strategies are working. Imagine an e-commerce site running an A/B test on a new checkout button. Statistical significance is what tells them whether that 7% bump in conversions is a genuine improvement or just a lucky break. This is crucial for avoiding a company-wide rollout of a change that doesn't really help. It's especially common in areas like customer experience analytics, where you need to be sure the shifts you're seeing in customer data are meaningful.
This kind of rigorous analysis is the key to turning user data into smart, profitable decisions. You can dive deeper into how companies make sense of user actions in our guide on what is behavioral analytics: https://www.sigos.io/blog/what-is-behavioral-analytics
From Manufacturing to Marketing
The idea of significance testing isn't new; it has deep roots in quality control. Its influence really took off globally in the mid-20th century when statistical methods started revolutionizing Japanese manufacturing. Engineers like Genichi Taguchi developed techniques that used significance testing to pinpoint the specific factors that truly improved product quality, which in turn helped fuel incredible economic growth.
The simple flowchart below breaks down the core logic for making a decision that's statistically sound.
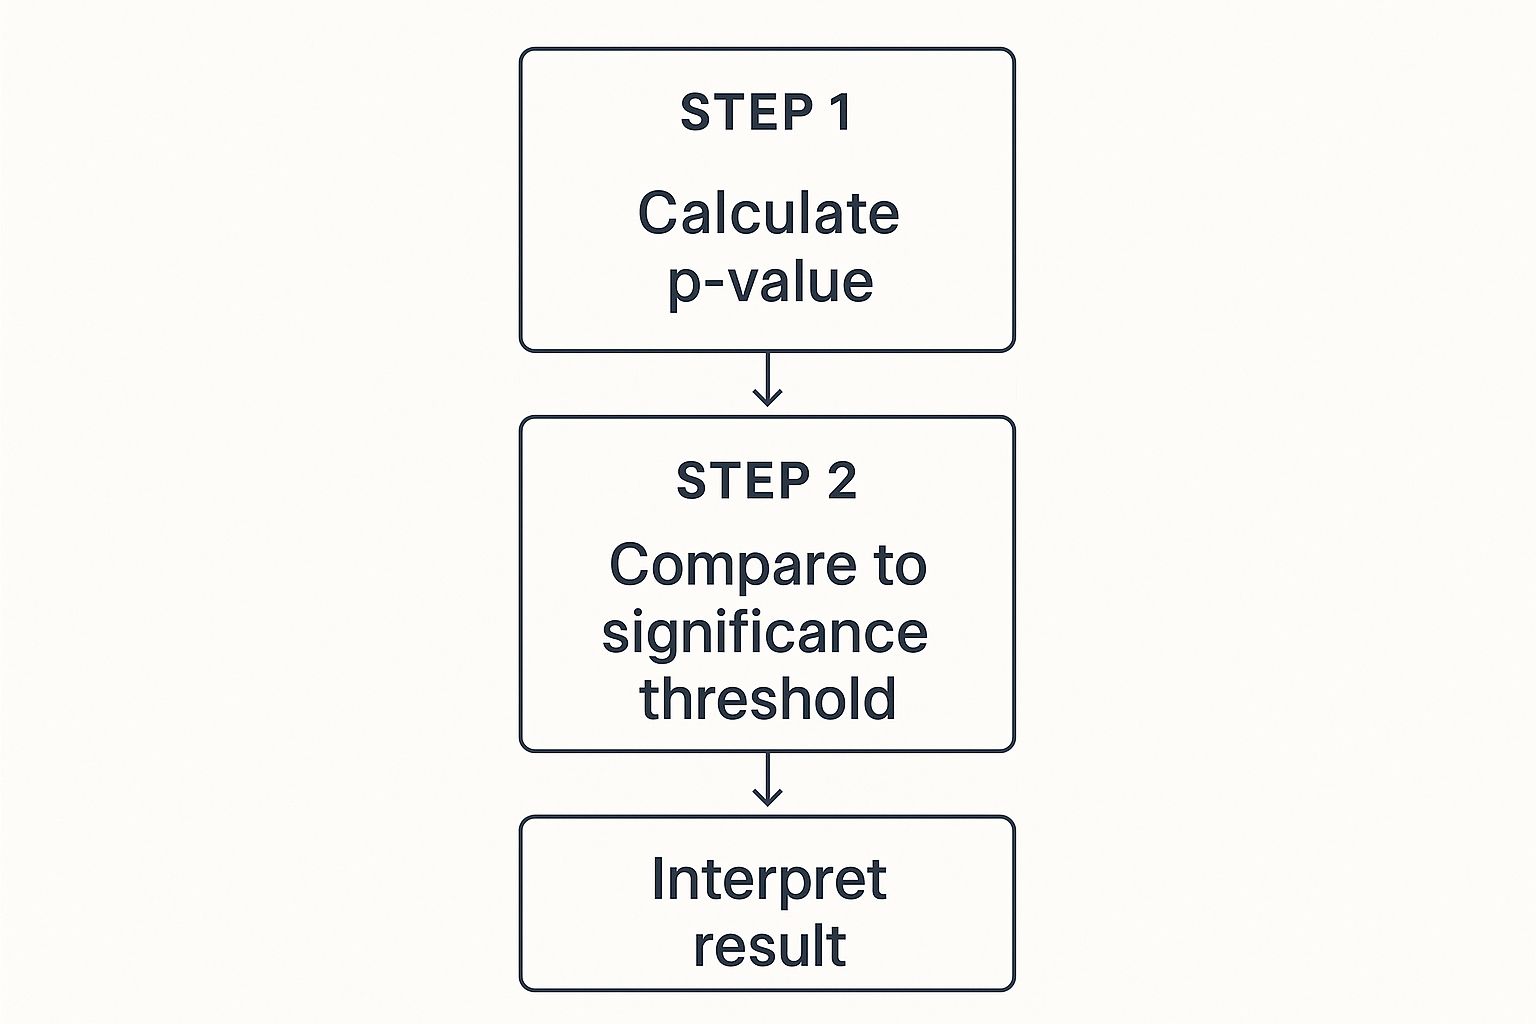
This visual lays out a clear, three-step journey from calculation to conclusion. It’s the same basic framework businesses rely on to evaluate everything from brand-new product features to their latest marketing campaigns.
Walking Through a Real-World Example
Alright, let's move from theory to practice. Seeing how statistical significance plays out in a real scenario is the best way to make it stick.
Imagine a software company we'll call "Appify." They've just built a new feature and need to answer a critical question: does it actually get more users to log in each day? This isn't a decision they want to leave to guesswork. They need hard evidence before they invest more time and money.
To get a real answer, Appify runs a structured experiment. Here’s the five-step process they follow to go from a simple question to a data-backed decision.
The Five Steps to a Confident Decision
Following a clear process like this is what separates a lucky guess from a sound business strategy. It ensures the final call is based on evidence, not just a gut feeling.
-
State the Null Hypothesis: First, the team makes a baseline assumption: the new feature has zero effect on daily logins. This is their null hypothesis (H₀), the idea they're trying to disprove. Think of it as "innocent until proven guilty."
-
Choose a Significance Level: Before even looking at the numbers, Appify sets their significance level (alpha or α) to 0.05. This is their risk tolerance. It means they're willing to accept a 5% chance of being wrong—of thinking the feature worked when it was really just random noise.
-
Collect the Data: Now it’s time to gather the evidence. They split their users into two groups for a set period. One group (the control) keeps using the old version, while the other group (the test) gets the new feature. This method of grouping users is a core part of what is cohort analysis.
-
Calculate the P-Value: With the data in hand, Appify's analysts run the numbers. We’ll skip the heavy-duty math, but the end result is a single, crucial figure: the p-value. This number tells them the probability of seeing the results they saw if the null hypothesis were true (i.e., if the feature had no effect).
-
Make a Decision: The final step is simple: compare the p-value to the significance level. Since 0.02 is less than 0.05, the result is statistically significant. Appify can confidently reject the null hypothesis. The data shows the new feature genuinely drove the increase in logins, giving them the green light to roll it out to everyone.
Common Misconceptions You Need to Avoid
Statistical significance is an incredibly useful concept, but it's also one of the most twisted and misunderstood ideas in all of data analysis. Getting it wrong isn't just an academic mistake; it can lead to bad business decisions based on faulty conclusions. Let's clear the air on a few common traps.
The biggest mistake by far is thinking statistical significance is the same thing as practical importance. Just because a result is "significant" doesn't automatically mean it's big, meaningful, or worth popping champagne over.
Imagine you have a huge amount of data. You might find that changing a button color from dark blue to slightly less dark blue increases clicks by a statistically significant 0.01%. The math checks out—the effect is real and not just a random fluke. But is a 0.01% lift actually going to move the needle for your business? Probably not.
Significant Does Not Mean Important
This is the key takeaway. Significance just gives you confidence that an effect is likely real, not just random noise. The size of that effect is a totally separate question, and that’s what determines its practical value.
Always ask two questions: "Is this result statistically significant?" and, "Okay, but is it also big enough to actually matter?"
Another huge pitfall is what the p-value actually means. It feels intuitive to interpret it one way, but that intuition is often wrong.
So, what does it mean? It means that if we assume your new feature had zero effect, you’d only get results this extreme (or more extreme) in 3% of experiments due to random chance alone. It’s a measure of how surprising your data is, not a direct probability of your idea being right.
Getting this right helps you talk about your results with the right level of confidence and avoid making promises the data can't actually support.
To help drive this home, let's look at some common ways people trip up on p-values and how to think about them correctly.
Correcting Common P-Value Misinterpretations
| Common Misconception | Correct Interpretation |
|---|---|
| "The p-value is the probability that the null hypothesis is true." | The p-value is the probability of seeing our data (or more extreme data) if the null hypothesis were true. |
| "A p-value of 0.04 means there's a 96% chance our change caused the effect." | A p-value of 0.04 simply means our result is statistically significant at the 0.05 level. It doesn't give a direct probability of our hypothesis being correct. |
| "A non-significant result (p > 0.05) proves there is no effect." | A non-significant result only means we failed to find evidence against the null hypothesis. The effect could be zero, or it could be too small for our test to detect. |
| "Statistical significance means the effect is large and important." | Statistical significance only tells us that an effect is unlikely to be due to chance. The size and practical importance of the effect must be evaluated separately. |
Keeping these distinctions in mind is crucial. It’s the difference between using data as a reliable guide and using it as a tool for self-deception.
Frequently Asked Questions About Significance

As you start working with statistical significance, you'll naturally run into a few common questions. Let's walk through some of the big ones to make sure these concepts are crystal clear.
One of the most frequent points of confusion is what a non-significant result really means. It's tempting to think it means "no effect," but that's not quite right. A non-significant result does not prove the absence of an effect. It just means your test couldn't find enough evidence to say one exists. The true effect could be zero, or it could just be too small for your current sample size to pick up on.
Another great question is how to pick the right significance level in the first place.
Why Is 0.05 the Standard
That go-to 0.05 alpha level you see everywhere isn't some magic number handed down from the heavens. It's a historical convention that started with statistician Ronald Fisher, who saw it as a practical, common-sense middle ground for research. But it's definitely not a one-size-fits-all solution.
The alpha level you choose should depend entirely on the stakes of your decision.
- Go stricter (e.g., 0.01): You'd want to do this when a false positive would be a disaster. Think about launching a mission-critical, expensive new feature based on a fluke—you’d want to be extra sure the effect is real.
- Go looser (e.g., 0.10): This can be perfectly fine for low-risk, exploratory tests. Here, the goal might be to cast a wider net so you don't overlook a smaller, but still potentially interesting, effect.
Lastly, never forget about sample size. If your sample is massive, even a tiny, practically meaningless change can show up as statistically significant. This is why you must always look at the effect size alongside the p-value. That combination tells you not just if there's a difference, but if that difference is big enough to actually matter in the real world.
Ready to turn your customer feedback into revenue-driving insights? SigOS uses AI-driven intelligence to identify the signal in the noise, helping you prioritize what truly matters. Explore the SigOS platform.


Ready to find your hidden revenue leaks?
Start analyzing your customer feedback and discover insights that drive revenue.
Start Free Trial →