Lifetime Value Calculation SaaS Playbook
Unlock growth with our guide to lifetime value calculation SaaS. Learn the right formulas and strategies to accurately measure and improve LTV.

In the world of SaaS, calculating lifetime value isn't just an accounting exercise. It's the ultimate litmus test for your business model's health. A solid LTV proves that your marketing spend, pricing structure, and product development are all pulling in the same direction toward sustainable profit.
Why SaaS LTV Is Your Most Important Growth Metric

Let's be honest, many SaaS metrics are just noise. They give you a quick snapshot but fail to tell the whole story. Lifetime Value (LTV) is different. It looks past this month's revenue to forecast the total profit you can expect from a customer over their entire time with you. Think of it as the most honest health check your subscription business can get.
Getting LTV right directly informs your most critical decisions:
- Marketing Budgets: LTV tells you exactly how much you can afford to spend acquiring a customer. It's the key to making sure your acquisition channels are actually profitable.
- Pricing Tiers: By analyzing LTV, you can see which pricing plans bring in and keep your most valuable customers, which is crucial for refining your pricing strategy down the line.
- Product Roadmap: When you see which features your high-LTV customers use most, you know exactly where to focus development to boost retention and deliver more value.
From Vanity Metric to Strategic Power
On its own, a single LTV number doesn't mean much. The real magic happens when you start segmenting it. For example, a SaaS founder might dig in and find that customers brought in through content marketing have a 3x higher LTV than those from paid search ads. Suddenly, you have a crystal-clear signal on where to double down on your investment and where you might need to scale back.
This kind of analysis can also uncover uncomfortable truths. You might discover that a particular customer segment, even though they're on a premium plan, is actually a net loss because of their high support costs and tendency to churn. That’s a crucial insight you'll never get from a simple Monthly Recurring Revenue (MRR) chart.
The Cornerstone of Sustainable Growth
Retention is everything in SaaS. LTV captures this perfectly, measuring not just revenue but also customer loyalty and business sustainability. Companies that fixate on acquisition often struggle, while those who focus on retention win. Why? Because loyal customers generate expansion revenue, refer new business, and offer priceless feedback.
Keep an eye on behavioral cues like login frequency and feature adoption—these are often early warning signs or positive indicators of a customer's long-term LTV. To really make LTV a core part of your strategy, you need to visualize the data effectively. You can explore top business intelligence dashboard examples to see how leading companies turn raw numbers into actionable insights. Understanding the "why" behind the metric is what gives the calculation its strategic bite.
Gathering the Right Data for Your LTV Calculation
Any LTV calculation is only as good as the numbers you feed it. Before you even touch a formula, you have to get your data house in order. Think of it like this: if you build a house on a shaky foundation, the whole structure is compromised. Your SaaS LTV is no different.
The old saying "garbage in, garbage out" is the absolute rule here. Using messy or incomplete data will spit out a misleading LTV, which can be even more dangerous than having no LTV at all. It might convince you to overspend on customer acquisition or give you a false sense of security about your business's health.
This process really boils down to three core pillars of data.
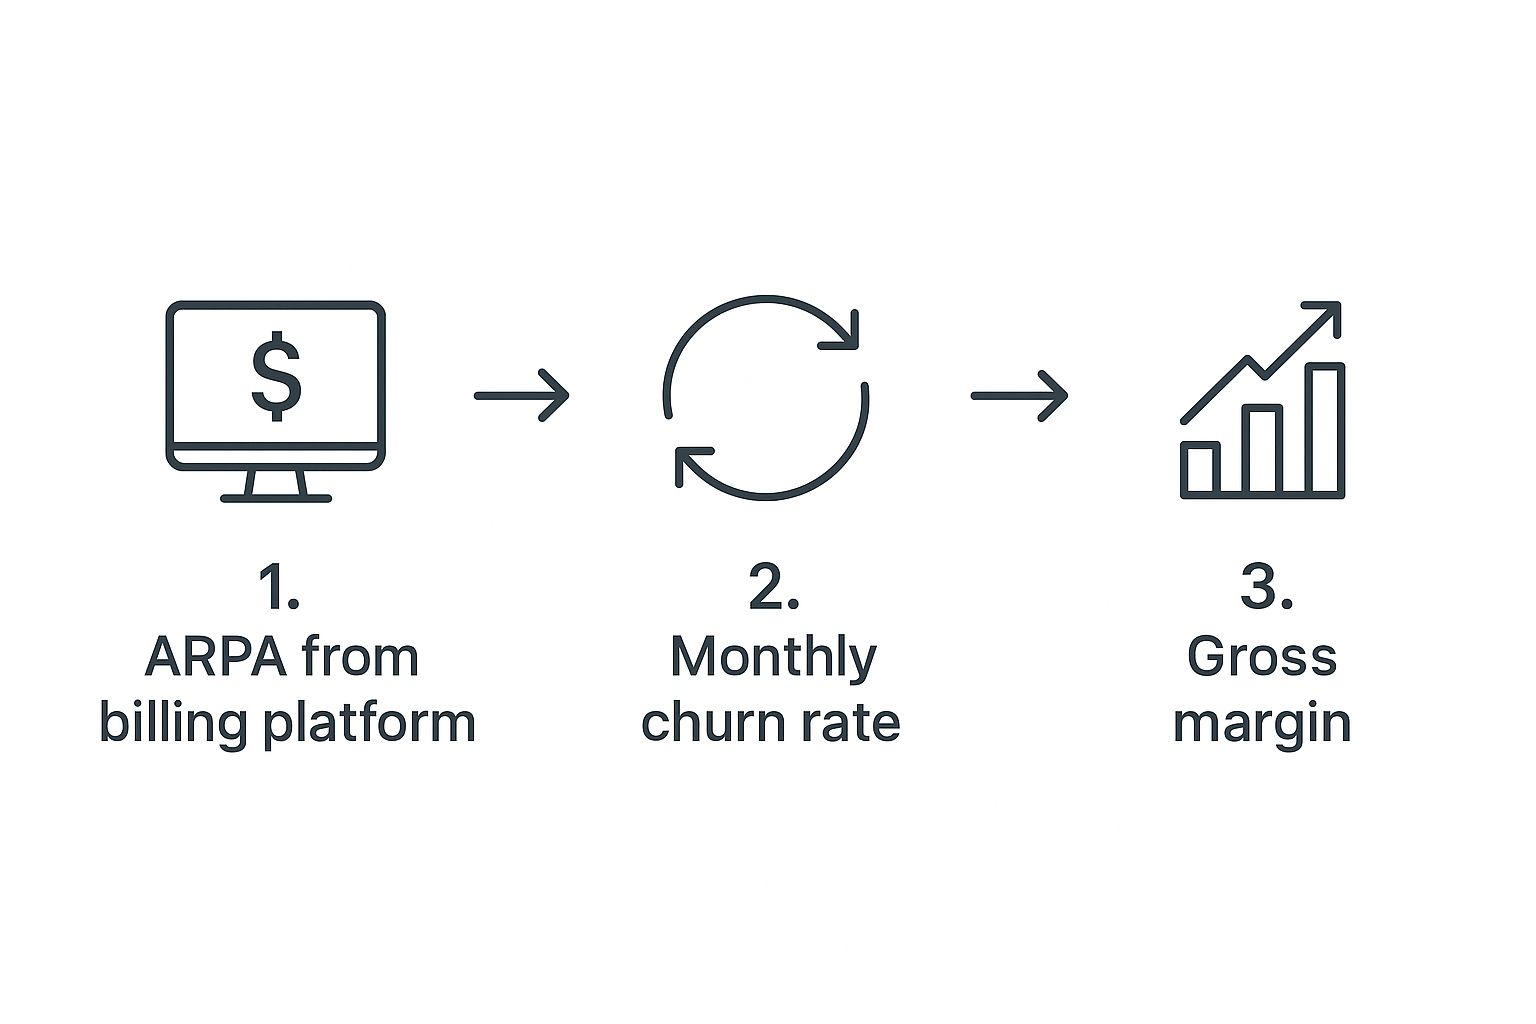
As you can see, it's a logical flow from revenue to retention and finally to profitability. Get these three right, and you're well on your way.
Pinpointing Your Core Metrics
So, where does all this crucial information live? Your data is likely scattered across a few different platforms. Knowing exactly where to look is half the battle.
To get started, you'll need to pull together a few essential data points. These metrics form the bedrock of any reliable LTV calculation.
| Metric | What It Measures | Common Data Source |
|---|---|---|
| Average Revenue Per Account (ARPA) | The average revenue you generate from each customer, usually on a monthly basis. | Your billing system (e.g., Stripe, Chargebee) or a revenue analytics tool. |
| Customer Churn Rate | The percentage of customers who cancel their subscriptions within a specific period. | Your billing platform, CRM, or a subscription management tool. |
| Gross Margin | The percentage of revenue left after accounting for the direct costs of serving your customers (COGS). | Your accounting software (e.g., QuickBooks, Xero) combined with billing data. |
Let's break these down a bit further. Your ARPA is straightforward: take your Monthly Recurring Revenue (MRR) and divide it by your total number of active customers. For churn, be careful to distinguish between customer churn (how many accounts you lost) and revenue churn (how much MRR you lost). They tell very different stories.
Finally, gross margin is the one I see people get wrong most often. LTV should always reflect profit, not just revenue. Subtract your Cost of Goods Sold (COGS)—things like hosting fees, third-party API costs, and direct support salaries—from your total revenue to get your gross profit.
Avoiding Common Data Traps
Pulling this data isn’t always a simple copy-paste job. A classic mistake is using total revenue instead of a gross margin-adjusted figure. This will dramatically inflate your LTV and make your unit economics look far rosier than they are.
Another common pitfall is miscalculating churn, especially if you have a mix of monthly and annual subscription plans.
Getting these numbers clean and tracking them consistently is non-negotiable. If you're looking to really get this right, it helps to understand the systems that bring all this data together. For a more technical look, our guide on how to build data pipelines explains how to create these reliable data flows from scratch.
With accurate inputs for ARPA, churn, and gross margin, you're finally ready to calculate an LTV figure you can actually trust to make smart decisions.
Picking the Right LTV Formula for Your SaaS
When it comes to calculating customer lifetime value, there’s no single magic formula that works for every SaaS business. The right approach really depends on your business model, how long you've been around, and what kind of data you can actually get your hands on.
Picking the wrong formula can give you a dangerously misleading picture of your company's health. The goal is to choose a method that mirrors your current reality. An early-stage startup with limited history has very different needs than a mature, public company sitting on years of detailed cohort data.
Let's walk through the most common LTV formulas, starting with the basics and building up to the more precise methods.
The Simple LTV Formula: A Great Place to Start
For most early-stage SaaS companies, the simplest formula is the best entry point. It gives you a quick, directional sense of your unit economics without getting you bogged down in complex variables you might not even be able to track yet.
The formula is as straightforward as it gets:
LTV = Average Revenue Per Account (ARPA) / Customer Churn Rate
Let's say you run a project management tool. Your average customer pays $50 per month (your ARPA), and you lose about 4% of your customers each month (your churn rate).
- Calculation: 50 / 0.04 = 1,250 LTV
This quick math tells you that, on average, a new customer is worth $1,250 in revenue over their entire relationship with your business. That's a powerful number! It immediately helps you figure out how much you can afford to spend to acquire a new customer.
But it has one major flaw: it’s based on revenue, not profit.
The Gross Margin-Adjusted Formula for a Truer Picture
Once your business has a bit of a track record and you have a better handle on your costs, it's absolutely crucial to switch to a more accurate formula. This next method brings your gross margin into the equation to show the actual profit each customer generates.
This metric is critical in the SaaS world, as it represents the total revenue a company can truly expect from a customer. The lifetime value calculation saas model relies on key inputs like Average Revenue Per User (ARPU), gross margin, and churn rate. A standard approach is LTV = (ARPU x Gross Margin %) / Churn Rate. For instance, a company with a 100 ARPU, an 80% gross margin, and a 5% monthly churn rate would have an LTV of 1,600. You can explore more on these core SaaS metrics and see how mature companies tackle complex scenarios like negative churn with this in-depth analysis from Growth Equity Interview Guide.
Let’s go back to our project management tool example:
- ARPA: $50
- Churn Rate: 4%
- Gross Margin: Let's say it's 80% (after you account for things like hosting, support software, and other costs of service).
The new formula looks like this:
LTV = (ARPA x Gross Margin) / Customer Churn Rate
- Calculation: (50 x 0.80) / 0.04 = 1,000 LTV
Now that's a much more realistic figure. It shows the true profit value of a customer is 1,000, not the 1,250 revenue figure we saw earlier. This distinction is vital for making sound financial decisions.
Handling Negative Churn with a Discount Rate
So, what happens when your business is really firing on all cylinders and you achieve negative net churn? This is the SaaS holy grail. It happens when your expansion revenue from existing customers (think upgrades and add-ons) is greater than the revenue you lose from customers who cancel.
The problem is, with a negative churn rate, the standard LTV formula completely breaks. A negative number in the denominator would mathematically give you an infinite LTV, which, while flattering, is obviously not helpful for planning.
This is where a discount rate becomes essential. A discount rate accounts for the time value of money—the simple idea that a dollar today is worth more than a dollar a year from now. For private SaaS companies, this is typically set somewhere between 10-15%.
The formula gets a bit more complex, but it's worth it:
LTV = ARPA / (Churn Rate + Discount Rate)
By adding the discount rate, you ensure your LTV remains a finite, realistic number even when your churn goes negative. This is precisely the method that mature, high-growth SaaS companies use to maintain an accurate and actionable lifetime value calculation.
Using Cohort Analysis to Uncover Your Best Customers

Let’s be honest: a single, company-wide LTV number is mostly a vanity metric. Sure, it looks nice on a slide deck, but it’s hiding the real story. The most powerful insights you'll get from a lifetime value calculation saas process come from slicing up your customer base into smaller, specific groups called cohorts.
Think of it like this: a blended LTV is a blurry, wide-angle photo of your customers. Cohort analysis is like switching to a set of sharp, detailed close-ups. You start seeing the patterns and differences that were completely invisible before.
This is how you get answers to the questions that actually matter. "Which marketing channels are bringing in our most profitable customers?" or "Do users who signed up in Q1 stick around longer than those from Q4?"
Building Your Key Customer Cohorts
First things first, you need to decide how to group your users. The trick is to create cohorts that map directly to your strategic questions. You don't need to overcomplicate it with dozens of segments. Just start with the ones that will give you the biggest "aha!" moments.
For most SaaS businesses, these are the heavy hitters:
- Acquisition Channel: This is often the most revealing. Group users by how they found you—organic search, paid ads, content marketing, referrals.
- Sign-up Date: By grouping users based on the month or quarter they subscribed, you can easily see how product updates, new marketing campaigns, or even seasonality affected who you attracted.
- Initial Plan: Segmenting by the pricing tier they started on (e.g., Free, Basic, Pro) quickly tells you which plans attract and retain the highest-value customers.
Imagine you run the numbers and discover that customers from your content marketing efforts have an LTV that's 2x higher than those from paid social media ads. That insight is pure gold. It’s a clear, data-backed signal to shift your marketing budget and double down on what’s actually driving long-term value.
From Data to Decisive Action
Once you've calculated LTV for each cohort, the patterns will jump right out at you. You’re no longer operating on hunches; you're making decisions based on real customer behavior and profitability. This level of detail lets you fine-tune every part of your growth engine.
Let's say your "Pro Plan" cohort has a much better retention rate. Now you can dig in. What’s different about their onboarding? Which features do they use most? You can take those learnings and apply them to improve the journey for every other customer segment. It becomes a powerful feedback loop of insight and improvement.
Diving into these segments is non-negotiable for any SaaS business that's serious about scaling efficiently. Our complete guide on https://www.sigos.io/blog/cohort-retention-analysis offers a deeper, step-by-step walkthrough of this process. Once you've mastered this, exploring advanced customer segmentation strategies can unlock even more granular insights, turning your LTV calculation from a simple metric into a strategic tool for sustainable growth.
LTV and Customer Acquisition Cost: The Two Sides of the Growth Coin

Calculating your LTV is a huge step, but that number doesn't live in a vacuum. By itself, it’s just an interesting data point. To unlock its real power, you have to compare it to its other half: your Customer Acquisition Cost (CAC).
Putting these two metrics together gives you the LTV:CAC ratio. Honestly, this might be the single most important number for understanding if your SaaS business is built to last. It’s the fundamental math behind your entire growth engine.
Think about it this way: LTV is the total value you get from a customer, while CAC is what you spent to get them in the first place. If the value is higher than the cost, you’ve got a real business on your hands. It’s that simple, and that critical.
The Magic Ratio and Why It Matters
For as long as I can remember, the benchmark everyone in SaaS shoots for is a 3:1 LTV:CAC ratio. This isn't just some random number pulled out of thin air; it’s the sign of a healthy, efficient, and scalable business.
Let’s break down what different ratios actually mean in the real world:
- 1:1 Ratio: You’re essentially spending a dollar to make a dollar. This leaves zero room for error, operational costs, or, you know, profit. You’re just treading water.
- Below 1:1: This is a five-alarm fire. You're losing money on every single customer you bring on board. This model is a ticking time bomb unless you make some drastic changes, fast.
- 3:1 Ratio (or higher): Now we're talking. For every dollar you put into sales and marketing, you're getting three dollars back over that customer's lifetime. This is the sweet spot that signals a strong, profitable business model.
Of course, this isn't a one-size-fits-all rule. A healthy SaaS LTV:CAC ratio is generally seen as 3:1 or better, but you'll see big differences across industries. Some high-flying Adtech SaaS companies can hit a wild 7:1 ratio, which shows just how efficient their economics are. On the other hand, many Business Services platforms are perfectly healthy hovering closer to that 3:1 baseline. For a deeper look, check out these SaaS CAC ratio benchmarks for 2025 on eqvista.com.
Using the Ratio to Diagnose Your Business
Your LTV:CAC ratio is more than just a number—it’s a powerful diagnostic tool. If the ratio is low, it’s often a symptom of a problem in your acquisition strategy. Maybe you're burning cash on the wrong marketing channels or your sales team is targeting customers who aren't a good fit.
This is precisely why a solid lifetime value calculation saas model is non-negotiable. It gives you the confidence to know when to pump the brakes on spending and when to floor it.
A huge piece of this puzzle is retention. When you reduce churn, you directly increase LTV, which in turn boosts your ratio without you having to spend another dime on acquisition. To get a better handle on this, you might find our guide on the essential customer retention metrics useful. At the end of the day, building a durable, profitable company comes down to finding that perfect balance between LTV and CAC.
Common Questions About SaaS LTV Calculation
Even once you've got the formulas down, putting them into practice is where the real questions pop up. It’s one thing to know the math; it’s another to apply it to a messy, real-world customer base.
Let's walk through some of the most common sticking points I see product and growth teams run into when they start their lifetime value calculation saas analysis.
How Often Should I Calculate LTV?
For most SaaS companies, running the numbers quarterly is the right rhythm. It’s frequent enough to catch meaningful trends but not so often that you get bogged down in constant reporting. Think of it as your regular business health check-up.
However, there are times when you'll want to ramp that up to a monthly calculation. If you're in a high-growth spurt, just rolled out a major pricing change, or are dumping budget into a new acquisition campaign, you need faster feedback. Monthly LTV tracking in these moments lets you see what’s working (and what’s not) in near real-time.
What Are the Most Common Mistakes in LTV Calculation?
I see two pitfalls trip people up more than any others: using total revenue instead of gross margin, and calculating one single "blended" LTV for every customer.
The first mistake is an easy one to make, but it seriously inflates your LTV. You end up with a number that looks fantastic on paper but doesn't reflect your actual unit economics. This can lead to disastrous overspending on customer acquisition because you think you have more margin to play with than you really do.
The second mistake—completely ignoring cohort analysis—is even more dangerous. A single LTV average hides the truth. It masks the fact that customers from one marketing channel might be twice as valuable as another, or that users who adopt a certain feature stick around for years longer. You end up flying blind.
My LTV Is Low. What Are the First Steps to Improve It?
If you’re staring at a low LTV, your first and most urgent mission is to tackle churn. Everything starts with retention.
Pour your energy into improving your customer onboarding experience and beefing up your customer support. A small win here can have a massive impact. A mere 5% boost in customer retention has been shown to increase profits by 25% or more. It’s the highest-leverage activity you can focus on.
Once you’ve got a better handle on churn, turn your attention to expansion revenue. Look for every opportunity to upsell or cross-sell existing customers. Can you move them to a higher-value plan? Are there add-on features they would pay for? Pushing up your Average Revenue Per Account (ARPA) is the other key to building a much healthier LTV.
SigOS helps you identify exactly what's driving churn and what features your highest-value customers are demanding. By turning customer feedback into revenue-driving insights, our platform shows you precisely where to focus your efforts to boost LTV. Learn more by visiting our website.