Analytics for Product Managers Practical Guide
Master analytics for product managers with our guide. Learn key metrics, data strategies, and essential tools to build better products and drive growth.

As a product manager, you're constantly making high-stakes decisions about your product's future. What should you build next? Which features need improvement? Where are your users getting stuck? Analytics is how you answer these questions with confidence, swapping guesswork for hard evidence.
It’s the practice of digging into user behavior data to inform your strategy, priorities, and roadmap. It’s about understanding not just what users are doing, but uncovering the why behind their actions to build a better, more successful product.
Why Analytics Is Your Product Management Compass

Forget the vague notion that "data is important." For a product manager, analytics is your compass. Just as a ship's captain relies on charts to navigate rough seas, you use data to steer your product toward success, avoiding costly detours based on hunches alone.
A data-informed approach is what separates reactive firefighting from proactive, strategic innovation. This guide will skip the abstract theory and jump straight into the practical frameworks and real-world examples you can use tomorrow to create better user experiences and drive real business impact.
Moving From Gut Feel to Data-Informed Decisions
We've all been in meetings where the "loudest voice in the room" dictates the next move. While intuition and experience have their place, they're no substitute for objective data that can validate or invalidate your assumptions.
Instead of endlessly debating which feature to prioritize, you can pull up usage data to see where users are spending their time or, more importantly, where they're dropping off. This shift is fundamental. It helps you answer the questions that really matter:
- Is anyone actually using our new feature?
- Where are people getting stuck in our onboarding flow?
- Which types of customers are most likely to cancel their subscriptions?
The Growing Importance of Product Analytics
Leaning on data isn’t just a trend; it's a core business imperative. The explosive growth of the global product analytics market says it all. In 2024, the market was valued at an estimated USD 12.46 billion and is on track to hit USD 14.89 billion by 2025. That kind of growth is fueled by a universal need for deeper, more immediate user insights.
To stay ahead, PMs must get comfortable processing and analyzing information as it happens. Learning how to manage this flow of information is a critical skill, and you can explore this guide to Mastering Real-Time Data Analytics to build your expertise.
Ultimately, effective analytics creates a continuous feedback loop: user actions directly inform your next move, ensuring your product doesn't just launch, but evolves right alongside its users.
Translating User Actions Into Key Product Metrics

As a product manager, you have to be able to read your product's vital signs. But just tracking numbers isn't the point—you need to connect those numbers to the real stories of your users. Instead of getting bogged down in a sea of acronyms, let's focus on four core signals that tell you how healthy your product truly is.
Think of Activation, Retention, Churn, and Expansion as chapters in your user's story. They tell you if users found that initial spark of value, if they're sticking around for the long haul, why they might be leaving, and if they're growing right alongside you. Get these right, and you’ll know exactly where to focus your energy for the biggest impact.
Activation: The "Aha!" Moment
Activation is that magic moment when a new user truly gets the value your product promises. It's not about the signup; it's the specific, critical action they take that makes them think, "Aha! I see how this helps me." This is where they go from being a curious tire-kicker to an engaged user.
For a project management tool, activation isn't a login. It's when a user creates their first project and invites a teammate. For a music streaming app, it’s when a user builds their first playlist and saves it. Pinpointing and measuring this moment is everything, because it’s the bedrock of a long-term relationship. Improving activation means understanding what is behavioral analytics to see the exact steps your most successful users take.
Retention: Keeping Users Engaged
Retention is your ultimate proof that you’ve built something valuable. It measures your ability to bring users back time and time again, and it’s a direct reflection of how deeply you’ve embedded your product into their lives or workflows. High retention means you've become essential.
We usually track this in cohorts—for example, looking at the percentage of users who signed up in January and are still active in March. Think of good retention as the engine of sustainable growth. Without it, you're just pouring water into a leaky bucket, constantly scrambling to acquire new users to replace the ones you’re losing.
Churn: Understanding Why Users Leave
Churn is the flip side of retention. It’s the rate at which customers leave, whether by canceling a subscription or just going dormant. Some churn is always going to happen, but a high churn rate is a blaring alarm that something is fundamentally broken.
Digging into churn means asking some tough questions:
- Are users failing to activate? This usually points to a problem with your onboarding or the initial value you’re showing them.
- Are specific features causing frustration? Look for correlations between bug reports or support tickets and the users who churned.
- Is a competitor doing it better? Sometimes, the market shifts right under your feet.
Learning the "why" behind your churn is one of the most powerful things you can do. It turns painful losses into your most valuable lessons.
Expansion: Growing With Your Customers
Expansion, often tracked as Expansion MRR (Monthly Recurring Revenue), is all about the additional revenue you generate from your existing customers. This happens when they upgrade to a bigger plan, buy add-ons, or simply use more of your product.
This metric is a sign of a truly thriving product. It proves your most loyal customers are finding so much value that they’re willing to invest even more. For product managers, this is a clear signal of which features are home runs and where you might have opportunities to build out new premium offerings.
Below is a quick-reference table that boils these four core metrics down to their essence.
| Metric | Question It Answers | Example Measurement |
|---|---|---|
| Activation | Do new users experience the core value of the product? | % of signups that create their first project within 24 hours. |
| Retention | Are users coming back over time? | % of users from the March cohort who are still active in June. |
| Churn | At what rate are we losing customers? | % of paid subscribers who cancel their plan each month. |
| Expansion | Are existing customers increasing their spending with us? | Monthly recurring revenue from upgrades and add-ons. |
These metrics provide the narrative of your product's health, guiding you from raw data to a clear, actionable roadmap.
Understanding What Users Do and Why They Do It
Great product analytics is a bit like being a detective. You need to gather two types of clues to solve the mystery of user behavior: what people are doing in your product, and just as importantly, why they're doing it. This means you need to get comfortable with both quantitative and qualitative data.
Think of it this way: The numbers—your quantitative data—are the hard evidence. They tell you that 50% of users abandoned the signup process on the final step. That’s a critical fact, the "what." But it doesn't tell you the whole story. The qualitative data is the witness testimony—it’s the support ticket from a frustrated user saying, "I couldn't find the 'next' button because an ad was covering it." That's the "why."
Without both pieces of the puzzle, you're flying half-blind. The numbers flag the problem, but it’s the user’s own words that tell you exactly how to solve it.
Capturing Quantitative Data: The 'What'
Quantitative data is anything you can count or measure. It’s objective and comes from tracking specific user actions, often called events, inside your product. The biggest mistake product managers make here is trying to track everything. That just creates a mountain of noise. The real goal is to focus on the handful of events that show a user is getting value.
A good rule of thumb is to instrument actions that tie directly to your most important metrics.
- For Activation: Don't just track a generic
DashboardViewed. Instead, track theProjectCreatedevent. That's a much stronger signal that someone is actually trying to solve their problem with your tool. - For Retention: Instrument events that correlate with long-term stickiness, like
TeammateInvitedorReportExported. These are actions of a user who is becoming deeply embedded. - For Expansion: Keep an eye on events like
UpgradePlanClicked. This tells you how many people are actively exploring the next tier of your product.
Deciding what to track is a strategic process. For every potential event, ask yourself: "Does this action mean the user is making meaningful progress?" If so, it's probably worth tracking.
Gathering Qualitative Data: The 'Why'
Qualitative data is the story behind the numbers. It's descriptive, full of context, and gives you a feel for the user's actual experience. While your quantitative data usually lives neatly in an analytics platform, qualitative insights are often scattered all over the place.
Your job is to become a feedback magnet, pulling these scattered insights together to spot patterns. The best sources are often hiding in plain sight:
- Support Tickets: Platforms like Zendesk or Intercom are treasure troves of user frustrations and feature requests.
- Sales Call Transcripts: Tools that record and transcribe sales calls can show you what gets prospects excited and what objections repeatedly surface.
- User Interviews: There's no substitute for a direct conversation. It's the only way to ask "why?" five times and get to the root of a problem.
- App Store Reviews and Social Media: These public channels give you raw, unfiltered feedback on what users love and what they absolutely can't stand.
By tagging and organizing this feedback, you can connect a spike in support tickets about a specific issue to a drop-off you see in a funnel. This goes beyond just reacting to problems. Analyzing support ticket trends, for instance, can help you build powerful predictive models, as detailed in this guide to predicting customer churn. By weaving both data types together, you turn a confusing mess of information into a clear story that shows you exactly what to build next.
Turning Raw Data Into Actionable Product Insights

Collecting data is just step one. Staring at raw numbers on a dashboard is like having a pantry full of ingredients but no recipe—the potential is there, but you need to know how to combine them to create something meaningful. The real skill for any product manager is spinning that raw data into a clear story that points you toward your next move.
To get there, you need a few core analysis methods in your back pocket. Think of them as different lenses, each designed to bring a specific part of the user journey into focus. By learning how and when to use them, you can go from just reporting what happened to truly understanding why it happened—and what you should do next.
Slicing the Data With Segmentation
The most fundamental technique is segmentation. This is simply the practice of breaking down your user base into smaller, more manageable groups based on who they are or what they do. Instead of seeing your users as one giant, faceless mob, segmentation helps you spot the distinct "tribes" within your product.
Imagine you're running an e-commerce app. Your overall conversion rate is a useful number, but it hides the far more interesting stories underneath. Segmentation lets you ask much sharper questions:
- How does the conversion rate of first-time visitors compare to that of returning customers?
- Do users who click a social media ad behave differently than those who arrive from an email campaign?
- Are mobile users converting at the same rate as desktop users?
Comparing these segments is where the magic happens. You might find that new visitors are bailing before they buy, which tells you to go fix your landing page. Or maybe your "power users"—those who have made over five purchases—are wildly profitable, justifying new loyalty features built just for them.
Mapping the User Journey With Funnel Analysis
While segmentation tells you who is doing what, funnel analysis shows you where they're getting stuck. A funnel is just the series of steps a person takes to do something important in your product, like signing up, completing their profile, or making a purchase.
For that same e-commerce app, a typical checkout funnel might look like this:
- User adds an item to their cart.
- User proceeds to checkout.
- User enters shipping information.
- User enters payment information.
- User confirms the purchase.
Funnel analysis reveals the drop-off rate between each step. If you see that 80% of users who enter shipping details never even make it to the payment screen, you've just pinpointed a massive point of friction. That’s your signal to investigate that page for bugs, a confusing design, or missing information.
Tracking Behavior Over Time With Cohort Analysis
Finally, there’s cohort analysis. A cohort is a group of users who share a common starting point, like everyone who signed up in March. By tracking these groups over time, you can get a true read on long-term engagement and retention.
This method helps you see past misleading "snapshot" metrics. Your daily active user count might look steady, but a cohort chart could reveal you're losing old users just as fast as you're acquiring new ones—the classic "leaky bucket" problem. To learn more about bringing this kind of data to life, check out our guide on the best practices for data visualization.
Each of these analysis methods helps answer different kinds of product questions. Understanding which one to use is key to finding the right insights.
Common Analysis Methods for Product Managers
| Analysis Method | Primary Use Case | Example Question Answered |
|---|---|---|
| Segmentation | Understanding who your users are and how different groups behave. | "Do mobile users from our latest marketing campaign convert better than desktop users?" |
| Funnel Analysis | Identifying friction and drop-off points in a key user workflow. | "Where in our five-step signup process are most new users giving up?" |
| Cohort Analysis | Measuring user retention and the long-term impact of product changes. | "Did the onboarding improvements we shipped in May lead to better Week 4 retention?" |
Mastering these three approaches will give you a solid foundation for turning your product data into a strategic advantage.
And these powerful tools are becoming more accessible every day. While large enterprises accounted for over 60% of product analytics revenue in 2021, small and medium-sized businesses are catching up, with a projected growth rate of 25.6% from 2022 to 2031. This trend makes it clear: data-driven product management is no longer a luxury but a core competency for companies of all sizes. You can dive deeper into these trends by exploring the latest product analytics market research.
Using Analytics to Build a Winning Product Roadmap
Gathering insights is only half the battle. Honestly, the most brilliant analysis in the world is useless if it just sits in a dashboard instead of shaping what you build next. This is where your hard-won insights become action, directly influencing your product roadmap and bringing some much-needed clarity to your prioritization process. Great analytics for product managers isn't just about finding problems—it's about building an undeniable, evidence-based case for why they need to be solved.
Instead of defending your roadmap with gut feelings, you can prove its value with cold, hard data. This simple shift is powerful. You go from saying, "I think we should build this," to "The data shows that improving this one flow will increase activation by 15%." To make this a habit, you need a few practical frameworks to embed this data-first mindset directly into your planning.
From Insight to Impact Scoring
One of the most effective ways to bridge the gap between analytics and your roadmap is through impact scoring. It’s a simple concept that forces you to translate a potential feature or fix into a measurable outcome. For every item you're considering, you have to ask: how will this move a key metric we're already tracking?
This completely changes the conversation around what to build next. The focus shifts from opinion to a testable hypothesis.
- Weak argument: "I think users would really like a new dashboard widget."
- Strong argument: "Our funnel analysis shows a 40% drop-off when users try to find their project summary. Building a dedicated widget is projected to cut that drop-off in half, which will directly improve user retention."
By attaching a potential metric improvement to each initiative, you create a common language for the entire team and your stakeholders. It's no longer about which idea sounds the coolest; it's about which initiative is most likely to actually move the needle on what matters to the business.
Connecting Product Usage to Revenue
Ultimately, the goal is to draw a straight line from product decisions to business outcomes. Revenue correlation is all about linking specific user behaviors to financial results. When you dig into your data, you can pinpoint the "aha!" moments or feature adoption patterns that are most common among your highest-value customers.
Imagine you discover that customers who invite three or more teammates within their first week have a 75% higher lifetime value (LTV). That single insight is pure gold. It gives the product team a clear mandate: do everything in your power to get new users to invite three teammates. An insight like that can spawn an entire stream of roadmap initiatives, from in-app prompts and email campaigns to a completely redesigned invitation flow.
By quantifying the dollar value of specific user actions, you stop guessing what drives growth and start engineering it. This turns your product roadmap into a strategic tool for increasing revenue, not just a list of features.
This approach also helps justify the less "glamorous" work, like fixing bugs or paying down technical debt. If you're looking for a more structured way to plan this out, you can find a helpful technical roadmap template that integrates these data-driven principles into your long-term strategy.
A Practical Scenario: Building a Case with Data
Let's walk through a real-world example. A product manager for a SaaS collaboration tool notices that their trial-to-paid conversion rate has been stuck for months, hovering around a disappointing 4%.
- Start with a Question: The PM doesn't just stare at the number. She starts with a clear question: "Where is the biggest point of friction in our onboarding that’s stopping trial users from converting?"
- Analyze the Funnel: She pulls up their analytics tool and maps out the key steps a new user takes: Sign Up > Create First Project > Invite a Teammate > Connect Integration > Upgrade to Paid. The data immediately points to a massive leak in the funnel: 70% of users who create their first project never get past the "Invite a Teammate" step.
- Dig for the 'Why': The quantitative data identified the what, but now she needs the why. She segments the users who dropped off and starts reviewing their session replays and recent support tickets. A clear pattern emerges. Users are confused by the team invitation screen's UI and think it’s a mandatory step, so they just click away.
- Formulate a Hypothesis: Armed with both quantitative and qualitative insight, she forms a data-backed hypothesis: "By redesigning the team invitation screen to be clearer and offering a 'skip for now' option, we can increase the percentage of users who complete this step from 30% to 50%, which we believe will lead to a higher overall conversion rate."
- Build the Business Case: She presents her findings not as an opinion, but as a story backed by evidence. She shows the funnel data, quotes from actual support tickets, and a clear projection of the business impact. The case is now undeniable, and the onboarding fix gets prioritized for the very next development cycle.
Choosing and Integrating Your Product Analytics Tools
Let's be honest: your insights are only as good as the tools you're using to find them. While a single analytics platform is a great place to start, the real magic happens when you build a product analytics stack. Think of it as an interconnected ecosystem of tools designed to give you a complete, panoramic view of the user journey. The goal is to see everything in one place.
Picture this: a customer files a frustrated support ticket about a billing error. If your tools are siloed, that's just a problem for the support team. But with an integrated stack, you can instantly see that ticket alongside the user’s entire history—their recent in-app behavior, their lifetime value pulled from the CRM, and even a session replay of the exact moment they hit a wall. Suddenly, it’s not just a support ticket; it’s a product insight.
Building Your Integrated Analytics Stack
A powerful analytics stack doesn't just tell you what users are doing; it helps you understand why. No single tool can do it all, which is why smart integrations are no longer a "nice-to-have" for product managers—they're essential. A well-rounded stack typically connects a few key systems:
- Core Analytics Platform: This is your source of truth for quantitative data. Tools like Mixpanel or Amplitude are brilliant for tracking events, building funnels, and analyzing cohorts.
- Customer Relationship Manager (CRM): Your CRM, like Salesforce, holds all the business context—account size, subscription tier, and key sales notes.
- Support Desk Software: Platforms such as Zendesk or Intercom are qualitative goldmines. They capture your users' biggest frustrations in their own words.
- Session Replay Tools: With a tool like FullStory, you can watch video-like recordings of user sessions to pinpoint the exact source of friction.
When you connect these tools, you create a powerful feedback loop. For example, piping support tickets into your analytics platform lets you segment users by the issues they report. This helps you answer critical questions fast, like, "Do users who complain about Bug X churn at a higher rate than everyone else?"
From Disconnected Data to a Single Customer View
The ultimate prize of building an integrated stack is achieving a single customer view. Instead of seeing a user as a collection of disconnected data points, you can trace their entire story—from the first marketing campaign that brought them in, through their onboarding flow, to their most recent feature request. That 360-degree context is priceless.
By connecting disparate data sources, you move from isolated metrics to a holistic narrative. You can finally correlate product usage directly with revenue, support costs, and customer satisfaction, turning your analytics into a strategic business driver.
This is how you close the loop between analysis and action, creating a direct line from raw user behavior to confident roadmap decisions.
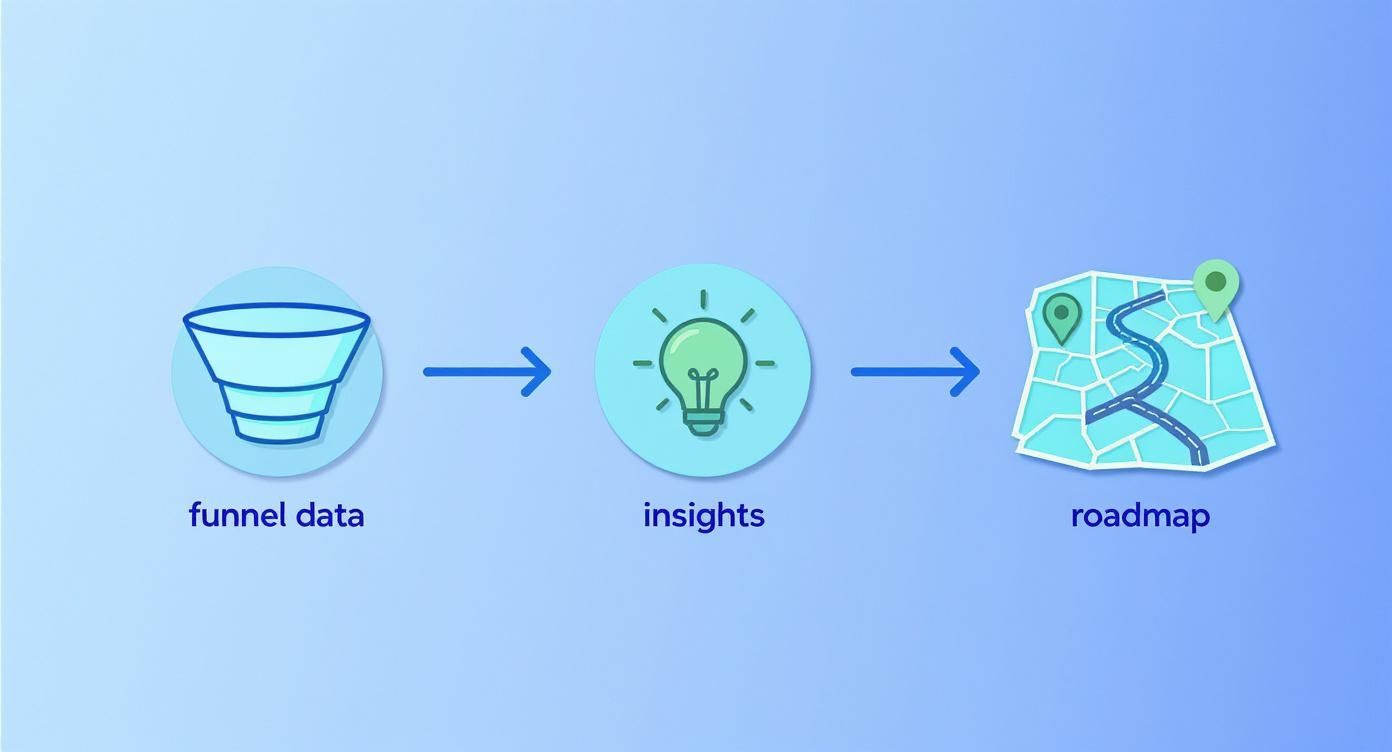
As the diagram shows, it’s a cycle: raw data from funnels gets refined into strategic insights, which in turn directly inform what you build next.
Common Product Analytics Questions Answered
Diving into product analytics can feel like you've been asked to learn a new language overnight. You know it’s critical, but that initial learning curve feels steep, and it's easy to get overwhelmed. It’s completely normal to have a ton of questions about where to start, how to deal with messy data, and what on earth to focus on first.
Let's walk through a few of the most common hurdles I've seen product managers face. The goal here isn't to give you a textbook answer, but a practical starting point so you can build momentum and start making data-backed decisions with confidence.
Where Do I Even Start Tracking?
The fear of tracking the wrong thing often paralyzes teams into tracking nothing at all. My advice? Don't try to boil the ocean. You don't need to instrument every single click, hover, and interaction right out of the gate.
Instead, zero in on the single most important journey a user takes to experience your product's core value—that "aha!" moment. This is almost always your activation flow.
- Step 1: Pinpoint the 3-5 essential actions a new user absolutely must take to get hooked.
- Step 2: Make those your very first tracking events. Nothing more.
- Step 3: Set up a dead-simple funnel to visualize where people are getting stuck.
This tight focus gives you an immediate, high-impact area to analyze and improve. You'll get quick wins that prove the value of analytics to your team and build a foundation to expand on later.
What If Our Data Is a Mess?
I’ll let you in on a secret: everyone’s data is a mess. I've yet to meet a team with "perfect" data. Waiting for pristine tracking before you start your analysis is a trap.
The reality is that you'll always have gaps, weird inconsistencies, or bugs in your tracking. The trick is to acknowledge the mess and work with what you've got.
Don’t let the pursuit of perfect data become the enemy of good-enough insights. Start with the data you have the most confidence in, document the known quirks, and build your analysis from there.
Even in a messy dataset, you can usually find reliable signals. As you start using that data to inform real decisions, you’ll naturally build a much stronger case for investing time and resources into better data governance down the road.
SigOS helps you find the most critical signals in your customer feedback, even when it's messy. By connecting support tickets, call transcripts, and usage data, our AI platform identifies the patterns that directly correlate with churn and revenue, so you can stop guessing and start prioritizing what truly matters. Explore how SigOS can clean up your insights at https://sigos.io.
Keep Reading
More insights from our blog


Ready to find your hidden revenue leaks?
Start analyzing your customer feedback and discover insights that drive revenue.
Start Free Trial →