Analyze Customer Feedback to Unlock Revenue Growth
Learn to analyze customer feedback from support tickets, calls, and product data to uncover insights that drive revenue and boost customer retention.

To get real value from customer feedback, you have to move past simply collecting it. The goal is to turn all that raw, qualitative data from support tickets, chats, and calls into something you can actually measure—insights that speak in terms of revenue.
This means building a system that can connect a specific customer complaint directly to its potential impact on churn or its opportunity for expansion. When you do that, feedback stops being a support metric and becomes a powerful input for your product roadmap and revenue strategy.
Why Analyzing Customer Feedback Is a Revenue Imperative
Most companies are practically swimming in customer feedback. Data floods in from Zendesk, Intercom, Gong, and a dozen other channels, but it often ends up as a chaotic mess of conversations. For too long, the standard approach has been to treat this as a customer support task—something to tag, categorize, and maybe look at in a spreadsheet once a quarter. That just doesn't cut it anymore.
The real challenge isn't a lack of data; it's the failure to spot the predictive signals buried within it. Every single conversation holds clues about why customers stick around, why they upgrade, or why they leave. When all that rich information sits siloed and unanalyzed, it's a massive missed opportunity. Your product, success, and growth teams are left guessing, making critical decisions based on gut feelings instead of hard evidence of what your customers actually want and need.
From Cost Center to Growth Engine
When you fundamentally change how you analyze feedback, you shift it from a reactive cost center to a proactive growth engine for the entire business. It's about creating a system that doesn't just collect comments but actively flags insights that can predict business outcomes.
It all comes down to connecting specific customer issues to real dollar values. Imagine being able to:
- Pinpoint a recurring bug that’s putting $50,000 in monthly recurring revenue (MRR) at risk.
- Identify a feature request that keeps popping up with enterprise prospects, which could unlock six-figure expansion deals.
- Detect subtle shifts in customer language that signal a high-value account is about to churn.
This data-first approach gives you the "why" behind your KPIs. Without it, you’re flying blind. This isn't just a theory; it's reflected in the data. Forrester's 2025 Global Customer Experience Index found that a staggering 21% of brands saw their CX rankings decline, while only 6% improved. The report makes it clear: unprioritized feedback directly erodes loyalty and drives customers away, a trend tech companies can't afford to ignore. You can learn more from Forrester's latest CX findings.
The goal is to create an undeniable link between customer conversations and financial results. When a product manager can say, "We need to fix this because it's costing us $12,000 a month," roadmap debates end and impactful work begins.
For deeper dives into customer communication strategies and feedback analysis, you may find valuable resources on the illumichat blog for further insights. This guide will give you the playbook to build that connection.
Unifying Your Feedback Data Streams
Let's be honest, customer feedback isn't neatly packaged for us. It’s scattered everywhere—support tickets in Zendesk, sales call notes in Gong, live chats from Intercom, and even lurking in product usage logs. If you leave that information siloed, you’re trying to solve a puzzle with half the pieces missing.
The first real step is pulling it all together into a single source of truth. This isn't just about creating a data lake; it’s about building a clean, structured asset. Your mission is to pipe every customer interaction into one central hub where you can actually make sense of it. This foundational work is what turns a chaotic mess of conversations into an analyzable dataset.
Structuring and Enriching Raw Data
Once your data is flowing into one place, the real fun begins. A raw transcript from a support call or an email is just a wall of text. It has no context. This is where you need to get smart with technology, particularly Natural Language Processing (NLP). A good NLP model can automatically read through thousands of interactions and pull out key themes, sentiment, and user intent, saving your team from an impossible amount of manual tagging.
But text analysis alone isn't enough. The magic happens when you enrich that feedback with business-critical metadata. For every single comment, you should be able to answer questions like:
- Who is this customer? Are they a small business or a massive enterprise?
- What plan are they on? Are they a freemium user or on your top-tier plan?
- How healthy is their account? Are they at risk of churning?
- What's their revenue impact? What is their MRR or ARR?
Suddenly, a vague feature request isn't just a request—it's from a high-value customer on a $50,000 ARR plan whose renewal is coming up. This is how you connect qualitative feedback to real, quantitative business outcomes. If you're looking to dive deeper into the technical side, these customer data integration best practices are a great starting point for a smoother process.
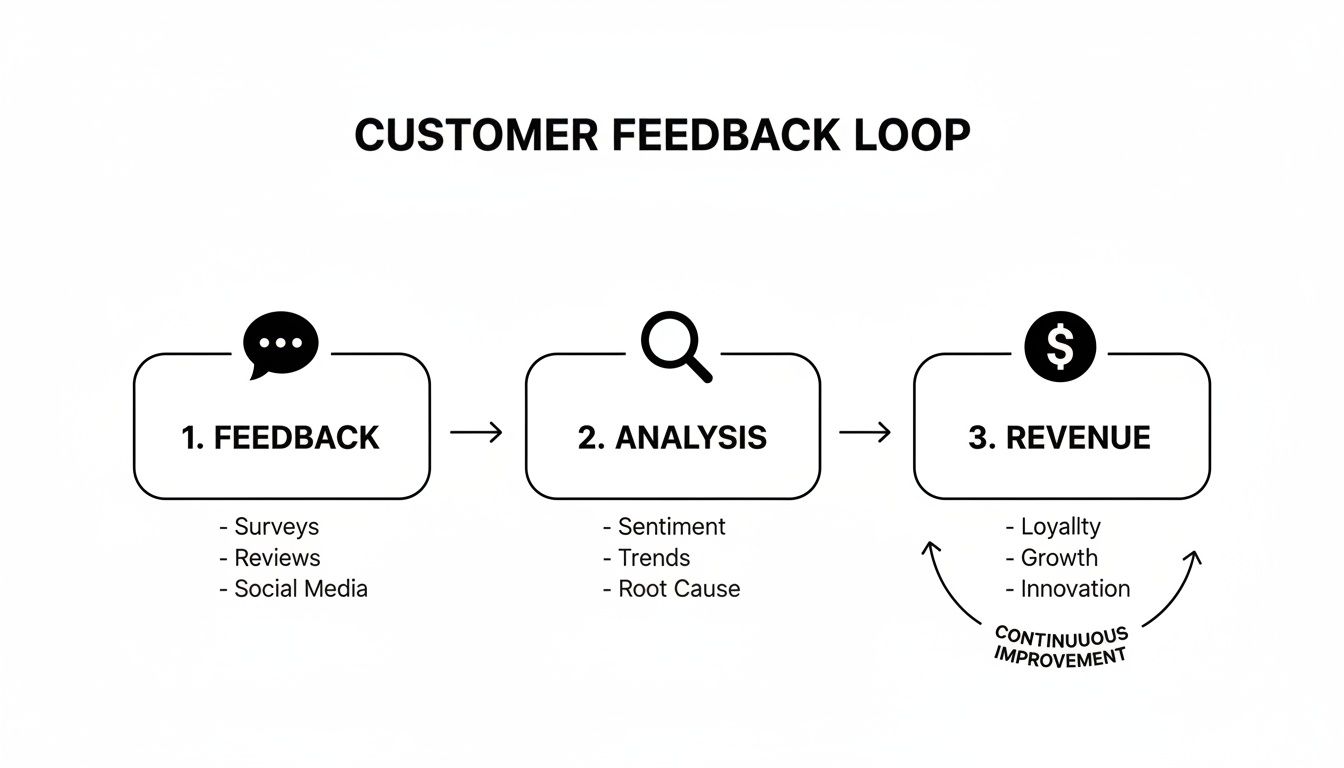
This simple loop illustrates a powerful truth: analysis is the bridge that turns customer voice into measurable revenue impact.
Before you can spot patterns, you need to understand the unique characteristics of each feedback channel and apply the right enrichment techniques.
Key Customer Feedback Sources and Enrichment Methods
| Data Source | Data Type | Key Information | Enrichment Method |
|---|---|---|---|
| Support Tickets (e.g., Zendesk, Jira) | Unstructured Text | Bug reports, feature requests, usability issues | NLP for topic/sentiment, metadata (ticket priority, agent notes) |
| Sales/CSM Calls (e.g., Gong, Chorus) | Audio/Transcripts | Objections, competitor mentions, expansion opportunities | Speaker diarization, NLP for intent/theme detection |
| Surveys (e.g., NPS, CSAT) | Structured & Unstructured | Quantitative scores, qualitative comments | Sentiment analysis on open-ended feedback, correlation with scores |
| Live Chat (e.g., Intercom, Drift) | Unstructured Text | Pre-sale questions, onboarding friction, quick support queries | Real-time intent recognition, user journey mapping |
| Product Usage Data (e.g., Pendo, Amplitude) | Behavioral | Feature adoption rates, drop-off points, user paths | Correlate behavioral cohorts with qualitative feedback themes |
Each of these sources tells a different part of the story. By applying the right enrichment method, you ensure you're getting a complete, multi-dimensional view of the customer experience.
By enriching each piece of feedback with business context, you move beyond simple categorization. You build a dynamic asset that allows you to ask powerful questions, like "What are the top three issues reported by customers with over $100k in ARR?"
This unified and enriched data stream becomes the engine for everything that comes next. Without it, you’re just guessing. With it, you're on your way to a clear, data-driven understanding of what truly matters to your customers.
Finding the Signals That Predict Business Outcomes

Once your customer feedback is unified and enriched, the real work begins. You can finally stop guessing what matters and start pinpointing the signals that actually move the needle. This is the pivot from just organizing feedback to using it to predict what’s coming next, whether that’s a wave of churn or a massive expansion opportunity.
It all starts with thematic clustering, a fancy term for automatically grouping related feedback. Instead of someone manually tagging every single mention of a "confusing checkout flow," intelligent systems can spot these patterns and lump them all together. This immediately shows you the true volume and sentiment around specific topics, giving you a clear-eyed view of your biggest problems.
Spotting Trends Before They Escalate
The real power of analyzing feedback continuously is trend detection. By keeping an eye on how often these thematic clusters pop up over time, you can catch emerging issues long before they become five-alarm fires.
Imagine you see a small but steadily growing cluster of comments about a new integration’s slow performance. This is your early warning. It gives your product team a chance to jump in and fix the problem while it’s only affecting a handful of users, not after it’s already lit up your support channels and tanked customer satisfaction. This is what separates proactive, data-informed product teams from the rest.
The magic isn't just in grouping feedback; it's in understanding the velocity of a problem. A sudden surge in complaints about a specific feature is a clear signal that something is broken and needs immediate attention.
Being proactive has never been more important. Recent research reveals a worrying gap: while customer satisfaction seems stable, core loyalty metrics like trust and the likelihood to buy again are slipping. And with 86% of customers ready to walk away after just two bad experiences, using data to find those hidden churn signals is absolutely critical. You can explore the full findings on customer loyalty from Qualtrics to see the data for yourself.
Connecting Feedback to Churn and Expansion
The most impactful part of this process is correlation analysis. This is where you draw a direct line between what customers are saying and what they’re actually doing. You’re no longer operating on hunches; you’re asking sharp questions and getting definitive, data-backed answers.
Let’s look at how this plays out in the real world:
- Pinpointing Churn Drivers: You might analyze the feedback from every account that churned last quarter. Suddenly, a pattern emerges: 70% of them mentioned "reporting limitations" in support tickets in the 90 days before they left. That's not a guess—it's a clear signal that your reporting feature is costing you revenue.
- Identifying Expansion Signals: On the flip side, you could discover that enterprise customers who bring up "API access" or "SSO integration" are three times more likely to upgrade their plan within six months. Just like that, your feedback data becomes a powerful lead source for your sales and customer success teams.
By connecting feedback themes to customer segments, MRR, and product usage data, you turn qualitative comments into powerful predictive tools. It allows you to pour your resources into the problems and opportunities that will make a measurable difference to your bottom line. If you're looking for platforms to help with this, this guide on the best predictive analytics software is a great place to start.
Prioritizing Your Roadmap with Revenue Impact

Alright, you've sifted through the noise and found the real signals in your customer feedback. Now what? It's time to put that insight to work and finally end those subjective roadmap debates. You know the ones—where the loudest voice in the room or a senior leader's gut feeling dictates engineering priorities.
This is where a data-driven framework comes in. By quantifying the potential value of every bug fix and feature request, you can turn prioritization into an exercise in clear-eyed business logic. The key is impact scoring, a method for assigning a potential dollar value to every single piece of feedback. It transforms vague complaints and nice-to-have suggestions into solid business cases that everyone, from your engineers to the C-suite, can immediately grasp.
Tying Every Issue to a Dollar Value
The most direct way to get started is to connect feedback right to your Monthly Recurring Revenue (MRR). From now on, when a bug report lands on your desk, don't just log the technical details. Log the MRR of every single customer affected by it.
Suddenly, you have a powerful financial metric.
A minor UI glitch might be irritating, but if it only impacts a few small accounts, its total weight might be just 500 in MRR. On the other hand, a critical data export failure blocking ten of your enterprise clients could represent ****75,000 in at-risk MRR. That single number makes it crystal clear which fire you need to put out first.
This same logic works wonders for feature requests. You can score them by looking at:
- Expansion MRR: Add up the potential contract value from existing customers who’ve told you they’d upgrade if you built a specific feature.
- New Business Pipeline: Tag requests that are known blockers for prospects your sales team is talking to. This quantifies the new revenue you could unlock by building it.
Attaching real revenue figures to tickets and requests completely changes the conversation. It shifts from a subjective "What should we build?" to a strategic "Which of these initiatives will protect the most revenue or drive the most growth?"
Building a Practical Prioritization Matrix
Once you have revenue data attached to your feedback, you can build a simple but incredibly effective prioritization matrix. This is all about balancing the financial upside of a task against the effort it'll take to get it done. The sweet spot is always finding those high-impact, low-effort wins.
A solid matrix really only needs to weigh three things:
- Revenue Impact: The total MRR at risk or the potential new revenue on the table.
- Development Effort: An estimate from your engineering team, whether it’s t-shirt sizes (S, M, L) or story points.
- Strategic Alignment: A quick check on how well the task fits with your company's bigger quarterly or annual goals.
This system gives you a clear, defensible logic behind every decision. Your roadmap stops being a wish list and becomes a strategic asset that’s directly tied to financial results. For a more structured way to lay this all out, this technical roadmap template is a fantastic guide for organizing your priorities.
Closing the Loop with Automated Workflows
All the analysis in the world means nothing if the insights just sit in a dashboard. The real magic happens when you turn that data into action, and that's where automated workflows come in. This is how you stop your analysis from being a one-off project and start making it a core, continuous part of how you build your product.
The goal here is simple: close the loop automatically.
Think about it. A high-priority bug, flagged because it’s impacting $20,000 in MRR, should immediately and automatically create a ticket in a tool like Jira or Linear. But this isn't just some blank ticket. It should arrive pre-loaded with everything an engineer needs: direct customer quotes, the calculated revenue impact, and a link right back to the raw feedback.
From Insight to Action in Seconds
This automated handoff completely changes the game. It gets rid of the friction and the endless back-and-forth between product, customer success, and engineering teams. The business case is already made and delivered right into the development team's workflow.
This isn't just about moving faster; it's about meeting customer expectations head-on. A recent Zendesk study found that 72% of customers want instant service, and fast resolutions make them 2.4x more likely to stick around. When you automatically create tickets from prioritized feedback, you're directly addressing that need for speed and preventing churn before it can even start.
The real power here is making the right action the easiest action. By embedding revenue-focused data directly into the development process, you ensure your teams are always working on what truly matters most.
Real-Time Alerts for Proactive Management
Beyond just creating tickets, you can set up real-time alerts that function as an early-warning system for your team.
Imagine setting a rule that pings a specific Slack channel the moment a new theme related to churn risk starts trending. This is a game-changer.
Instead of waiting for the next quarterly business review to find out customers hate a new feature, your product manager gets an alert within minutes of the pattern emerging. They can jump on it, investigate, and escalate the issue long before it starts damaging customer trust or hitting your retention numbers.
For a deeper dive into streamlining these kinds of processes, gaining an understanding of workflow automation is invaluable. It’s the final, crucial step to make sure you don't just analyze feedback—you act on it, decisively and immediately.
Common Questions About Customer Feedback Analysis
So, you're ready to get serious about analyzing customer feedback. That's a huge step. But it's natural to have a few nagging questions before you dive in. It's one thing to see a neat framework on a slide, but it's another thing entirely to deal with the messy reality of data scattered across a dozen systems and teams who are skeptical of yet another tool.
Let's walk through the most common hurdles I see teams run into and how to get past them.
How Do We Start If Our Feedback Is Scattered Everywhere?
This is usually the first big question, and it's a showstopper for many. When feedback lives in ten different places—Zendesk, Salesforce, Gong calls, NPS surveys, Slack channels—where on earth do you even begin?
The trick is to avoid boiling the ocean. Seriously. Trying to integrate every single data source on day one is the fastest way to get a project stuck in limbo for months.
Instead, start small and smart. First, do a quick 'feedback audit.' Just map out all the places feedback currently lives. Once you have that map, pick just one channel to start with. The best candidate is almost always your highest-volume, highest-value source. For most B2B SaaS companies, that’s the customer support system.
Connect that one source first, ideally using a platform with pre-built integrations to make it easy. When you can show tangible insights from analyzing just your support tickets, you build a powerful case for adding more channels down the road. The goal here is steady, incremental progress, not a massive, all-at-once integration nightmare.
How Can We Prove the ROI of Investing in These Tools?
Getting a budget for a new tool always comes down to proving its return on investment (ROI). This is where you connect feedback directly to dollars and cents—and it's your new superpower. To build a business case that resonates with leadership, you have to speak their language.
The most effective way to prove ROI is to stop talking about "feedback themes" and start talking about "revenue at risk." When you can show that a single bug is impacting $10,000 in MRR, the investment in a tool to find that insight becomes a simple calculation.
Before you roll out any new system, take a snapshot of your key metrics:
- Customer Churn Rate: What percentage of customers are you losing over a given period?
- Expansion Revenue: How much additional revenue are you getting from existing customers?
- Support Ticket Volume: How many tickets are you getting for the same recurring, known issues?
Once your new feedback analysis process is running, track these same numbers. When you can draw a straight line between your work and the results—for instance, "After we fixed the top three issues our analysis flagged, churn in that customer segment dropped by 15%"—the ROI becomes undeniable.
Can We Trust AI Analysis with Sensitive Customer Data?
Handing over raw customer conversations to an AI system is a big deal, and it's right to be cautious. Trust is non-negotiable.
When you're looking at any platform, security has to be front and center. Look for vendors who are serious about data protection, with things like end-to-end encryption and compliance with standards like SOC 2.
There's one critical question you absolutely must ask any potential partner: "Do you retrain your global AI models on our company's data?"
The answer must be no.
Your customer data should be completely ring-fenced and used only to generate your insights. With these safeguards in place, a reputable AI system can be a secure and incredibly powerful co-pilot for your teams, not a security risk.
Ready to turn your customer conversations into your most valuable asset? SigOS uses AI to connect feedback directly to revenue impact, helping you prioritize your roadmap with confidence. Discover how SigOS can help you build better products.


Ready to find your hidden revenue leaks?
Start analyzing your customer feedback and discover insights that drive revenue.
Start Free Trial →