Calculating Customer Lifetime Value SaaS Explained
A practical guide to calculating customer lifetime value SaaS. Learn the right formulas, data gathering, and how to use CLV to drive real growth.
For any SaaS business, figuring out your Customer Lifetime Value (CLV) is about more than just number-crunching. It's about predicting the total revenue you can expect from a single customer over their entire relationship with you. Think of it as a strategic compass, pointing you toward long-term profitability and sustainable growth, not just one-off sales.
Why Mastering SaaS CLV Is Your Growth Compass
Let's ditch the textbook definition for a moment. In the real world of SaaS, CLV is your forward-looking guide for almost every major decision you make. It's what tells you how much you can really afford to spend on marketing, which features to build next, and where to invest in customer support.
A solid grasp of CLV gives you the confidence to justify your customer acquisition costs (CAC). It’s the key to balancing the pressure of hitting quarterly numbers with the need to build a truly profitable business for the long haul. By identifying your most valuable customer segments, you can stop guessing and start focusing your resources where they’ll actually make a difference.
Moving Beyond Simple Metrics
One of the biggest mistakes I see is treating CLV as just another number on a dashboard. It’s not. It's a direct reflection of your company's health and the strength of your customer relationships.
It helps you answer the tough but essential questions:
- How much can we really spend to bring in a new customer and still be profitable?
- Which types of customers are our best bet for long-term revenue?
- Are our retention strategies actually paying off?
This is why CLV isn't owned by just one team. It's a composite metric that pulls from sales, marketing, product, and customer support. Everyone has a hand in it.
The data backs this up. As of 2025, companies that use predictive analytics for CLV have seen their customer retention rates jump by 15-20%. Even more impressive, the top-tier SaaS companies that truly master CLV optimization are seeing up to 40% higher profitability than their competitors. Discover more insights about mastering CLV in SaaS on sparkco.ai.
Gathering the Right Data for an Accurate CLV
Before you even think about plugging numbers into a formula, you need to put on your data detective hat. A truly accurate Customer Lifetime Value calculation isn't about fancy math; it's built on a foundation of clean, reliable data. Without it, you're just making educated guesses that could send your entire strategy down the wrong path.

The whole process starts with knowing exactly which metrics matter and, just as importantly, where to find them. Chances are, your existing tools are already goldmines of this information—you just have to know where to dig.
Core Metrics and Where to Find Them
Most of the key ingredients for a solid CLV calculation are probably sitting right inside your current tech stack. The real challenge isn't about generating brand-new data; it's about pulling the right numbers and organizing them in a consistent way.
You can usually find what you need in these places:
- Average Revenue Per Account (ARPA): Your payment processor like Stripe or a subscription management platform like ChartMogul is the go-to source here. You're looking for reports that calculate your monthly recurring revenue (MRR) divided by your total number of active customers.
- Customer Churn Rate: This one is absolutely critical. It's also vital to differentiate between customer churn (losing a customer account) and revenue churn (losing MRR). Your subscription or analytics tool should have this data. If you need a refresher, this guide on how to calculate churn rate is a great resource.
- Gross Margin: For this, you'll need to sync up with your finance team or check your accounting software (think QuickBooks). It’s your total revenue minus the cost of goods sold (COGS). For a SaaS business, COGS typically includes things like server hosting, customer support tools, and other third-party software costs.
Establishing Data Integrity
Once you know where your data lives, the next job is to make sure it's trustworthy. Inconsistent definitions can throw your entire calculation off. For example, does your marketing team define an "active customer" the same way your product team does? Probably not.
To sidestep these issues, you need a single source of truth for every metric. This means creating clear, documented definitions that everyone in the company buys into. Bringing all this disparate information together is a huge step, so it’s worth reviewing some customer data integration best practices.
This might feel like a lot of tedious setup work, but trust me, it pays off big time. By creating a repeatable process for data collection, you turn CLV from a painful quarterly fire drill into a dependable, automated part of your operational rhythm. That consistency is what allows you to actually trust the numbers and make confident decisions for the future.
Picking the Right CLV Formula for Your Business
When it comes to SaaS, there’s no single, perfect CLV formula. Grabbing a one-size-fits-all equation off the shelf can seriously backfire, sending your strategy down the wrong path with misleading data. The trick is to match the formula to your company's stage and complexity.

If you're a startup, speed and a general sense of direction are far more valuable than decimal-point precision. A simple formula works wonders for a quick gut check. But as you grow, the demand for a more sophisticated and accurate calculation becomes impossible to ignore.
For a Quick Benchmark: The Simple CLV Formula
When you're first dipping your toes into the world of calculating customer lifetime value saas, the simple CLV formula is your best friend. It’s incredibly straightforward, doesn't require a deep dive into your financials, and gives you a solid directional metric to work with.
Here’s the basic recipe: CLV = Average Revenue Per Account (ARPA) / Customer Churn Rate
This approach gives you a quick snapshot of customer value based entirely on revenue and retention. It's the perfect starting point for understanding your basic unit economics.
Let’s imagine a project management tool, "TaskFlow," using this formula:
- Their ARPA is $75 per month.
- They lose 3% of their customers monthly (Monthly Customer Churn Rate).
Plugging those numbers in, their CLV is 75 / 0.03, which equals ****2,500. This tells the TaskFlow team that they can expect, on average, to bank $2,500 from each customer before they cancel.
Leveling Up to a More Accurate, Predictive Model
Once your business starts to mature, relying on a purely revenue-based CLV can be a bit dangerous. You need to shift your focus to the profitability of your customers, not just the money they bring in. This is where a more advanced, predictive formula that factors in your gross margin becomes non-negotiable.
This model is a must-have for any business that:
- Has significant service delivery costs (think data storage, third-party API fees).
- Needs precise LTV:CAC ratios to fine-tune marketing spend.
- Is lucky enough to experience negative churn, where expansion revenue outpaces churn.
The standard, more precise SaaS LTV formula is: LTV = (ARPU × Gross Margin %) / Churn Rate. To see it in action, picture a company with an ARPU of 50, a 70% gross margin, and a 4% monthly churn rate. Their LTV would be (50 × 0.70) / 0.04, which comes out to $875.
This model gives you a much truer picture of a customer's actual value. To make sure you’re on the right track, it helps to dive into resources that offer a complete breakdown of the customer lifetime value formula explained.
It fundamentally changes the question from "How much revenue will a customer generate?" to "How much profit will a customer contribute?" That subtle shift is everything when it comes to making smart, sustainable decisions. While no predictive model is a crystal ball, adding profitability to the mix elevates your CLV from a rough estimate to a powerful strategic tool.
Putting It All Together: A Real-World SaaS CLV Example
Formulas on a whiteboard are one thing, but seeing how they work with real numbers is where the magic happens. Let's walk through an example with a fictional SaaS company I'll call "SyncUp" to show you how calculating customer lifetime value for SaaS plays out and, more importantly, why you absolutely must segment your data.
SyncUp has two main subscription tiers: a Startup Plan and an Enterprise Plan. We'll start by looking at their blended, company-wide CLV. Be warned: this number can be a dangerous vanity metric if you don't dig deeper.
This infographic gives a great visual breakdown of the basic inputs. It’s a simple reminder of how average revenue and customer lifespan are the two core pillars of value.
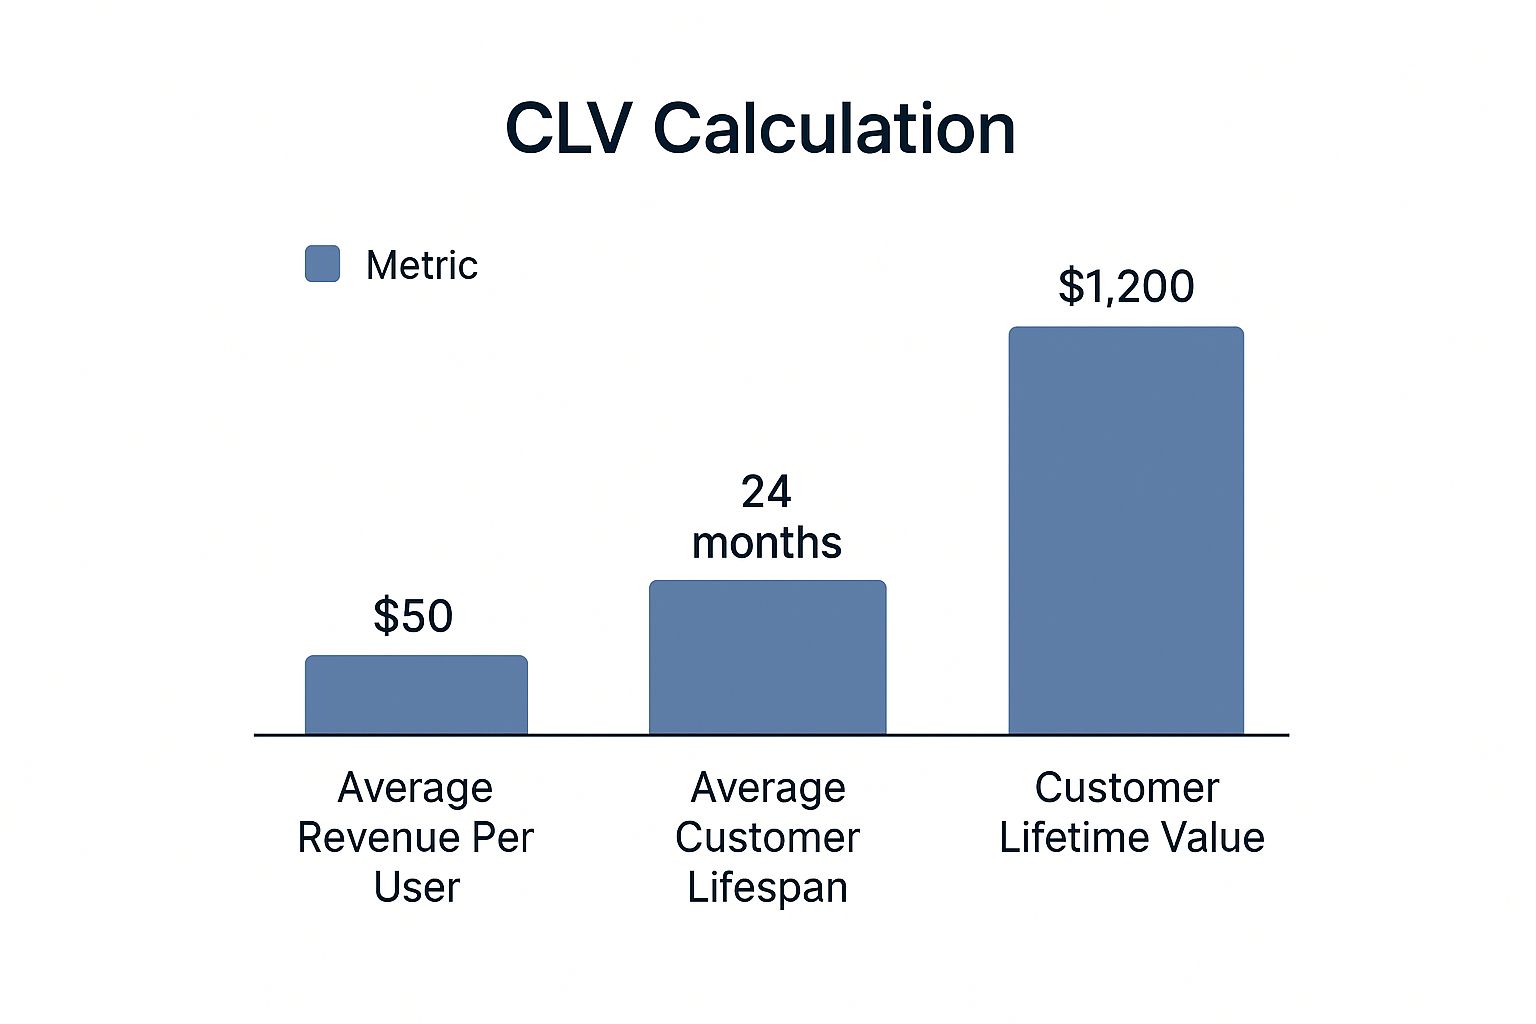
As you can see, even what might seem like small monthly revenue figures can add up to a surprisingly high lifetime value when your customers stick around.
The Problem with a "Blended" CLV
To calculate one CLV for the whole business, we just need the simple formula: CLV = ARPA / Monthly Churn Rate.
Let's say SyncUp's overall numbers look like this:
- Blended ARPA (Average Revenue Per Account): $250/month
- Blended Monthly Churn Rate: 5% (or 0.05)
Plugging those in is easy: **250 / 0.05 = **5,000.
At first glance, a $5,000 CLV feels pretty good. The leadership team can take that number, compare it to their Customer Acquisition Cost (CAC), and feel like they're on the right track. But this single number is hiding the real story.
Why Segmented CLV Is a Game-Changer
Okay, now for the important part. Let's pull apart SyncUp's numbers for its two customer segments. This is where calculating customer lifetime value for a SaaS business goes from a simple math problem to a powerful strategic tool. The difference is stark.
Here are the metrics for each plan:
Startup Plan Customers
- ARPA: $75/month
- Monthly Churn Rate: 8% (0.08)
Enterprise Plan Customers
- ARPA: $1,500/month
- Monthly Churn Rate: 1% (0.01)
Let’s run the calculations for each one.
For the Startup Plan, the CLV is **75 / 0.08 = **937.50. Not bad, but their higher churn rate really puts a ceiling on their long-term worth.
Now, for the Enterprise Plan, the CLV is a jaw-dropping **1,500 / 0.01 = **150,000. The combination of high revenue and incredible stickiness creates a customer segment that is over 160 times more valuable than the startup segment.
Here's how that looks side-by-side:
CLV Calculation Example SyncUp SaaS
| Metric | Startup Plan | Enterprise Plan | Blended Average |
|---|---|---|---|
| ARPA | $75 | $1,500 | $250 |
| Monthly Churn Rate | 8.0% | 1.0% | 5.0% |
| CLV (ARPA / Churn) | $937.50 | $150,000 | $5,000 |
This segmented view is where you get truly actionable intelligence. It tells the SyncUp marketing team exactly where their budget will have the most impact. It shows the customer success team that saving a single enterprise account is a monumental win.
This is the level of detail that transforms CLV from a passive metric you report on into a compass that actively guides your entire growth strategy.
Putting Your CLV Insights into Action

Calculating CLV is one thing, but the real magic happens when you turn those numbers into smarter business decisions. This metric isn't just a historical snapshot; it's your key to unlocking sustainable growth, but only if you actually use it to guide your strategy. It bridges the gap between raw data and profitable action.
The most crucial application of CLV is measuring it against your Customer Acquisition Cost (CAC). Honestly, the LTV to CAC ratio is the ultimate health check for your entire business model. It tells you, in no uncertain terms, if you're building a profitable engine or just burning through cash.
Decoding Your LTV to CAC Ratio
Understanding what your ratio is signaling is fundamental. It’s not just a number; it’s a story about your scalability and long-term financial health.
- A 1:1 Ratio: This is a serious red flag. You're spending just as much to acquire a customer as they're worth to you. This model is completely unsustainable.
- A 3:1 Ratio: This is widely considered the "gold standard" for a healthy SaaS business. It means you're generating three times the revenue from a customer compared to what it cost to bring them on board. You're in a good spot.
- A 5:1 Ratio or Higher: While this looks fantastic on paper, it could actually mean you're underinvesting in marketing and sales. You might be leaving a lot of growth on the table by not being more aggressive.
When it comes to benchmarking SaaS performance, the LTV to CAC ratio is a global standard. A healthy SaaS LTV:CAC ratio is typically 3:1 or higher, showing a customer generates at least three times their acquisition cost. Digging into the data, you’ll see some wild variations; Adtech, for instance, often boasts a 7:1 ratio, while many Business Services sectors hang around that 3:1 baseline. You can dig deeper into these benchmarks for SaaS CAC ratios on eqvista.com.
Drive Strategy with CLV Segments
Armed with this ratio, you can finally move beyond simple averages and start making highly targeted decisions. That segmented CLV data we calculated earlier? That just became your strategic roadmap.
This is where you can start optimizing your marketing spend. If you discover that customers from organic search have a 2x higher CLV than those from paid ads, it's a glaringly obvious signal to shift your budget toward content and SEO.
The same logic applies to your customer success team. They can prioritize their engagement efforts on high-value accounts, offering proactive support and white-glove service to protect that crucial revenue stream. This kind of proactive care is a cornerstone of solid customer retention best practices.
And finally, CLV should absolutely inform your pricing. If your enterprise segment has a sky-high CLV, it might mean you have room to adjust your pricing upwards or introduce a new premium tier. When you use CLV as your guide, you transform it from a backward-looking metric into a dynamic tool that actively shapes a more profitable future for your company.
Common Questions About SaaS CLV Calculation
Even when you have the formulas down, putting SaaS CLV into practice can feel a bit messy. Let's walk through some of the common questions that pop up when you move from the spreadsheet to the real world.
https://www.youtube.com/embed/PH55kSGvqSE
How Do I Handle Upgrades, Downgrades, and Plan Changes?
This is probably the number one question I hear. Customers change their minds, their needs evolve, and your CLV can feel like a moving target. How do you account for all that shifting revenue?
The trick is to stop thinking only about customer churn and start tracking revenue churn and expansion MRR as separate, crucial metrics.
Think of it this way: when one customer downgrades from a 100/month plan to a ****50/month plan, you've lost 50 in monthly revenue. But if another upgrades from ****100 to 200, you've gained ****100. Looking at these opposing forces gives you a much clearer, more realistic picture of customer value over time.
What's the Right Time Period for My CLV Analysis?
So, should you be looking at your data through a monthly, quarterly, or annual lens?
For the vast majority of SaaS companies, monthly data is the sweet spot. It gives you enough information to spot trends quickly without overreacting to every tiny fluctuation. A monthly cadence lets you be agile.
The exception? If you're an enterprise SaaS with long-term contracts and incredibly low churn, an annual model can make sense. It smooths out the small variations that don't really impact your bigger picture.
The most important thing here is consistency. Once you pick a time frame, stick to it. Comparing a CLV calculated with monthly churn to one based on annual data is like comparing apples and oranges—it makes the metric useless for tracking real progress.
How Should I Treat Annual vs. Monthly Contracts?
This is another great question. A customer who commits to a full year is obviously more valuable than someone paying month-to-month, even if the monthly price is the same. Their commitment alone is worth a lot.
You've got a couple of solid options for handling this in your calculations:
- Segment your customers. This is the best approach, hands down. Calculate one CLV for your monthly subscribers and a separate one for your annual subscribers. It's more work, but it shows you the true financial impact of an annual commitment.
- Normalize the data. You could convert annual contract values into a monthly recurring revenue (MRR) figure. Just be careful to adjust your churn rate for that segment, because annual customers almost always churn at a much lower rate.
Honestly, segmenting is the way to go. The clarity it provides is invaluable. It will instantly show you why offering a small discount for an annual plan is one of the smartest marketing decisions you can make.
Turn customer feedback into your biggest growth lever. SigOS uses AI to analyze support tickets, sales calls, and usage data, showing you exactly which feature requests will drive revenue and which issues are costing you money. Discover how SigOS can help you build a better product.

Ready to find your hidden revenue leaks?
Start analyzing your customer feedback and discover insights that drive revenue.
Start Free Trial →