What Is Revenue Attribution A Guide to Connecting Marketing to Sales
Struggling to prove marketing ROI? Learn what is revenue attribution, explore key models, and discover how to directly link your marketing efforts to revenue.

Revenue attribution is all about connecting the dots between your marketing and sales efforts and the actual money that lands in your bank account. It’s the framework you use to give credit—a specific dollar value—to every blog post, ad click, and email that helped convince a customer to buy.
At its core, it answers the one question every growth team lives and dies by: which of our actions are actually driving revenue?
Understanding Revenue Attribution and Why It Matters
Think of a customer's path to purchase like a soccer team driving down the field. You've got a lot of players involved—a social media ad, a helpful blog post, an engaging email newsletter—and they all touch the ball before a goal is scored. If you only watched the final kick, you'd give all the credit to the striker.
Revenue attribution is your instant replay. It’s a system that lets you see every pass and assist, assigning fair credit to each touchpoint that influenced the final sale. This pushes you past vanity metrics like clicks or leads and focuses on what really moves the needle: financial impact.
Moving Beyond Guesswork
For years, marketing budgets were often decided based on gut feelings or flimsy data. Sure, a campaign might get thousands of clicks, but did those clicks ever turn into paying customers? Attribution gets rid of that guesswork.
By tying specific marketing activities to closed deals, you get a clear, evidence-based picture of your return on investment (ROI). It's the difference between hoping you're right and knowing you are, which empowers you to make smarter decisions with real confidence.
Revenue attribution transforms marketing from a cost center into a predictable revenue engine. It provides the proof needed to justify budgets, optimize spending, and align the entire organization around measurable growth.
The Growing Importance of Data-Driven Decisions
This shift toward precise measurement isn't just a fleeting trend; it's a fundamental change in how modern businesses operate. The attribution software market, valued at USD 3.2 billion in 2025, is projected to explode to USD 41.0 billion by 2035, reflecting a massive 29.1% CAGR. This incredible growth, with North America currently holding 28% of the market share, tells a clear story: data-driven marketing is the new standard.
This boom underscores a simple truth: companies that deeply understand their customer journey will consistently outperform those that don't. For a deeper dive into the basics, you can explore this guide on what revenue attribution is and how it works.
Ultimately, putting a clear attribution strategy in place gives you a few powerful advantages:
- Optimized Marketing Spend: You can confidently pull budget from channels that aren't working and double down on the ones delivering the highest ROI.
- Proven Marketing Value: It gives you the hard numbers to show leadership exactly how marketing contributes to the bottom line.
- Smarter Strategic Planning: The insights you gain can inform everything from content strategy to product development, making sure all your efforts are aligned with what actually converts customers.
2. Comparing the Most Common Revenue Attribution Models
So, you get the "why" behind revenue attribution. But what about the "how"? That's where attribution models come in. Think of them as different lenses you can use to view your customer's journey, each one assigning credit for a sale in a slightly different way.
Choosing the right model is a big deal. It directly shapes your understanding of what's working and what's not, which in turn dictates where you invest your time and money.
Let’s use a simple analogy. Say your team is planning a group trip. One person suggests Costa Rica, another finds the eco-lodge, a third books the flights, and a fourth maps out all the rainforest hikes. Who gets the credit for the amazing vacation? An attribution model is how you decide.
This concept map breaks down the basic flow of connecting customer actions to actual dollars.
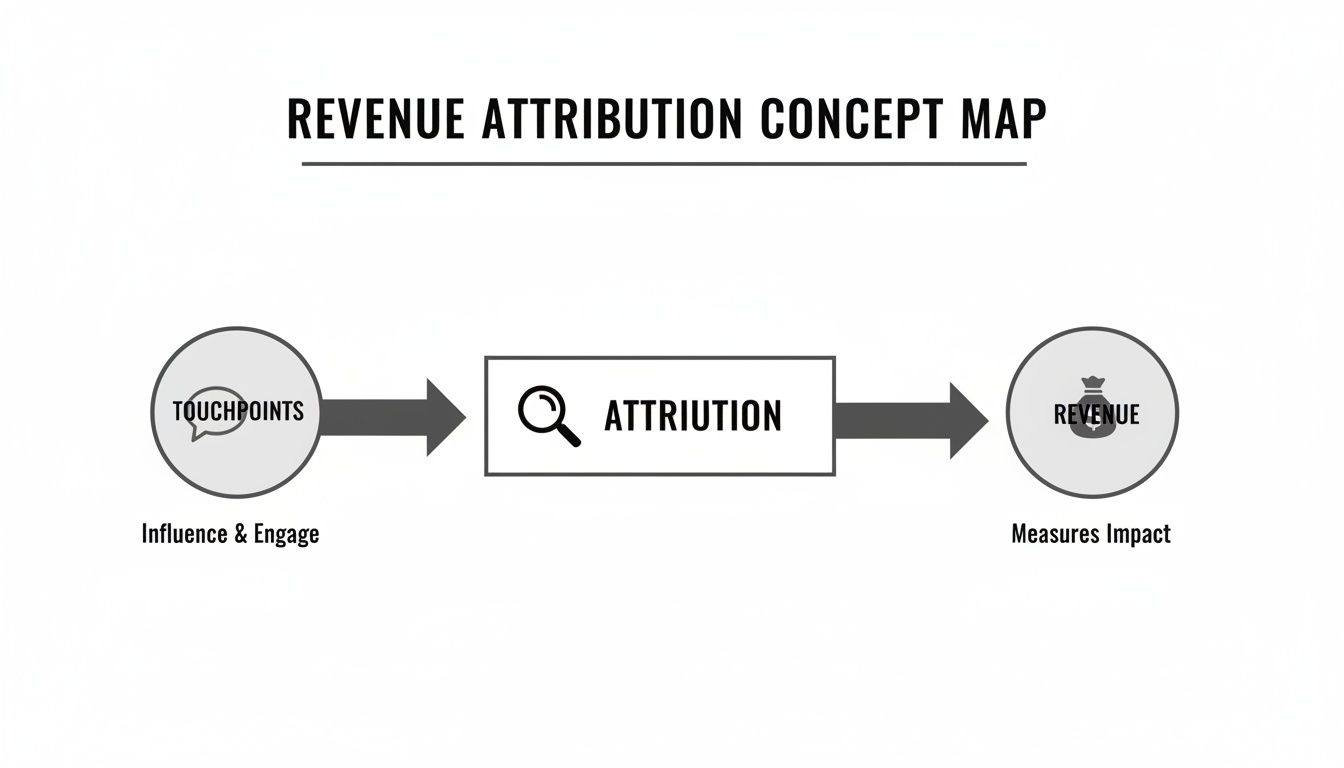
As you can see, the process starts with Touchpoints (customer interactions), runs through Attribution (your chosen analysis model), and ends with Revenue—the result you're measuring.
The Simple Approach: Single-Touch Attribution
The most straightforward models are single-touch, which give 100% of the credit to a single interaction. They're easy to set up and understand, which is why many companies start here.
- First-Touch Attribution: This model gives all the credit to the very first time a customer interacts with your brand. In our trip analogy, the person who first said, "Hey, let's go to Costa Rica!" gets all the glory. This model is fantastic for figuring out which channels are best at generating initial awareness and filling the top of your marketing funnel.
- Last-Touch Attribution: The polar opposite, this model gives all the credit to the final touchpoint right before the conversion. The friend who actually clicked "Confirm Purchase" on the plane tickets would be the hero here. It's incredibly useful for identifying which marketing activities are most effective at sealing the deal.
But there's a catch. Single-touch models are simple, but they're also blind to everything that happens in the middle. They completely ignore the crucial nurturing steps—like researching hotels or reading travel blogs—that often make the final decision possible.
The Bigger Picture: Multi-Touch Attribution
For a more holistic and accurate view, most businesses eventually move to multi-touch attribution models. These models acknowledge that multiple interactions contribute to a sale and work by splitting the credit across several key touchpoints.
There are a few popular ways to do this.
- Linear Model: The simplest multi-touch approach. It divides credit equally among every single touchpoint in the journey. If a customer interacted with five different marketing assets, each one gets 20% of the credit. It’s fair, but it can undervalue the most pivotal moments.
- Time-Decay Model: This model is based on the idea that touchpoints closer to the sale are more influential. It gives more credit to recent interactions and progressively less to those that happened weeks or months earlier. Think of it like a memory that fades over time—the most recent events are the sharpest.
- Position-Based Models (U-Shaped & W-Shaped): These are a bit more sophisticated. Instead of treating all touchpoints equally, they assign more weight to what are generally considered the most important moments.
- U-Shaped: Gives 40% of the credit to the first touch and 40% to the touchpoint that created the lead (like a demo request). The remaining 20% is split among all the interactions in between. It’s a great fit for businesses focused on lead generation.
- W-Shaped: This model is an evolution of the U-Shaped, adding a third major milestone. It assigns 30% of credit to the first touch, 30% to lead creation, and 30% to the opportunity creation touchpoint. The last 10% is divided among the rest. This is a go-to for many B2B SaaS companies with longer, more complex sales cycles.
To help you decide which model might be right for you, here’s a quick breakdown of their strengths, weaknesses, and ideal use cases.
Comparing Common Revenue Attribution Models
| Attribution Model | How It Works | Pros | Cons | Best For |
|---|---|---|---|---|
| First-Touch | Gives 100% credit to the first recorded interaction. | Simple to implement; great for understanding top-of-funnel channels. | Ignores the entire rest of the customer journey. | Businesses focused purely on demand generation and brand awareness. |
| Last-Touch | Gives 100% credit to the final interaction before conversion. | Easy to track; highlights channels that drive conversions. | Overlooks what initially brought the customer in. | Companies with short sales cycles and a focus on closing. |
| Linear | Distributes credit equally across all touchpoints. | Provides a balanced view and values every interaction. | Can dilute the impact of truly influential touchpoints. | Teams wanting a simple, holistic view without playing favorites. |
| Time-Decay | Gives more credit to touchpoints closer to the conversion. | Emphasizes actions that lead directly to a sale. | Can undervalue critical early-stage, awareness-building efforts. | B2B companies with longer consideration phases where late-stage nurturing is key. |
| U-Shaped | Gives 40% credit to the first touch, 40% to lead creation, and 20% to the middle. | Highlights two critical marketing milestones. | May not fit sales cycles where post-lead nurturing is complex. | Businesses where lead generation is the primary marketing goal. |
| W-Shaped | Gives 30% each to first touch, lead creation, and opportunity creation, with 10% for the rest. | Provides a detailed view of the full marketing and sales funnel. | More complex to set up and requires clear milestone definitions. | B2B SaaS companies with multi-stage sales cycles and strong sales/marketing alignment. |
Ultimately, there's no single "best" model. The right choice depends entirely on your business goals, the complexity of your sales cycle, and the story you need your data to tell. The goal is to pick the model that most accurately reflects how your customers actually buy from you.
The Shift to Algorithmic and Data-Driven Attribution
Simple, rule-based models like First-Touch or W-Shaped are a great way to get started. They give you a clear, if simplified, playbook for understanding where your wins are coming from. But let's be honest—their rigid rules often fail to capture the beautiful messiness of a real customer journey.
This is where the real game-changer comes in: algorithmic attribution, also known as data-driven attribution. It’s less about following a fixed playbook and more about using an intelligent system that actually learns and adapts on the fly.
Think of it like this: Instead of a referee who only cares about who scored the goal, you have an AI-powered analyst watching the entire game. It studies every single pass, tackle, and strategic move, then uses machine learning to assign a custom value to each play based on how much it actually influenced the final score.
How Data-Driven Attribution Works
Algorithmic models throw assumptions out the window. They work by crunching the numbers on thousands of customer paths—analyzing both the journeys that led to a sale and those that fizzled out. By comparing these two groups, the model uncovers statistically significant patterns and builds a weighting system that’s completely unique to your business.
It learns which touchpoints, and in what specific order, are most likely to nudge a prospect toward becoming a customer. This removes the guesswork and human bias that can skew rule-based models. Suddenly, you might discover that a seemingly minor blog post, when read early in the journey, has a far bigger impact on revenue than that expensive last-click ad. A Last-Touch model would never tell you that.
Data-driven attribution ditches the one-size-fits-all approach. It uses machine learning to create a model that mirrors how your specific customers actually behave, giving you a much truer picture of your marketing ROI.
The Benefits of an Algorithmic Approach
For any business with a complex sales funnel or a mix of marketing channels, moving to an algorithmic model is a serious upgrade.
- Pinpoint Accuracy: By looking at what customers actually do, these models give you the most precise credit allocation you can get. They spotlight the true revenue drivers, not just the touchpoints that fit a convenient rule.
- Built to Adapt: Markets shift, and so do customer habits. An algorithmic model doesn't get stale; it adapts in real-time, constantly refining its understanding of what works as new data flows in.
- Deep, Granular Insights: This is where you uncover the hidden gems. The model can assign fractional credit to dozens of different interactions, finally revealing the subtle influence of that mid-funnel webinar or those nurturing emails that other models completely ignore.
This advanced approach is quickly becoming the gold standard. In fact, market analysis shows that algorithmic models are leading the charge, with the multi-touch attribution space growing at a 14.3% CAGR. In 2024, these models already command a 34.8% market share. This growth is all about businesses craving AI-powered precision, especially in markets like North America, which makes up nearly 40% of the global revenue.
Acknowledging the Challenges
As powerful as they are, algorithmic models aren't a magic bullet. The biggest hurdle is data. You need a lot of it, and it needs to be clean. These models require a significant volume of historical conversion data to learn from, which can make them a tough fit for early-stage startups or businesses with very few transactions.
There’s also the "black box" problem. Because the machine learning model is doing the heavy lifting and assigning the weights, it can be tricky to explain exactly why a certain touchpoint got a specific percentage of the credit. It requires a certain level of trust in the data and the algorithm behind it.
But for organizations ready to level up their analytical maturity, the payoff is undeniable. Getting comfortable with these advanced methods is a huge part of putting business intelligence best practices into action. By shifting toward a truly data-driven model, you’re setting your team up to make the most informed, high-impact decisions they possibly can.
Building Your Technical Foundation for Accurate Attribution

Let's be clear: accurate revenue attribution isn't some kind of dark art. It's pure engineering. Think of it like building a house—if you pour a shaky foundation, everything you build on top of it will be crooked and unreliable. Your data is that foundation.
To get a true picture of what’s driving revenue, you first have to pull all your disparate data points into one place. This means gathering information from every platform that a customer interacts with on their journey.
The core "ingredients" you'll need to cook up a good attribution system usually include:
- CRM Data: This is your source of truth for deals, pipeline, and customer relationships (think Salesforce or HubSpot CRM).
- Marketing Automation Feeds: All the details on email opens, webinar sign-ups, and campaign engagement (from tools like HubSpot or Marketo).
- Ad Platform Analytics: Hard performance numbers from your paid campaigns (Google Ads, LinkedIn Ads, you name it).
- Website Analytics: Raw user behavior—page views, time on site, and on-site conversions (from Google Analytics or a privacy-focused alternative like Plausible).
Mastering Your Data Inputs
Just having access to these data sources isn't nearly enough. They have to be clean, consistent, and connected. Honestly, the most common point of failure in any attribution project is messy, unreliable input data. Getting this part right is non-negotiable.
One of the most powerful—and simplest—tools for this is the humble UTM parameter. These little tags you add to your URLs tell you exactly where a user came from (source), how they got there (medium), and which campaign drove their click.
Implementing a strict, company-wide UTM tracking policy is the single most effective step you can take toward clean attribution data. It turns chaotic, unattributed traffic into a clear, analyzable map of your marketing efforts.
On top of that, you need solid processes for data hygiene inside your tools. This means standardizing fields, merging duplicate contacts, and getting sales reps to consistently log lead sources. A little discipline upfront saves you from massive analytical headaches down the road.
Unifying the Customer Journey Across Platforms
Here’s where it gets tricky. A prospect might see your ad on their phone, visit your website on their work laptop, and then finally click an email link on their tablet. To your separate systems, that can look like three different people.
This is the challenge of identity resolution. It’s the process of stitching together all those fragmented touchpoints into a single, cohesive customer timeline. This usually involves a mix of tracking methods:
- Cookie-Based Tracking: The classic method of using browser cookies to identify returning visitors. It's becoming less reliable with all the recent privacy changes.
- Server-Side Tracking: This approach sends data directly from your server to analytics platforms, making it more resilient to ad-blockers and browser restrictions.
- User ID Tracking: The gold standard. Once a user logs in or gives you their email, you can assign them a unique ID and track their activity across every device. This creates the most accurate journey map possible.
Connecting these different data streams requires a serious look at your technical architecture. For anyone looking to get their hands dirty, understanding how to build data pipelines is an essential next step. It's how you create a system that can handle this kind of complexity. You can also supplement this data foundation by using tools like marketing attribution survey templates to ask customers directly what influenced their decision.
At the end of the day, your attribution model is only as smart as the data you feed it. Investing the time and resources to build a clean, unified, and well-tracked data foundation is the most critical part of the entire process.
Putting Revenue Attribution Into Action for SaaS

For a lot of businesses, a sale is the finish line. The customer journey is over. But for a Software-as-a-Service (SaaS) company, that first transaction is just the starting gun.
The real value isn't in the initial sign-up; it's earned over months and years through renewals, upgrades, and account expansion. This is exactly where traditional marketing attribution models stumble. They just weren't built for a recurring revenue world.
A model that only tracks the clicks leading to a new subscription is telling you a fraction of the story. For SaaS, true revenue attribution has to look beyond marketing channels and dig deep into the product itself. The question evolves from, "How did we get this customer?" to "What are they doing in our product that keeps them successful and drives long-term value?"
It all comes down to connecting the dots between how customers use your platform and the revenue they generate over time.
Tying Product Signals to Revenue Outcomes
So, how do you do that? The answer lies in product signals.
These are simply the data points created by user behavior inside your app. Think of them as breadcrumbs that, when followed, lead to powerful insights about customer health, engagement levels, and future revenue. By tracking these signals, you can stop making assumptions and start measuring your product's real-world impact on the bottom line.
Here are a few concrete examples of what this looks like in practice:
- Feature Adoption: You might find that customers who regularly use your new analytics dashboard are 50% less likely to churn. Suddenly, you have a clear directive: get more users to adopt this feature to protect your revenue.
- Onboarding Completion: Maybe you notice a direct correlation between users who complete your onboarding checklist and higher renewal rates. Just like that, onboarding is no longer a simple "welcome" tour—it's a critical revenue-retention machine.
- Support Ticket Patterns: Digging into support tickets could reveal that customers hitting a specific bug have a churn rate 3x higher than average. Quantifying that financial risk makes it much easier to prioritize a fix on the product roadmap.
When you can connect the first ad a customer clicked to the last feature they used before upgrading, you've built a truly holistic attribution model. This is the key to understanding the full customer lifecycle and uncovering the real drivers of sustainable growth.
A Holistic View of the Customer Journey
This product-first approach gives you a much richer, more accurate picture of what's actually working. The conversation shifts from which marketing channels are performing to which product experiences create your most valuable customers. It’s a perspective the industry is rapidly moving toward.
In fact, multi-source attribution models that provide a complete view of customer interactions are projected to command approximately 58.20% of the global market share by 2025. You can dig into more analysis on the growth of the marketing attribution software market. This isn't just a trend; it's a clear signal that businesses demand a deeper understanding of the entire customer journey.
Connecting in-product behavior to financial outcomes finally lets you answer the big-picture questions:
- Which features are most correlated with customer upgrades?
- What usage patterns signal that a customer is at risk of churning?
- How does engagement with a new feature impact the overall lifetime value of a customer in SaaS?
Ultimately, this advanced form of revenue attribution gives product and growth teams the hard data they need to build a better, more profitable product. It turns subjective feedback into measurable revenue impact, ensuring your roadmap is always aligned with what truly matters to your customers—and your business.
Your Step-By-Step Implementation Checklist
Knowing the theory is one thing, but putting it into practice is where you'll actually see results. Think of this as your roadmap for getting a real, working revenue attribution system off the ground. Follow these steps, and you'll be on your way to building something that gives you truly actionable insights.
1. Define Your Business Objectives
Before you even think about tools or models, you have to start with the "why." What questions are you actually trying to answer? If your goals are fuzzy, your results will be, too. Get specific.
For example, you might want to:
- Pinpoint the top three channels driving enterprise sales.
- Figure out the real ROI of that big product marketing campaign we just ran.
- See which blog posts are actually influencing trial sign-ups.
Having clear goals like these will be your north star for every other decision you make, from the model you pick to the software you buy.
2. Audit Your Data and Tracking Systems
Let's be blunt: your attribution model is only as good as the data you feed it. You absolutely have to do a thorough audit to find the gaps and junk data before they poison your results.
Map out your current tech stack. How does information move between your CRM, marketing automation platform, and ad accounts? Most importantly, you need to get religious about a strict, consistent UTM tracking policy for every single campaign. It sounds simple, but this discipline is the bedrock of trustworthy attribution.
A classic mistake is assuming your data is "good enough." Trust me, small tracking errors early on will snowball into massive analytical headaches down the line. Clean up your data hygiene now.
3. Choose the Right Attribution Model
Okay, your goals are clear and your data is clean. Now you can pick an attribution model that actually fits how your business works. Don't feel pressured to jump straight to the most complicated option.
- Got a short sales cycle or a team focused purely on demand gen? Start simple. A Last-Touch or First-Touch model can give you quick, directional insights without overcomplicating things.
- Navigating a long, complex B2B journey? This is where a multi-touch model like U-Shaped or W-Shaped shines. It will give you a much more balanced picture of the whole customer lifecycle.
- Are you a mature company with tons of data? An algorithmic or data-driven model is the gold standard. It builds a custom model based on how your customers actually behave, offering the highest accuracy.
4. Select Your Tools and Integrate Systems
It’s finally time to pick the tech that will make this all happen. This could be a dedicated attribution platform or the features already built into your marketing hub, like HubSpot.
The non-negotiable here is seamless integration. Your tool has to talk to all your critical data sources, from your CRM right through to your product analytics. This is where platforms like SigOS come in, automating the heavy lifting of connecting in-product signals (like feature usage or bug reports) directly to revenue, so you can finally put a dollar value on them.
5. Analyze, Iterate, and Optimize
This is not a "set it and forget it" project. Revenue attribution is a living process.
You need to schedule regular check-ins to review your reports, spot trends, and find patterns. Use what you learn to shift your budget, tweak your content strategy, and fine-tune your campaigns. The whole point is to create a feedback loop where data guides your decisions, and those decisions lead to real, measurable growth.
Answering Your Top Revenue Attribution Questions
Alright, let's move from theory to practice. Once you start digging into revenue attribution, a handful of practical questions always seem to pop up. Here are the most common ones I hear, along with some straight-up answers to help guide your strategy.
How Long Does It Take to See Results?
You'll probably start seeing some interesting little trends within a few weeks, but don't jump to conclusions just yet. For patterns you can actually trust, you need to give it a few months. This is especially true if you have a longer sales cycle—if your typical process takes 90 days, you'll need at least a full quarter's worth of data to get a clear picture.
The key is to think of attribution as a continuous process of fine-tuning, not a one-and-done project. The real win isn't finding a perfect model overnight; it’s about making slightly smarter decisions every single month.
Is Revenue Attribution Only for Large Companies?
Not at all. While big enterprises have the budget for powerful, dedicated platforms, smaller businesses can get incredible value by starting simple. The attribution models already built into Google Analytics are a fantastic (and free) place to begin.
The most important ingredient isn't a huge budget; it's discipline. If you get your team to consistently use UTM parameters on every single campaign, you'll get a surprisingly clear view of what’s working without spending a dime on new tools.
How Do You Track Offline Marketing Touchpoints?
This is a classic problem: how do you account for things like trade shows, direct mail, or print ads? The trick is to build a digital bridge that connects those offline efforts back to your analytics. This way, every touchpoint gets the credit it's due.
Here are a few proven ways to do it:
- Unique Promo Codes: Create a specific discount code for each offline campaign. Think "PODCAST20" for a podcast ad or "CONF24" for a conference handout.
- Dedicated URLs: Print a unique, easy-to-remember URL on your materials (like a vanity URL) that redirects to a landing page with all your tracking parameters already attached.
- CRM Discipline: This is a big one for sales-led businesses. Make sure your team is religious about logging the lead source in your CRM. This crucial step connects their real-world conversations to the customer's digital footprint.
By tying these offline actions back to your digital world, you start to build a much more complete and honest attribution picture.
Ready to move beyond guesswork and connect your product data directly to revenue? SigOS uses AI to analyze customer feedback and in-product behavior, automatically quantifying the dollar impact of every feature request and bug. See which actions truly drive retention and expansion.


Ready to find your hidden revenue leaks?
Start analyzing your customer feedback and discover insights that drive revenue.
Start Free Trial →