Unlock Growth: monthly active users to the next level
Master monthly active users metrics, avoid common pitfalls, and apply proven strategies to grow engagement and retention.

Monthly Active Users, or MAU, is one of the most fundamental metrics for understanding the health of a product. At its core, it counts the number of unique users who engage with your product or service over a 30-day window. It's a top-line metric that gives you a bird's-eye view of your product's reach and ability to hold an audience.
Think of it like this: if your product were a popular coffee shop, MAU isn't how many people walk past the front door. It's the number of unique customers who actually came inside and bought a coffee at least once that month. It separates casual passersby from your actual, engaged customer base.
This simple count is a powerful signal. A healthy, growing MAU tells you, your team, and your investors that you've built something people find valuable enough to return to. It’s a direct measure of traction and stickiness.
Understanding MAU At A Glance
To break it down further, here's a quick look at what MAU really represents.
| Concept | What It Measures | Why It's Important |
|---|---|---|
| Unique Users | The number of distinct individuals, not just visits or sessions. | Prevents inflated numbers from a few power users, giving a truer sense of audience size. |
| Active Engagement | Users who performed at least one meaningful action within the product. | Shows that people aren't just opening your app or site—they're actually using it. |
| 30-Day Window | A specific, consistent timeframe for measurement. | Provides a standardized benchmark to track growth or decline month-over-month. |
This metric isn't just a vanity number for a slide deck; it's a vital sign for your entire business.
What Are Monthly Active Users Really Measuring?
A rising MAU is more than just a good-looking chart. It’s direct evidence that your product is attracting new users and, just as importantly, retaining existing ones. This trend influences everything from your ability to secure the next round of funding to deciding what to build next.
It's not about how many people downloaded your app or signed up for a trial. The real question MAU answers is: how many people found enough value to make your product a part of their monthly routine? That's the difference between a passing fad and a product with real market fit.
"MAU is the heartbeat of a product. A steady, strong beat suggests health and vitality, while an erratic or fading one signals it's time to investigate the underlying issues before they become critical."
The Signal Behind the Number
Look at the giants of the tech world. The global social media ecosystem, for instance, has an almost unbelievable 5.24 billion monthly active users. That’s 86.6% of the world's eligible population over 18, showing just how deeply these platforms are woven into our lives. A leader like Facebook reports 3.07 billion MAUs, a testament to the massive scale that is possible when a product achieves sustained, long-term engagement.
Connecting MAU to Business Outcomes
Ultimately, a strong MAU is the foundation for sustainable growth. Every single one of those active users is an opportunity—for revenue, for valuable feedback, and for word-of-mouth marketing.
But just tracking the number isn't enough. To really move the needle, you have to understand the why behind the what. What actions are your most engaged users taking? Where are others getting stuck and dropping off?
Answering these questions is where behavioral analytics comes in. By digging into what users are actually doing inside your product, you can find the friction points causing churn or the "aha!" moments that create delight. This insight allows you to stop guessing and start making data-informed decisions about which features and bug fixes will have the biggest impact on keeping users active.
Calculating Monthly Active Users The Right Way
On the surface, calculating your Monthly Active Users seems simple enough. The basic formula is just counting the number of unique users who take a meaningful action within a 30-day period. But as anyone who's lived in the data knows, the real challenge is nailing down what "unique" and "active" actually mean for your specific product.
Get those definitions wrong, and your MAU quickly becomes a vanity metric. An inflated or fuzzy number can send you chasing phantom growth or, even worse, cause you to miss the early warning signs of trouble. Getting it right is everything.
This process flow shows how a person goes from just being a user in your database to someone who actually gets value—which is the whole point of a solid MAU calculation.
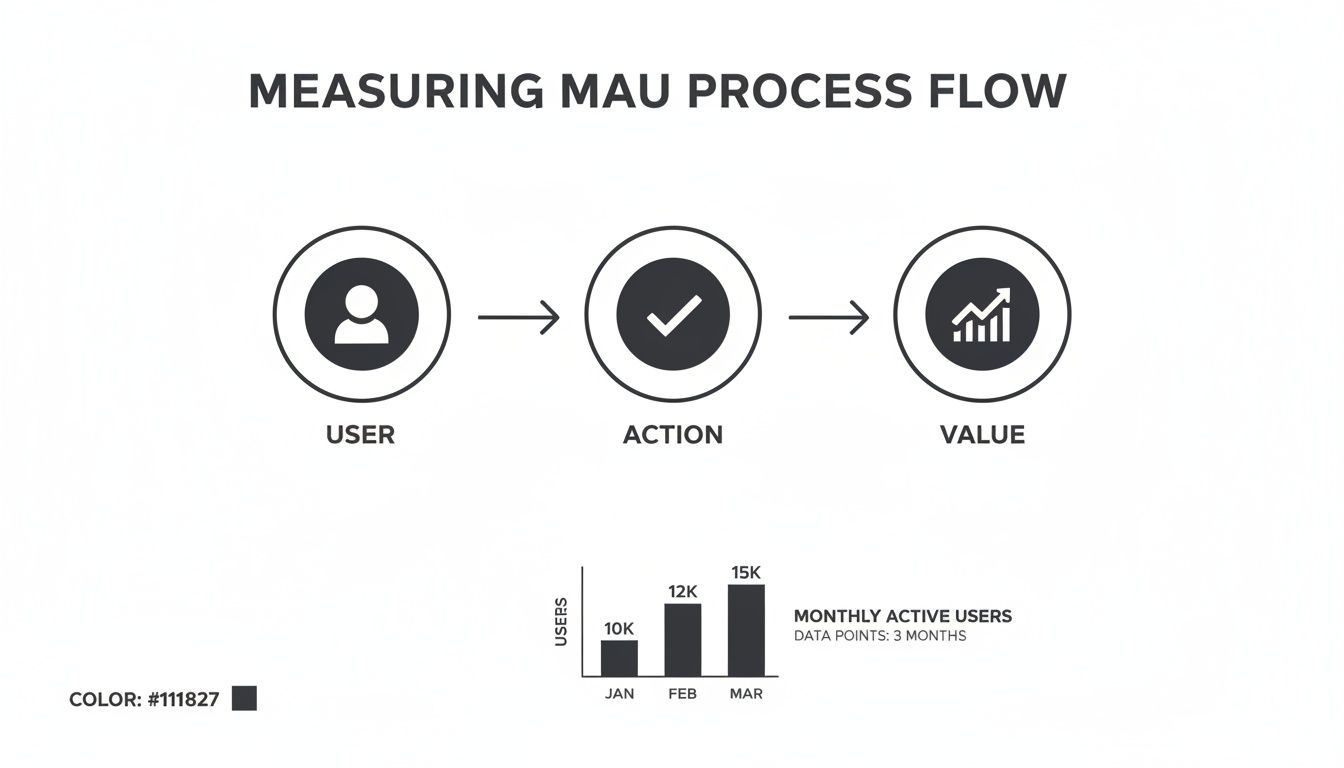
As the visual suggests, that meaningful action is the crucial link between a user simply existing and them engaging.
Defining a Unique User
First things first: how do you count one person as one person? This is a bigger deal than it sounds, especially when people jump between their phones, laptops, and tablets.
- User ID: This is the gold standard, hands down. When someone signs up, you assign them a unique ID. That ID follows them no matter where they log in from, making it the most accurate way to track an individual.
- Email Address: A solid alternative to a user ID. Like the ID, it's tied to an individual account and remains consistent across devices.
- Device ID or Cookie: This is much less reliable for tracking people but can be okay for gauging anonymous traffic. The huge drawback? One person on two devices looks like two different users, which will bloat your numbers.
For most SaaS products or any business with user accounts, basing your MAU on the user ID is the only way to go for real accuracy.
Defining a Meaningful Action
This is where the rubber really meets the road. What single action tells you a user is genuinely engaged and getting something out of your product? Just logging in is way too passive; it tells you almost nothing.
A meaningful action should be tied directly to your product's core value proposition. It’s the "job" your user hired your product to do.
Think about it this way: for a project management tool, a login is meaningless. But creating a new task or completing a project milestone? That's a user getting value. For an analytics platform, it’s not logging in—it’s generating a report. For a design tool, it’s exporting a finished creative.
Picking the right action is what separates a true measure of engagement from a number that just tracks superficial activity.
Avoiding Common Calculation Pitfalls
Once you have your definitions locked in, you have to stay vigilant about common mistakes that can throw your data off course. Keeping your MAU metric clean is an ongoing job.
- Double-Counting: This is a classic. You absolutely need a system to deduplicate users. If someone is active on their phone and their desktop in the same month, they are one active user, not two. A stable user ID system solves this.
- Inconsistent Time Windows: You have to use the same time frame every single time, whether it's a rolling 30-day period or a calendar month. If you mix and match, you can't compare this month to last month. It's that simple.
- Ignoring Time Zones: If you have users around the world, activity happens 24/7. To avoid chaos, standardize all your calculations to a single time zone, like UTC. This ensures an "active day" means the same thing for a user in Tokyo as it does for one in Toronto.
By carefully defining your users and their key actions—while steering clear of these pitfalls—you create a metric you can truly build on. To see how these users behave over longer periods, a great next step is to explore our guide on what is cohort analysis, which helps you spot crucial retention trends within your active user base.
Comparing MAU To DAU And Other Engagement Metrics
Your Monthly Active Users number gives you a great high-level view of your product's reach. But looking at MAU in a vacuum is a bit like judging a city's culture based only on its population count—it tells you how many people are there, but nothing about how they actually live. To get the full story, you need to look at MAU alongside its more focused cousins.
That’s where metrics like Daily Active Users (DAU) and Weekly Active Users (WAU) come in. Each one tells a different part of your product's engagement story, and the right one for you really depends on how people are supposed to use your product.

Think about it this way: a social media app or a team chat tool is designed for daily check-ins. For them, DAU is the heartbeat of the product. But a B2B platform for quarterly financial reporting? If users log in once a month to pull reports, that’s a win. In that case, MAU is the perfect yardstick.
Decoding DAU, WAU, and MAU
Getting a feel for the rhythm of your user engagement means looking at these different timeframes. Each one answers a slightly different question about user habits.
- DAU (Daily Active Users): This is the number of unique users who interact with your product on any given day. It’s the metric of choice for products that aim to be a daily habit, like messaging apps, news feeds, or casual games.
- WAU (Weekly Active Users): By measuring unique users over a seven-day window, WAU is perfect for products that fit into a weekly workflow. A meal planning app or a project management tool where teams sync up on Mondays are great examples.
- MAU (Monthly Active Users): As we've covered, this tracks unique users over a 30-day period. It’s the right fit for products where engagement is naturally less frequent—think personal finance tools for monthly budgeting or an e-commerce site people browse for specific, occasional purchases.
The whole point is to match the metric to your product's mission. You wouldn't obsess over daily logins for a tax software people use once a year, just like you wouldn’t be happy with only monthly engagement for a chat app.
The Stickiness Ratio: Unlocking True Engagement
Tracking DAU and MAU is a good start, but the real insight comes from combining them. The DAU/MAU ratio, better known as the "stickiness ratio," is a fantastic indicator of how essential your product has become in your users' lives.
The formula couldn't be simpler:
(Daily Active Users / Monthly Active Users) * 100
This ratio tells you what percentage of your monthly users are so hooked that they come back every single day. A higher number points to a stickier, more habit-forming product.
For instance, if you have 1,000 DAU and 5,000 MAU, your stickiness ratio is 20%. This means on any average day, you can expect to see 20% of your entire monthly user base. For many B2B SaaS products, anything over 20% is considered quite good. The top-tier consumer apps, on the other hand, can hit 50% or more.
A simple table can help clarify which metric to prioritize.
Choosing The Right User Engagement Metric
A comparative breakdown of MAU, DAU, and the Stickiness Ratio to help you measure what truly matters for your product.
| Metric | What It Measures | Best Suited For | Example Product |
|---|---|---|---|
| DAU | Daily habit and immediate value | Products intended for everyday use | Social media, team chat, news apps |
| WAU | Weekly routines and regular check-ins | Products used as part of a weekly workflow | Project management tools, fitness trackers |
| MAU | Overall reach and less frequent value | Products with a monthly or occasional use case | B2B reporting software, personal budgeting apps |
| Stickiness | User loyalty and product dependency | Products aiming to become an indispensable tool | Any product where high-frequency use is a goal |
Ultimately, this ratio helps you answer a fundamental product question: "Are we building a vitamin or a painkiller?" A painkiller solves a recurring, urgent need, which drives high stickiness. A vitamin is a "nice-to-have" that leads to more sporadic use.
To put Monthly Active Users in its proper place, you should always look at it alongside other essential Product Led Growth metrics. When you pair MAU with stickiness, retention, and churn, you move beyond simple vanity metrics and start to understand the real health of your user base.
Proven Strategies To Increase Your Monthly Active Users
Watching your MAU number is one thing; making it grow is another game entirely. Real, sustainable growth isn't about flashy marketing campaigns that create a temporary spike. It's the result of a deliberate, user-focused strategy that covers everything from how someone first hears about you to why they stick around for the long haul.
To build a product people can't help but use, you need a plan. It has to attract the right kind of people, show them why your product is amazing—fast—and then give them compelling reasons to keep coming back. We can break this down into three core areas: attracting high-intent users, creating a frictionless activation experience, and mastering proactive retention.

Attract High-Intent Users
The bedrock of healthy MAU is getting the right people in the door from the very beginning. If you cast your net too wide, you might get a lot of sign-ups, but you’ll end up with a "leaky bucket"—new users leave almost as quickly as they arrive. The smart approach is to focus on quality over sheer quantity.
This starts with having a crystal-clear understanding of your Ideal Customer Profile (ICP). What are their biggest headaches? Where do they hang out online looking for answers? Once you know that, you can tailor your marketing to speak directly to their pain points. A B2B project management tool, for example, is going to have a lot more luck finding its tribe on LinkedIn than on TikTok.
A user acquired through a targeted, problem-aware campaign is exponentially more likely to become a long-term active user than one who clicked a generic ad. The goal is to find people with the problem you solve, not just people who might be interested.
Create A Frictionless Activation Experience
Okay, you’ve attracted the perfect user. Now what? The next mission is to guide them to that "aha!" moment as quickly and smoothly as possible. This is the instant they truly get the value your product offers. A clunky, confusing, or drawn-out onboarding process is the number one killer of new user enthusiasm.
Your activation flow needs to be ruthlessly efficient.
- Simplify the Signup: Only ask for the bare minimum. Every extra field you add is another opportunity for someone to give up and leave.
- Implement a Guided Tour: Ditch the generic tour that points out every single button. Instead, create an interactive walkthrough that helps a new user complete one single, high-value action.
- Use Checklists and Progress Bars: These little visual cues are surprisingly powerful. They motivate people to finish setting things up, giving them a sense of accomplishment while pushing them closer to value.
Just think about Dropbox’s classic onboarding. It didn't just show you its features; it got you to install the desktop app and upload a file. Boom. By taking those two simple steps, you immediately understood the magic: your files are now everywhere. That immediate payoff is what turns a curious new signup into a potential long-term user.
Master Proactive Retention
Getting users in the door and activated is just the start. Proactive retention is the engine that keeps them coming back, month after month. This is all about continuously delivering value and building a real relationship that keeps your product essential to their workflow or life.
This means you’re always working on it.
- Personalized Communication: Send emails, in-app messages, and push notifications that are actually helpful. Share relevant tips or feature updates based on how they use the product, not just generic blasts to everyone.
- Valuable Feature Updates: A static product gets stale. You should be constantly shipping improvements and new features that solve real problems. It gives people a reason to check back in and see what’s new.
- Fostering Community: Build a place—like a forum, a Slack group, or regular webinars—where your users can connect with each other. A strong community creates powerful network effects and makes your product much stickier.
You can see the power of retention in the story of WhatsApp. Its incredible climb to 3 billion monthly active users, adding a billion of those in just five years, was built on a simple, reliable promise. It became an indispensable daily habit. If you're curious about how platforms hit that kind of massive scale, check out inbeat.agency's blog on Meta's statistics. By consistently delivering on its core value, WhatsApp built a fiercely loyal base that powered its global takeover.
How Product Intelligence Helps You Grow MAU
Seeing a sudden drop in your monthly active users is a classic "uh oh" moment. It's a symptom, but it's not the disease. The raw number tells you what happened, but it offers zero clues about why. Was it a critical bug in a new release? Did a recent UI change make a core feature confusing?
To stop the bleeding and actually start growing again, you have to dig deeper than surface-level metrics. You need to find the root cause of what's pushing people away.
This is where product intelligence becomes your secret weapon. Think of it as a diagnostic engine for your product's health, connecting the dots between how people use your product and the problems they run into. Instead of guessing, you can pinpoint the exact friction points that are causing users to disengage.
Platforms like SigOS are built for this. They translate the complex mix of user signals into a clear, actionable roadmap. They don't just show you a dip in your MAU chart; they help you find the specific group of users who went inactive and tie their departure to a real product problem.
Connecting Qualitative Feedback to Quantitative Data
The real magic happens when you merge two types of data that usually live in separate worlds. Your company is likely sitting on a goldmine of user insights, but it's scattered all over the place.
Product intelligence platforms pull it all together into a single source of truth.
- Quantitative Data: This is the "what"—the hard numbers like usage patterns, feature adoption rates, session duration, and clickstream data.
- Qualitative Feedback: This is the "why"—the human context buried in support tickets, live chat transcripts, app store reviews, and sales call notes.
By analyzing both together, you can uncover incredibly powerful connections. For example, a platform might discover that 75% of users who submitted a support ticket about a confusing new dashboard became inactive within the next 30 days. All of a sudden, a seemingly minor UX issue is revealed as a major driver of churn. This flips MAU from a reactive metric into a proactive guide for your product team.
Product intelligence gives a voice to your silent churn. It surfaces the frustrations of users who didn't complain—they just left—by finding patterns in the feedback of those who did.
From Insight to Prioritization
Knowing the problem is only half the battle. The next, and arguably more important, step is figuring out what to fix first. This is where modern tools add another crucial layer: quantifying the business impact of each issue. SigOS, for instance, can connect specific bugs or feature requests to revenue. This highlights which fixes will not only make users happier but also protect or grow your bottom line.
Imagine your product team is deciding between two tasks for the next sprint. One is a bug affecting a handful of power users, and the other is a feature request mentioned by several mid-tier accounts. A product intelligence platform can show that while the bug impacts fewer users, those users represent a huge chunk of your annual recurring revenue, making it the clear priority.
For this process to really move the needle on MAU, teams need to get good at using and interpreting this data. That often means mastering real-time data analytics, which lets you act on insights as they emerge, not weeks later. When you give your team these capabilities, you empower them to make data-informed decisions that lead directly to a healthier, growing user base.
Making MAU Your North Star for Product Health
Your Monthly Active User count is so much more than just a number on a dashboard. Think of it as the ultimate health check for your product—a North Star that tells you if you're headed in the right direction. This single metric cuts through the noise and shows you, in no uncertain terms, how much value your product is delivering and whether it's become a genuine habit for your customers. A healthy, growing MAU is proof that you're not just bringing new people in the door, but you're giving them a reason to stick around.
But let's be clear: sustained engagement isn't about marketing gimmicks or chasing temporary traffic spikes. Lasting MAU growth comes from one thing: an obsessive focus on the user experience. It's born from listening to what your users are actually saying, hunting down friction points, and shipping improvements that solve real, nagging problems.
Moving Beyond Simple Counts
To really use MAU as your guide, you have to dig deeper than the top-line number. A growing user base is fantastic, but what’s driving it? Which features are people actually using every day? Where are they getting tripped up? And most importantly, what’s causing some users to go inactive? Answering these questions is what transforms MAU from a passive metric into an active diagnostic tool.
It’s all about connecting user behavior to product outcomes. Take OpenAI for example. They didn't just sit back and watch their weekly active users explode from around 100 million to over 300 million in about a year. They obsessed over how people were using the product and continuously refined the experience. They weren't just counting users; they were learning from them, and that learning is what fueled their incredible growth.
Turning Insights into Action
The real magic happens when you create a tight feedback loop where user insights directly shape your development priorities. When you can draw a straight line from a confusing UI element or a frustrating bug to a drop in engagement, you suddenly know exactly what to fix to make a real impact. This is where a data-informed culture truly comes to life.
Lasting MAU growth is a testament to your ability to solve a recurring problem so effectively that users make your product a habit. It is the ultimate signal of product-market fit.
By using tools like SigOS to bring together quantitative usage data with qualitative feedback from support tickets and user interviews, you start to uncover the "why" behind the numbers. This is how you turn user insights into a powerful engine for building a product people don't just try, but one they can't live without. When you get that right, your MAU metric becomes the truest reflection of your success.
Common Questions About Monthly Active Users
As you start weaving MAU into your product strategy, a few questions always pop up. It's natural. Getting these fundamentals right is the difference between chasing a vanity metric and truly understanding your product's health. Let's dig into the most common sticking points.
What Is Considered a Good MAU Number?
This is the million-dollar question, but the honest answer is: it depends. There’s no magic number that works for everyone. A B2B enterprise tool could be incredibly successful with 5,000 deeply engaged users, while a new social media app might need millions to even get off the ground. Context is king.
Instead of fixating on a raw number, focus on the trend over time. Are you growing month-over-month? That’s the real sign of a healthy product. It's far more useful to benchmark your growth rate against your own past performance or a direct competitor than it is to compare your B2B SaaS tool to Facebook.
How Should We Define an Active User?
Your definition of "active" is the foundation of this whole metric. If you get it wrong, your MAU number is meaningless. A simple login is rarely enough—it’s too passive and can paint a picture of engagement that just isn't there.
The key is to tie the "active" event to the core value your product delivers. What's the "aha!" moment for your users?
- For a project management tool, maybe it's creating a task or commenting on a project.
- For an analytics platform, it could be running a report or building a dashboard.
- For a design tool, a great trigger might be exporting a finished creative.
Pick an action that proves a user is getting real value. Once you decide, lock it in. Keeping the definition consistent is the only way to track your progress accurately over time.
Can MAU Be a Misleading Metric?
Absolutely. If you look at it in isolation, MAU can be the ultimate vanity metric. Imagine a big marketing push brings in thousands of new sign-ups. Your MAU shoots up, and everyone celebrates. But if those users never come back, you haven't actually grown; you've just disguised a massive leaky bucket.
To get the full, unvarnished picture, you must analyze MAU alongside other key health indicators. A high MAU paired with low retention is a clear warning sign that your product isn't delivering on its initial promise.
Always pair your MAU analysis with retention rates, churn figures, and the DAU/MAU ratio (your "stickiness" score). This cocktail of metrics gives you a much more honest and balanced view of how your product is really doing.
Should We Include Free Trial Users in MAU?
This really comes down to what you’re trying to understand. Many teams find it incredibly helpful to track two different MAU counts: one for all users (including those on a trial) and a separate one for paying customers.
The first number tells you about your top-of-funnel appeal—how well are you attracting new people? The second tells you about sustained value and engagement among the people who actually pay the bills. If you have to choose just one, start with the user segment that's most critical to your business model right now.
By transforming qualitative feedback into actionable, revenue-driving insights, SigOS empowers product teams to reduce churn, accelerate expansion, and build features customers actually use. Learn how to prioritize what to build next.


Ready to find your hidden revenue leaks?
Start analyzing your customer feedback and discover insights that drive revenue.
Start Free Trial →