Real Time Data Analytics A Guide for Product Teams
Discover how real time data analytics helps product teams predict churn and find opportunities. Learn to build a low-latency strategy that drives revenue.

Real-time data analytics is all about one thing: analyzing information the instant it's generated. Instead of poring over reports from last week or last month, you get to see what’s happening right now. This lets your team shift from just reacting to problems to making smart, proactive decisions on the fly.
Why Real Time Data Analytics Is a Game Changer
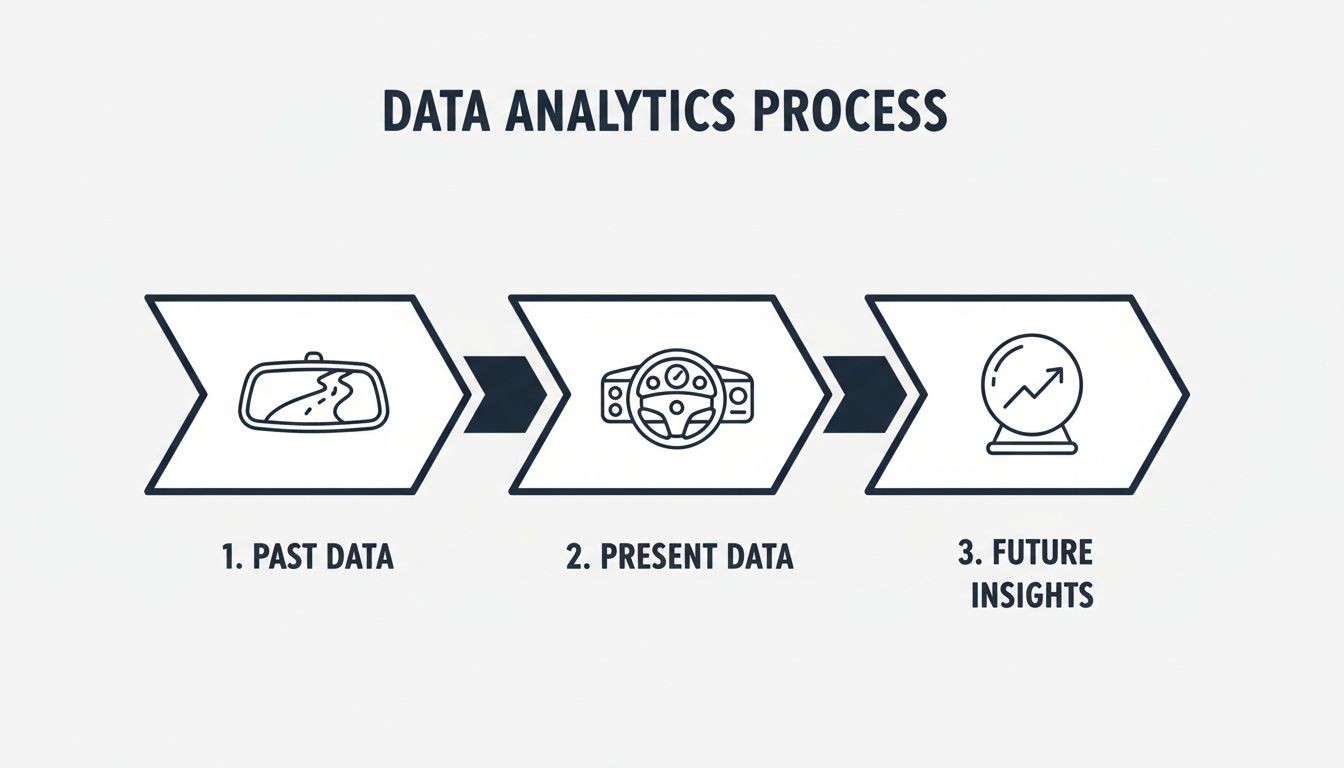
Think about driving a car. If you only looked in the rearview mirror, you'd know exactly where you’ve been, but you’d be completely blind to the road ahead. That’s pretty much how traditional business intelligence best practices work—great for analyzing the past, not so helpful for navigating the present.
Real-time data analytics is like having a live dashboard in that car. It shows you your speed, your fuel level, and any engine warnings the second they appear. For a modern SaaS company, moving from historical reports to in-the-moment decision-making isn't just an upgrade; it's a fundamental change in how you operate.
From Drowning in Data to Acting on Insight
Product and support teams today are buried in information. Every support ticket, user log, and sales call holds clues about customer health and product performance. The problem isn't a lack of data; it's that it's nearly impossible to process it fast enough to matter. By the time someone gets around to building a weekly report, the window to save a churning customer or fix a frustrating bug has usually slammed shut.
Real-time data analytics grabs insights when they are most valuable: the moment they are created. It answers questions like, "What's the best offer to show this customer right now?" or "Is a major bug affecting users at this very second?"
This isn’t a nice-to-have feature anymore; it’s a competitive must. The market's explosive growth tells the story. According to MarketsandMarkets, the real-time analytics market jumped from 14.1 billion in 2020 and is expected to hit ****31.7 billion by 2025—a compound annual growth rate of 17.1%.
Here’s a quick look at how the old way stacks up against the new standard.
Batch Processing vs Real Time Analytics at a Glance
| Attribute | Batch Processing (The Old Way) | Real Time Analytics (The New Standard) |
|---|---|---|
| Data Collection | Gathers data in large, scheduled chunks (e.g., hourly, daily) | Ingests data continuously as individual events or micro-batches |
| Processing Speed | Hours or days | Milliseconds to seconds |
| Typical Questions | "What happened last quarter?" "What were our top-selling products?" | "What is happening right now?" "Which customers are at risk of churning?" |
| Decision Style | Reactive and historical | Proactive and predictive |
| Business Value | Strategic planning, long-term trend analysis | Immediate intervention, operational efficiency, personalization |
This rapid adoption is fueled by some pretty clear advantages that give teams a real edge.
- Proactive Problem-Solving: You can spot and fix emerging issues before they blow up and affect your entire user base.
- Enhanced Customer Experience: It's possible to personalize user journeys on the fly and offer support at the precise moment someone gets stuck.
- Immediate Opportunity Seizing: You can detect patterns that signal a big revenue opportunity, like when multiple high-value prospects start asking for the same feature.
The bottom line is that the competitive advantage no longer comes from just studying the past. It comes from understanding and reacting to the present. Real-time analytics gives your team the tools to transform a constant firehose of customer feedback into your single greatest asset for growth.
The Architecture of Instant Insight
How does a single user click transform into an actionable alert in just a few seconds? It’s not magic. The secret is an architecture that works like a digital nervous system for your product, processing information the instant it happens. You don't need a PhD in computer science to get it, either. It really boils down to three core ideas working in concert.
These components are the engine behind powerful real-time data analytics, turning a flood of raw data from sources like Zendesk or Intercom into clear, actionable signals. The technology has come a long way, with advancements like programmatic Speech to Text AI even allowing for instant insights from audio streams.
This system marks a fundamental shift away from just looking at what happened to understanding what is happening right now.
Think of it this way: historical data is your rearview mirror—essential for context. But real-time analytics is your dashboard, giving you the critical information needed to make decisions in the moment and navigate what's ahead.
Stream Processing: The Active Interpreter
Picture a factory conveyor belt that never stops. The old way, batch processing, was like letting items pile up at the end for inspection. Stream processing is completely different. It’s like having inspectors examining each item as it zips by.
This is the "brain" of the operation. It analyzes data while it’s still in motion. Instead of storing everything and running queries later, stream processing engines handle events—a new support ticket, a user action, a system error—the very moment they occur. This continuous analysis is what allows for immediate pattern detection.
A stream processing system doesn't just collect data; it asks questions of the data as it flows by. This is the key to identifying an emerging bug from a sudden spike in error logs before it impacts thousands of users.
Event-Driven Architecture: The Instant Trigger
If stream processing is the brain, then an event-driven architecture is the nervous system that connects everything. In this model, the entire system is designed to react instantly to "events"—which are really just significant occurrences, like a customer leaving a bad review or a high-value prospect asking for a specific feature.
Each event acts as a trigger, kicking off a specific, pre-defined action. For example:
- Event: A VIP customer submits a support ticket that includes the word "urgent."
- Triggered Action: An automated alert is instantly sent to the Customer Success Manager's Slack channel.
This approach completely eliminates delays. Instead of polling a database every few minutes to check for updates, the system is always listening, ready to act the millisecond something important happens. It’s what makes a proactive response possible, turning a potential fire drill into a chance to deliver exceptional service. For a deeper technical look, our guide on how to build data pipelines explains how these systems are put together.
Low-Latency Pipelines: The High-Speed Pathways
Finally, for this digital nervous system to work, the signals have to travel at incredible speeds. Low-latency data pipelines are the superhighways connecting your data sources, processing engines, and dashboards with almost no delay.
Latency is simply the time it takes for data to get from point A to point B. In real-time analytics, keeping this delay as close to zero as possible is everything. A high-latency pipeline is like hitting a massive traffic jam; by the time the information arrives, the opportunity to act on it is long gone.
These pipelines are meticulously engineered for speed. They use optimized data transfer methods and efficient infrastructure to ensure data moves from a user's click to your analytics dashboard in sub-second timeframes. This speed is what allows a product manager to see the immediate impact of a new feature release or a support lead to get ahead of a service outage before customers even notice something is wrong.
Together, these three architectural pillars—stream processing, event-driven design, and low-latency pipelines—create the foundation for turning raw, real-time data into decisive action.
Turning Real-Time Data Into Business Wins
Knowing the architecture behind real-time data analytics is great, but the real magic happens when you translate that speed into actual business results. It’s not about getting data faster just for the sake of it; it’s about making smarter, more profitable decisions, right now. For SaaS product and customer success teams, this is a game-changer. It’s time to move past vanity metrics and zero in on the Key Performance Indicators (KPIs) that directly grow revenue and build loyalty.
Real-time analytics gives you the power to measure and act on these critical metrics in the moment, making the ROI undeniable. It connects the dots between a flood of user feedback and your bottom line, proving its worth to even the most skeptical stakeholders.

From Lagging Indicators to Actionable KPIs
Traditional analytics is a bit like driving while looking in the rearview mirror. It’s full of lagging indicators—metrics that tell you what already happened. Real-time analytics, on the other hand, is like having a GPS for the road ahead. It focuses on leading indicators that can predict and influence what’s coming next. That’s where you win.
Here are three core KPIs that product and success teams can completely transform with a real-time approach:
- Time to Detect Critical Issues: How fast can your team spot an emerging problem—a nasty bug, a system outage, or a wave of user frustration—from the very first sign of trouble?
- Churn Risk Prediction Accuracy: How well can you pinpoint at-risk customers before they hit the cancel button, based on subtle shifts in their behavior and what they’re telling you?
- Revenue Impact of Prioritized Features: This metric calculates the potential revenue gain from a new feature by analyzing requests from high-value customers and prospects as they come in.
By focusing on these KPIs, teams shift from a reactive stance ("Why did we lose that customer last month?") to a proactive one ("Which high-value customer is showing churn signals today?"). This change is fundamental to modern product management.
Drastically Reducing Time to Detect Issues
Picture this: a small bug slips into a new release. With old-school batch processing, you might not catch it until you review the weekly support ticket reports. By then, hundreds of users are angry, your support team is swamped, and your brand reputation has taken a hit.
Now, imagine using real-time data analytics. A system is constantly monitoring support channels like Zendesk and Intercom. The moment a few tickets pop up mentioning the same error code, an alert fires. Suddenly, your KPI for Time to Detect drops from days to minutes. This allows engineering to ship a hotfix before the problem snowballs, saving countless hours and protecting the customer experience. This is a perfect example of using real-time data for powerful AI-powered decision-making.
Improving Churn Prediction Accuracy
Customer churn is rarely a sudden event. It's usually a slow burn, preceded by a series of small frustrations: a confusing UI change, a recurring bug, or a feature they desperately need. A real-time system can analyze unstructured feedback from calls and chats right alongside product usage data. It can spot the connection between a drop in logins and a recent support ticket about a specific feature, flagging the account for a success manager to step in immediately.
This approach makes churn prediction models drastically more accurate because they’re fed with the freshest, most relevant data. Streaming analytics, a key part of this process, is poised to reshape how businesses operate. In fact, the streaming analytics market is projected to explode from 23.4 billion in 2026 to a massive ****128.4 billion by 2030, showing just how critical it is for retaining revenue. You can dig deeper into this trend by exploring the growth of real-time data integration on Integrate.io.
By turning qualitative feedback into a quantifiable risk score, you give your success team a fighting chance to save accounts that would otherwise have been long gone.
How Product Teams Use Real-Time Analytics
We've covered the architecture and the KPIs, but what does this look like on a random Tuesday afternoon? It's one thing to admire the theory of low-latency data, but it’s another thing entirely to see it save a customer relationship or clinch a new deal. Let’s walk through three common scenarios where a SaaS company uses real-time data analytics to get ahead of problems instead of constantly reacting to them.
Each story here starts with a familiar headache for product teams, pinpoints the exact real-time signal that cracked the case, and ends with a tangible business win. Think of these less as hypotheticals and more as practical blueprints for turning instant insights into action.

Use Case 1: Predicting and Preventing Customer Churn
The Problem: A mid-sized B2B SaaS company kept getting blindsided by silent churn. High-value customers would seem perfectly happy one month, only to cancel their subscriptions the next, usually with some vague feedback about "frustrations." By the time the cancellation email hit the success team's inbox, the battle was already lost.
The Real-Time Signal: Their product intelligence platform, which was continuously pulling in data streams from Zendesk, usage logs, and Salesforce, spotted a troubling pattern. A key enterprise account suddenly showed a 15% drop in daily active users over just 72 hours. At the same time, the system detected three new support tickets from that account, all mentioning "API timeout errors."
The Outcome: Instead of this data sitting in a dashboard waiting for a weekly review, an automated alert fired off to the dedicated Customer Success Manager (CSM). Armed with specific details about the API errors and the engagement dip, the CSM reached out proactively within the hour. The engineering team jumped in and quickly found a misconfiguration on the customer's end.
The issue was fixed in less than a day. The customer was floored by the proactive support, and the CSM used the opportunity to schedule a training session on new API features, turning a near-disaster into a re-engagement win. This single, real-time intervention saved an $80,000 ARR account from walking out the door.
Use Case 2: Detecting an Emerging Bug Before It Spreads
The Problem: The team had just pushed a minor update. Buried inside was a subtle bug that caused the main dashboard to load painfully slow, but only for users with massive datasets. It wasn't a full-blown outage, just a deeply frustrating experience for their most important power users.
The Real-Time Signal: Within 30 minutes of the release, the analytics system, which monitors support channels in real time, noticed something odd. Four support tickets trickled in from completely different customers, all containing the keywords "dashboard," "slow," and "loading." Four tickets might not set off alarms for a human, but the system saw it for what it was: a statistically significant cluster tied directly to the new version release.
This is the magic of real-time pattern detection. It finds the "signal in the noise" by connecting seemingly random events and pointing to a root cause before a human analyst even realizes there’s a problem to investigate.
The Outcome: The platform sent a high-priority alert directly to the on-call engineering team's Slack channel. The alert didn't just say "there's a problem"—it included links to the tickets and highlighted the correlation with the recent deployment. With that head start, engineers isolated the performance bug and pushed a hotfix in just under two hours.
The team neutralized the issue before it affected more than a handful of users, preventing what would have been hundreds of angry tickets the next morning. More importantly, it saved the support team an estimated 20-30 hours of manual triage and response work.
Use Case 3: Uncovering a Six-Figure Revenue Opportunity
The Problem: The sales team had a few major deals on the line, but they were all stalled for the same reason. The feedback was consistent: the product was great, but it lacked an integration with a popular enterprise security tool. This feature request wasn't new; it was sitting in a Jira backlog with hundreds of other ideas, with no clear data on its actual revenue impact.
The Real-Time Signal: The analytics platform started connecting the dots. By ingesting call transcripts from the sales team's CRM, it identified mentions of the exact same security integration from three different enterprise prospects in a single week. It then automatically cross-referenced this against product feedback channels and found two existing high-ARR customers had also requested it.
The Outcome: The system did the math and calculated a potential revenue impact score of over $250,000 for this one feature, flagging it for the Head of Product. This wasn't a guess; it was a data-backed business case. The product leader confidently moved the integration to the top of the roadmap. The sales team re-engaged the stalled prospects with a firm delivery date, closing two of the three deals and opening up a significant new revenue stream.
Building Your Real-Time Analytics Strategy
Moving from idea to implementation requires a solid game plan. Adopting real-time data analytics isn't like flipping a switch. It's a series of deliberate choices that have to line up with what you're trying to achieve as a business. A smart approach helps you sidestep common traps like runaway costs, security blind spots, and crippling technical debt.
This roadmap is designed to give engineering leads and CTOs a clear path forward. We'll walk through the essential steps, from figuring out which data streams actually matter to nailing down the non-functional requirements that make a system powerful, secure, and reliable.
Identify Your Most Valuable Data Sources
First things first: you need to figure out where your most important business signals are coming from. The goal isn't to boil the ocean by connecting everything at once. Start by focusing on the data sources that offer the richest insights into customer health, revenue risks, and how your product is actually being used.
For most SaaS companies, the highest-value data streams usually come from a few key places:
- Support & Success Platforms: Think Zendesk or Intercom. These platforms are absolute goldmines of unstructured feedback, capturing raw customer frustrations and feature ideas as they happen.
- Customer Relationship Management (CRM): Your CRM, like Salesforce, holds critical context. It tells you about account value, where deals are in the pipeline, and what your sales team is hearing from the field.
- Product Usage Logs: This is the ground truth of user engagement. These logs show you exactly how people interact with your application, revealing what they love, where they get stuck, and why they might leave.
When you bring these sources together, you start to see the full picture. You can finally connect the dots between a sudden drop in product usage and that spike in support tickets from the very same account.
Define Realistic Latency Service Level Agreements
Let's be real: not all data needs to be crunched in milliseconds. Defining a Service Level Agreement (SLA) for data latency is one of the most important things you can do to manage costs and set realistic expectations. The key question to ask is: how fast do we actually need to act on this insight for it to still be valuable?
An SLA for spotting a system-wide outage might need to be under one minute. But an alert for a potential churn risk? That could still be incredibly useful even if it takes a few hours.
Matching latency to the business need is how you avoid over-engineering and keep your infrastructure bills from exploding. A revenue-impact alert tied to a huge prospect’s feature request needs to be lightning-fast. An analysis of general user sentiment, on the other hand, can probably wait a bit longer.
Choose Between Sampling and Full Dataset Analysis
Your next big decision is whether you need to analyze every single data point or if a representative sample will do the trick. There's no single right answer here—it all comes down to the job you're trying to do.
| Approach | When It Makes Sense | Example |
|---|---|---|
| Data Sampling | When you need to understand broad trends quickly without incurring massive processing costs. | Analyzing general website clickstream data to spot popular navigation paths. |
| Full Dataset Analysis | When every event is critical, and missing a single data point could have significant consequences. | Detecting fraud, monitoring security events, or tracking bugs affecting high-value customers. |
For many product intelligence use cases, analyzing the full dataset is simply non-negotiable. You can't afford to miss the one support ticket that flags a critical bug or the specific feature request that could help close a six-figure deal.
Plan for Scale, Security, and Privacy
Finally, you have to build on a solid foundation. These are the non-functional requirements that can make or break your entire system. Scalability is a must. Your architecture has to be able to handle sudden surges in data—like right after a new feature launch—without falling over.
Security and privacy are just as critical. Any real-time analytics strategy has to include tough measures for data encryption, both when it's moving and when it's sitting still. You need to be sure any platform you use follows strict privacy protocols to keep sensitive customer information locked down.
The push for real-time analytics really took off after the COVID-19 pandemic showed everyone just how crucial instant, data-driven decisions are. A 2022 survey found that 52% of companies were investing in complex event processing to analyze massive data streams for everything from spotting trends to shoring up network security. You can find more details in the data analytics market insights on Fortune Business Insights. This just goes to show how important it is to get your security and scaling strategy right from day one.
How SigOS Puts This All Into Practice
So, how do you take all these powerful ideas—low-latency pipelines, stream processing, proactive KPIs—and actually put them to work? The theory is great, but the real magic happens when real-time analytics become a core part of your team's daily rhythm.
This is where a purpose-built product intelligence platform like SigOS comes in. It's designed from the ground up to be the digital nervous system for your entire product organization.
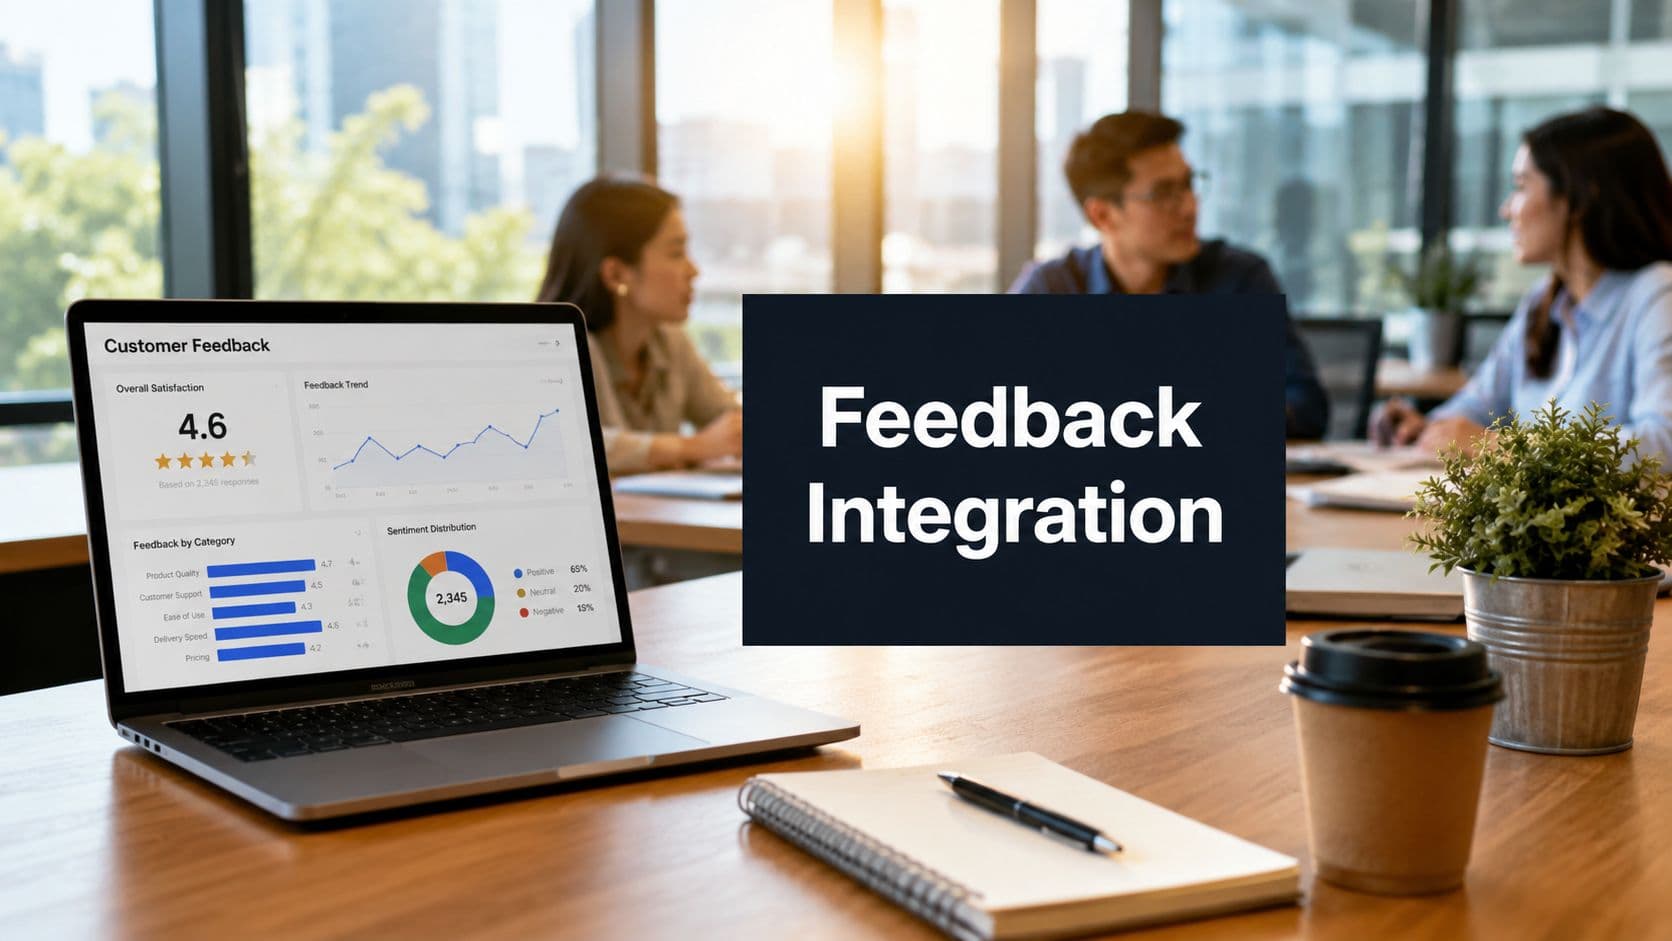
SigOS was built to handle the constant, messy flood of unstructured customer feedback—the place where your best insights are usually hiding. Its event-driven design plugs directly into the tools you already use, like Zendesk, Intercom, GitHub, and even transcripts from sales calls. It doesn't sit around waiting for a weekly export; it processes feedback the instant it happens.
From Customer Feedback to Revenue Signals
The platform is engineered to tackle the challenges every product team struggles with, turning a mountain of qualitative feedback into clear, quantifiable business signals. Forget spending hours manually tagging tickets—SigOS automates the entire discovery process.
Here’s what that looks like in the real world:
- Predictive Churn Alerts: The system can connect the dots between a customer expressing frustration in a support chat and a subtle drop in their product usage, flagging the account as a churn risk long before they stop logging in.
- Real-Time Issue Detection: It spots when different customers start using similar words to describe a problem across multiple channels. This creates an early-warning alert for your engineering team, often just minutes after the first few reports come in.
- High-Value Opportunity Alerts: SigOS can identify when several high-value prospects all ask for the same feature. It then goes a step further by calculating the potential revenue tied to that feature, giving you a data-backed reason to shift your roadmap priorities.
SigOS fundamentally changes the game from just listening to customers to truly understanding the financial weight of their words. It finally answers the question, "What's the dollar value of fixing this bug or building that feature right now?"
This isn't just about moving faster; it's about building smarter. When you can attach a real cost to bugs and a potential revenue number to feature requests, your product strategy becomes directly tied to business outcomes.
Your team can confidently decide what to work on next, knowing their efforts are focused on what will actually drive growth and make customers stick around. Your roadmap stops being a wish list and becomes a strategic plan for hitting your numbers.
Frequently Asked Questions
Even with the best strategy in place, stepping into the world of real-time analytics can feel a bit daunting. Let's tackle a few of the most common questions that pop up for product and support leaders when they start down this path.
Real-Time Analytics vs. Business Intelligence
It’s easy to get these two mixed up, but they really serve two completely different purposes.
Think of Business Intelligence (BI) as your company's quarterly financial report. It’s incredibly thorough and perfect for spotting historical trends, figuring out what worked last year, and making big-picture strategic decisions. BI is all about answering the question, "What happened?"
Real-time data analytics, in contrast, is more like a live stock ticker. It’s not about the past; it's about what’s happening right now. The goal is to trigger an immediate, operational response—like stopping a fraudulent payment in its tracks or letting the support team know about a sudden flood of bug reports. It answers the question, "What's happening this second that requires our attention?"
The main difference boils down to timing and action. BI is reflective and strategic, looking backward. Real-time analytics is immediate and tactical, focused on the present moment.
How Much Data Do I Really Need for This?
One of the biggest myths out there is that you need a firehose of "big data" for real-time analytics to be worthwhile. That’s just not the case. The real magic isn't in the raw volume of data, but in the freshness and relevance of what you're tracking.
A small but consistent stream of important data—say, support tickets from your top-tier customers or feedback from a new beta feature—can be a goldmine. For instance, spotting just five related support tickets all complaining about the same error code is often enough to flag a serious problem long before it explodes and affects your entire customer base. It's about the quality and speed of the insight, not the terabytes.
Can This Work With the Tools We Already Have?
Yes, and honestly, it has to. A real-time analytics platform that doesn't play well with your existing tools is just creating another silo. The whole idea is to pull valuable signals from the data you’re already generating without making your team jump through hoops.
Any system worth its salt should connect seamlessly with the platforms your teams use every single day. Look for pre-built, robust integrations with your core stack, including:
- Support & Ticketing: Zendesk, Intercom
- Project Management: Jira, Linear
- Code Repositories: GitHub
- CRMs: Salesforce
This is what makes the insights truly actionable. When an alert about a critical bug can automatically generate a Jira ticket—complete with all the necessary context—you’ve closed the gap between seeing a problem and fixing it. That’s how you turn a powerful insight into a fast, decisive action.
SigOS turns your scattered customer feedback into clear, revenue-driving signals. By analyzing data from the tools you already use, our platform identifies churn risks, critical bugs, and high-impact feature requests in real time. Stop guessing and start prioritizing with SigOS.
Keep Reading
More insights from our blog


Ready to find your hidden revenue leaks?
Start analyzing your customer feedback and discover insights that drive revenue.
Start Free Trial →