Your Guide to User Retention Metrics
Unlock business growth with our guide to user retention metrics. Learn to measure churn, CLV, and user activity to build a loyal customer base.

Think of user retention metrics as the vital signs for your product. They're the numbers that tell you how many customers are sticking around and continuing to use what you've built. More than just data points, they reveal your ability to deliver real, lasting value.
While getting new customers is exciting, retention is what actually builds a business.
Why Retention Is Your True Growth Engine
It’s easy to get caught up in the chase for new users. But focusing only on acquisition while your existing customers are quietly leaving is like trying to fill a leaky bucket—you can pour water in all day, but the level never really goes up.
Shifting your focus to user retention metrics is how you start plugging those holes.
Retention isn't just about damage control or preventing churn; it's the most powerful and sustainable way to grow. When you keep customers happy, they create a flywheel effect that powers your business forward in some pretty amazing ways.
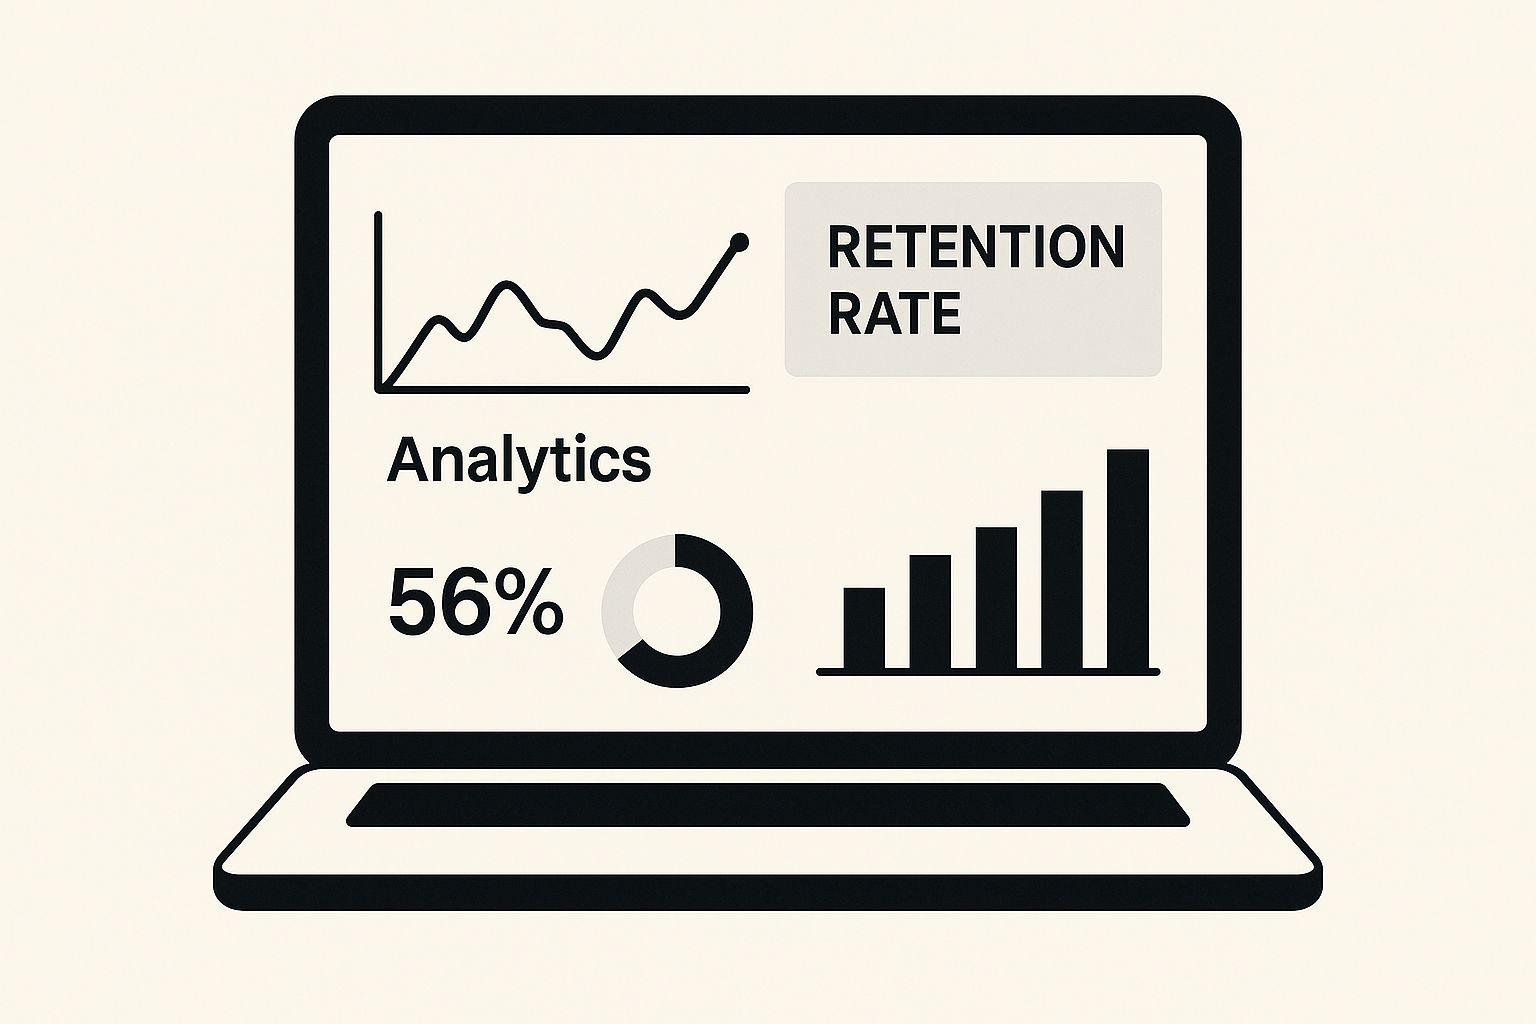
The dashboard below gives you a glimpse of what this looks like in practice, showing how key metrics tie directly into the overall health of the business.
As you can see, things like renewal rate and customer lifetime value aren't just abstract numbers—they're a real-time snapshot of your company's success.
The Compounding Value of Loyal Customers
Here’s the thing about happy, long-term customers: their value grows exponentially over time. They tend to buy more, they're often less sensitive to price increases, and they become your best salespeople through word-of-mouth referrals. The financial impact here is massive.
That single statistic says it all. Small, focused improvements in keeping your customers can lead to dramatic gains for your bottom line. To dig deeper, you can read the full research on how retention statistics impact marketers and see how this plays out across different sectors.
Ultimately, your most loyal users are also your most honest source of feedback. They'll tell you what's working and what isn't, helping you constantly refine your product for everyone. By focusing on the leaky bucket, you’re not just stopping the leaks—you’re building a solid foundation for real, profitable growth. The metrics we’re about to cover are the tools you'll use to find those leaks and fix them for good.
If you want to understand if your users are sticking around, you have to move past gut feelings and start looking at the data. While you could track dozens of different numbers, there are really just four that form the foundation of any smart retention strategy.
Think of them like the vital signs a doctor checks—each one tells you something unique and essential about the health of your product and your relationship with your users. These core user retention metrics are your first step in turning abstract data into real-world insights that actually reduce churn and fuel growth.
This is what it looks like when you put these key performance indicators on a dashboard—it's the pulse of your business.

Tracking these numbers gives you a clear view of your long-term viability and how satisfied your customers truly are.
Essential User Retention Metrics at a Glance
Before we dive into the details, here's a quick overview of the four metrics we'll be exploring. This table breaks down what each one measures and why it's so critical for your business.
| Metric | What It Measures | Why It's Important |
|---|---|---|
| User Retention Rate (URR) | The percentage of users who remain active over a specific time. | It's the ultimate measure of your product's "stickiness" and value. |
| Customer Churn Rate | The percentage of users who leave or stop using your product. | It's a direct alarm bell signaling problems with your product or user experience. |
| Customer Lifetime Value (CLV) | The total revenue you can expect from a single customer over their lifetime. | It helps you identify your most valuable users and make smarter marketing decisions. |
| DAU/MAU Ratio | The proportion of monthly active users who engage with your product daily. | It reveals how deeply your product is integrated into your users' daily habits. |
Now, let's unpack each of these metrics to see how they work and what they can tell you.
1. User Retention Rate (URR)
Let's start with the big one. User Retention Rate (URR) is as straightforward as it gets: it tells you what percentage of your users stuck around over a set period. Think of it as the ultimate grade for your product's ability to deliver on its promise. Is it valuable enough for people to keep coming back? Your URR has the answer.
To figure it out, you just need three pieces of information for your chosen timeframe (like a month or a quarter):
- CE: The total number of customers you have at the end of the period.
- CN: The number of new customers you picked up during that period.
- CS: The number of customers you had at the start of the period.
Here’s the formula: URR = [(CE - CN) / CS] x 100
Let’s say a SaaS company begins the quarter with 500 customers (CS). Over the next three months, they sign up 100 new ones (CN) and end the quarter with 550 total customers (CE). Plug that into the formula, and you get a retention rate of 90%. That means 9 out of 10 of their original customers decided to stay. That's a strong signal.
2. Customer Churn Rate
Now for the flip side of the coin: Customer Churn Rate. This metric measures the percentage of customers who left during a specific period. While retention is about celebrating who stays, churn forces you to look at who's leaving—and why. It’s the number one metric for spotting trouble before it gets out of hand.
Calculating it is simple:
- CL: How many customers you lost in the period.
- CS: How many total customers you had at the start of the period.
The formula is just: Churn Rate = (CL / CS) x 100
3. Customer Lifetime Value (CLV)
Customer Lifetime Value (CLV) is a powerful, forward-looking metric. It predicts the total amount of money you can expect to earn from a single customer over their entire relationship with you. This shifts your thinking from one-off transactions to long-term value, helping you understand which customers are truly driving your business forward.
Getting a super precise CLV can involve some complex modeling, but a simple, back-of-the-napkin version is incredibly useful. You'll need:
- Average Purchase Value: How much a customer typically spends at one time.
- Purchase Frequency: How often they buy from you in a year.
- Customer Lifespan: The average number of years a customer sticks with you.
The basic formula looks like this: CLV = (Average Purchase Value x Purchase Frequency) x Customer Lifespan
A high CLV is fantastic news. It means you're not just acquiring customers, you're keeping the right ones—the ones who contribute a whole lot more to your bottom line over time.
4. Daily and Monthly Active Users (DAU/MAU)
Finally, we have Daily Active Users (DAU) and Monthly Active Users (MAU). These metrics are all about engagement. They count the unique users who interact with your product on a daily or monthly basis, giving you a raw sense of traffic.
But the real magic happens when you look at the DAU/MAU Ratio. This tells you how "sticky" your product is by showing what percentage of your monthly users come back every day. For example, a ratio of 50% means the average user is active on 15 out of 30 days.
For apps and platforms designed for regular use, a high DAU/MAU ratio is a fantastic sign of a healthy, habit-forming product that users can't live without.
Putting Your Retention Numbers into Context
So, you’ve crunched the numbers and have your core user retention metrics in hand. Now for the million-dollar question: are they any good? A 30% retention rate might pop the champagne corks in one industry, but in another, it could be a five-alarm fire. Context is everything here.
It's a classic mistake to compare your B2B SaaS platform to, say, a casual mobile game. You're playing two completely different sports. One business model relies on daily, fleeting engagement to serve ads, while the other is built on long-term contracts and becoming deeply embedded in a customer's workflow.
To set goals that actually make sense, you need to look at benchmarks for your industry. These external reference points show you what’s achievable and how you’re really doing against competitors who are facing the same market pressures.
What Is a Good Retention Rate?
There's no single magic number for a "good" retention rate, because it’s shaped by a few critical factors. Your business model is probably the biggest one. A telecom provider with annual contracts is naturally going to have stickier customers than a free-to-play mobile game that a user can delete in two seconds.
User expectations and how the product is used also play a huge part. You wouldn't measure monthly retention for tax prep software that people only need once a year. That would be pointless. On the flip side, a social media app's survival depends entirely on its daily engagement figures.
Benchmarks Across Different Industries
The difference in retention rates from one sector to another is pretty staggering. Take mobile apps, where the numbers are all over the place depending on the category. In 2020, comic apps were at the top of the heap with a 33.8% 30-day retention rate, most likely because their episodic content keeps people coming back for the next chapter. Food & drink apps, however, only held onto 16.5% of their users over that same month.
Now, look at the other end of the spectrum. Industries built on long-term commitments post much higher figures. Telecommunications companies, for example, often hit an average customer retention rate of 78%. This is driven by things like binding contracts and the sheer hassle of switching providers. You can explore more detailed customer retention rate data to see how your own industry stacks up.
Here’s a quick breakdown of how different business models tend to influence retention:
- Contract-Based Models (e.g., Telecom, Enterprise SaaS): These businesses naturally have stronger retention because there are high barriers to leaving. Customers are locked in for a fixed term.
- Habit-Forming Products (e.g., Social Media, Music): For these products, success hinges on becoming a non-negotiable part of someone’s daily routine. High frequency is key.
- Transactional Apps (e.g., Ride-Sharing, Food Delivery): This is a tough space. Competition is fierce and loyalty is low, as users will jump to whichever app offers a better price or faster service at that moment.
Once you understand where your product fits in this landscape, you can stop chasing generic advice and start setting meaningful targets that reflect the real dynamics of your market.
How to Analyze and Improve Your Retention Rate

Knowing your retention rate is just the starting line. The real magic happens when you turn that number into a strategy that makes your product an indispensable part of your users' lives. To get there, you have to dig deeper than just the surface-level metric.
It’s not enough to know who is leaving. You need to understand when, where, and most importantly, why.
Three powerful analysis techniques will give you the answers you're looking for: cohort analysis, funnel analysis, and user segmentation. Each offers a unique angle on user behavior, helping you find the friction points and double down on what your best customers truly love.
Uncover User Behavior with Cohort Analysis
Think of it like this: every month, a new class of students enrolls in your product. Instead of lumping all your users into one giant, messy pool, cohort analysis tracks each of these "classes" separately over time. You group users by when they signed up—say, the "January 2024 cohort"—and watch how their journey unfolds.
This method is a game-changer because it reveals patterns you'd otherwise miss. You might find that users who signed up after a specific marketing campaign churn at a much higher rate. Or maybe you'll discover that a new feature you rolled out in March gave a massive boost to the retention of every group that followed.
Pinpoint Friction with Funnel Analysis
Your user's journey is a series of steps, not a single leap. A funnel analysis maps out this path—from signing up, to finishing the onboarding, to inviting a teammate—and shows you exactly where people are getting stuck and dropping off. It’s like finding the leaks in a pipe.
Let's say 90% of new users start your onboarding sequence, but only 40% actually complete it. Boom. You’ve just found a massive friction point. This isn't just a vague problem; it's a specific, actionable insight. Is the process too confusing? Is one step asking for too much information? Pinpointing these drop-offs tells you exactly where to focus your energy for the biggest impact.
Decode Loyalty with User Segmentation
Let’s be honest: not all users are created equal. Some are power users who live in your product, while others barely log in. User segmentation is the process of grouping users by shared traits or behaviors to figure out what makes your best customers tick.
You can slice and dice your user base in countless ways:
- Demographics: Based on things like company size, industry, or the user's role.
- Behavior: Which features they use, how often they log in, or their support ticket history.
- Acquisition Channel: Where they came from, like organic search or a paid ad campaign.
This kind of analysis can unearth pure gold. Maybe you discover that your most loyal, highest-retention customers are all small businesses that use one particular feature religiously. That’s a huge clue. It tells you who to target with your marketing, which features are your crown jewels, and what a "healthy" user profile looks like.
With that knowledge, you can build targeted campaigns to re-engage users who are showing signs of slipping away or redesign your onboarding to guide new users straight to that "aha!" moment.
Choosing the Right Tools to Measure Retention
Let’s be honest: trying to calculate user retention metrics by hand is a nightmare. It’s a fast track to spreadsheet overload and costly human error. To get a real grip on these numbers, you need a modern tool that automates the heavy lifting and uncovers the stories hidden in your data.
But not all tools are built the same. The right one for you really boils down to your company's size, what you’re trying to achieve, and your budget. The goal is to ditch the manual slog for an automated system that gives you a clear, real-time picture of what’s going on.
Let's walk through the main types of tools that can get you there.
Product Analytics Platforms
Think of product analytics platforms as your in-app detectives. They’re designed to track every single click, scroll, and interaction happening inside your product. These tools are incredible for cohort analysis, funnel visualization, and user segmentation, making them perfect for understanding exactly how people use what you’ve built.
- Best For: SaaS companies and mobile apps that need to get granular on how users interact with specific features.
- Examples: Mixpanel, Amplitude, and Pendo.
- Ideal Company Size: Anyone from a small startup to a massive enterprise. Pricing usually scales, but the most advanced features can get expensive.
With these platforms, you can finally answer critical questions like, "Where are people getting stuck in our onboarding?" or "What features do our power users love the most?"
The funnel analysis visual below is a perfect example of how these platforms map out user journeys step-by-step.

You can see exactly where the biggest leaks are, which means your team knows precisely where to focus its energy.
Customer Relationship Management (CRM) Systems
While analytics tools live inside your product, CRM systems zoom out to capture the entire customer relationship. They track everything from the first time someone sees your ad to sales calls and support tickets. A good CRM becomes the single source of truth for all customer information.
- Best For: B2B companies, especially those with a sales team, who need to connect retention data directly to revenue and overall account health.
- Examples: Salesforce and HubSpot.
- Ideal Company Size: Small businesses all the way up to global corporations.
CRMs are champs at tracking high-level metrics like churn rate and customer lifetime value (CLV), giving you a commercial-first view of retention.
Customer Success Platforms
This is a more specialized toolkit. Customer Success Platforms (CSPs) are built from the ground up to help your team proactively keep customers happy and engaged. They pull data from both product analytics and CRMs to create a unified "health score" for every account.
These platforms are all about action. They can trigger alerts when a customer’s usage suddenly drops, letting your team jump in and help before it’s too late.
- Best For: Mid-market and enterprise B2B companies with dedicated customer success managers.
- Examples: Gainsight and ChurnZero.
- Ideal Company Size: A great fit for businesses with a high-touch customer model and the team in place to act on the insights.
Picking the right tool is all about matching its strengths to what your business needs most. Whether you’re trying to patch a leaky product funnel, tie retention to your bottom line, or empower your customer success team, there's a solution out there to help you track your user retention metrics with total confidence.
Got More Questions About User Retention?
Even after getting the formulas down, it's totally normal to have some lingering questions when you start applying these metrics to your own product. Let's tackle a few of the most common ones that pop up.
Think of this as the "now what?" section—quick, practical answers to help you put all this theory into practice.
What’s a Good User Retention Rate for a SaaS Product?
Everyone wants a magic number, but the truth is, there isn't one. What's considered "good" is all over the map depending on your industry, how much you charge, and who your customers are. That said, benchmarks can give you a solid frame of reference.
Based on early 2025 data, the average SaaS product keeps about 39% of its users around after the first month. By month three, that number typically dips to 30%. Interestingly, smaller companies often nail early retention, while bigger enterprise players tend to have more staying power long-term. You can dig into more detailed user retention rate benchmarks on pendo.io to see how you stack up in your specific niche.
The real goal isn't just to beat some industry average. It's to know where your direct competitors stand and, more importantly, to see your own retention numbers steadily climbing month after month.
How Often Should I Be Measuring This Stuff?
The cadence for measuring retention should mirror how people naturally use your product. A one-size-fits-all approach will give you misleading data. You have to match your tracking to your customer's rhythm.
- Daily Habit Products: If you're running a social media app, a team chat tool, or a daily planner, you absolutely need to be watching your Daily Active Users (DAU) and analyzing weekly cohorts. These are your bread and butter.
- Periodic Use Products: For B2B tools that customers only touch for monthly reporting or quarterly strategy sessions, looking at daily numbers is pointless. Instead, focus on Monthly Active Users (MAU) and monthly cohorts.
First, figure out what "active" truly means for a happy customer in your world. Then, choose a timeframe that actually reflects that behavior.
Is It Possible for a High Retention Rate to Hide a Churn Problem?
Yes, and this is a dangerous trap that catches a lot of companies off guard. It happens when you’re fixated on user retention (how many logos you keep) but completely ignore revenue churn.
You might be celebrating because you're keeping almost all of your free or low-tier users, but behind the scenes, your highest-paying enterprise clients could be walking out the door. On paper, your retention looks great, but in reality, your revenue is silently bleeding out.
To see the complete story, you have to track both user retention and Monthly Recurring Revenue (MRR) Churn. A healthy business doesn't just keep the most users; it hangs on tight to its most valuable ones.
At SigOS, we help you get past the surface-level numbers. Our AI-driven platform digs into customer behavior and feedback, showing you exactly which problems are causing churn and which new features will actually grow your revenue. It helps you focus on the work that truly moves the needle on retention. See how you can prioritize with precision at https://sigos.io.
*Article created using *Outrank
Keep Reading
More insights from our blog
Ready to find your hidden revenue leaks?
Start analyzing your customer feedback and discover insights that drive revenue.
Start Free Trial →

