What is behavioural segmentation: A practical guide to SaaS growth
Discover what is behavioural segmentation and how analyzing user actions drives retention, prioritizes features, and fuels SaaS growth.

Ever wonder why some marketing and product efforts hit the mark while others fall flat? It often comes down to how you see your customers. Are you looking at a static photo or watching a live video of their journey? That’s the core difference behavioural segmentation brings to the table.
Understanding What Behavioural Segmentation Is
Put simply, behavioural segmentation is all about grouping customers by what they do inside your product, not just by who they are. It focuses on their actions, habits, and interactions—the living, breathing story of their relationship with your brand.

Think of it this way. Demographic data tells you a customer is a 45-year-old marketing manager in the tech industry. That's useful, but it’s a snapshot. Behavioural data tells you she logs in every morning, runs three specific reports, and always ignores that one new feature you just launched. Now that’s a conversation starter.
It’s the difference between knowing someone’s address and knowing their daily commute, including the coffee shop they stop at every morning. One is a fact; the other is a pattern full of insight.
Actions Speak Louder Than Attributes
For years, we’ve relied on demographic (age, location) and firmographic (company size, industry) data to build customer profiles. This information gives us the basic "who" and "where," but it's a blurry picture at best. Just because two companies are the same size and in the same industry doesn’t mean they use your software in the same way—or get the same value from it.
This is where behavioural segmentation really changes the game. It allows you to create much smarter, more relevant groups based on real actions. Instead of lumping all "mid-market tech companies" into one bucket, you can build segments like:
- Power Users: The ones who live in your product daily, use every advanced feature, and are perfect candidates for your next beta program.
- At-Risk Accounts: Users whose engagement has nosedived by 50% in the last 30 days. These are your churn risks, and they need attention now.
- Upgrade Candidates: Free or basic-tier users who keep hitting a paywall for premium features. They're practically raising their hands to tell you they want to pay more.
These action-based groups give product, success, and marketing teams something they can actually work with.
To make the distinction crystal clear, here’s a quick breakdown of how these two approaches differ.
Behavioural vs Demographic Segmentation at a Glance
| Attribute | Behavioural Segmentation (Dynamic Actions) | Demographic/Firmographic Segmentation (Static Traits) |
|---|---|---|
| What It Answers | How do they use the product? Why do they engage? | Who are they? Where are they? |
| Data Type | Dynamic (clicks, feature usage, session time) | Static (age, industry, company size, location) |
| Predictive Power | High—predicts future actions like churn or upgrade | Low—describes current state, but not future intent |
| Primary Use Case | Personalization, churn prevention, feature adoption | Broad market targeting, ad campaigns |
Ultimately, while demographics give you a starting point, behaviours tell you where to go next.
Key Types of Behavioural Segments
As you dive in, you'll find that behaviours can be grouped in several ways. These categories are the building blocks for any solid segmentation strategy.
- Purchase Behaviour: This looks at buying patterns. Are they frequent, low-value buyers or occasional big spenders? Do they only show up for a sale?
- Usage Behaviour: Absolutely critical for SaaS. This covers login frequency, which features get the most love, how long users stick around, and their overall engagement.
- Benefits Sought: This groups people by the value they're chasing. Is your product helping them save time, cut costs, or look smarter in front of their boss?
- Customer Loyalty: This separates your die-hard fans from the casual window shoppers and those who are one bad experience away from leaving.
Getting a handle on these concepts is the first step. When you start seeing your users through the lens of their actions, you can stop shouting into the void and start having meaningful conversations that drive retention, adoption, and real growth.
Why Behavioural Data Is a Game Changer for SaaS
Let’s get practical. The real magic of behavioural segmentation isn't in the theory; it’s in the tangible results it delivers. For any SaaS company, this is the difference between guessing what users want and knowing what they need based on their actual, observable actions inside your product.
This is where you stop making assumptions and start observing reality. You shift your focus from who a customer is to what they do—and that’s a far more reliable crystal ball for predicting future success.
From Vague Metrics to Actionable Insights
Sure, high-level metrics like Customer Acquisition Cost (CAC) and Lifetime Value (LTV) are essential dashboard staples. But they only tell you what happened, not why. Behavioural data fills in that crucial gap, giving you the story behind the numbers.
Think about it: a dipping Net Revenue Retention (NRR) rate isn't just a number; it's a symptom of a deeper problem. Behavioural segmentation lets you play detective. Are customers churning because they never got the hang of a key feature? Are they downgrading because they only use a tiny corner of your platform?
By connecting specific in-product actions to financial outcomes, you can finally see which behaviours create high LTV and which ones are red flags for churn. This shifts your team from constantly putting out fires to proactively building a better product.
Suddenly, you have a clear path forward. Once you discover that users who adopt your reporting suite within their first 30 days have a 2x higher LTV, your entire onboarding strategy has a new, measurable purpose. To dig deeper into this, you can learn more about how to unlock these valuable customer behavior insights in our guide.
Predicting Churn Before It Happens
One of the most powerful uses for behavioural segmentation is getting ahead of churn. Customers rarely wake up one morning and decide to leave. Their departure is usually preceded by a trail of digital breadcrumbs—small, subtle shifts in how they use your product.
Maybe they start logging in less often. Perhaps they abandon features that were once central to their workflow, or their average session time starts to shrink. By analyzing these signals, you can spot an "at-risk" segment long before a cancellation notice ever hits your inbox.
This gives your customer success team a massive advantage. Instead of sending a generic "Just checking in!" email, they can intervene with targeted, genuinely helpful support based on the exact behaviour that raised the alarm.
Driving a Revenue-Focused Product Roadmap
How do you decide what to build next? All too often, product roadmaps are dictated by the loudest voice in the room or a single, squeaky-wheel customer. Behavioural data offers a much more objective, data-driven way to set priorities.
By segmenting users based on how they interact with your product, you can clearly identify:
- Power-User Features: What parts of your product do your most valuable, highest-paying customers rely on every single day? Protect and enhance these at all costs.
- Sticky Features: Which features, once adopted, dramatically lower the odds of a customer churning? Pouring resources here directly boosts retention.
- Ghost-Town Features: Are there corners of your product that are collecting digital dust? This data helps you decide whether to improve, reposition, or simply sunset them.
This is exactly where a product intelligence platform like SigOS comes in, connecting user actions directly to revenue impact.
The screenshot below shows how such a platform can bring these insights to life, tying specific product issues to customer segments and the revenue they represent.
This view makes it incredibly clear which problems are hurting your most important accounts, allowing your team to prioritize the fixes that will save the most revenue.
The growing dependence on this level of analysis is clear from the market trends. The global behavior analytics market was recently valued between USD 4.13 billion and USD 4.82 billion, and it's projected to rocket to USD 24.84 billion by 2032. This explosive growth shows just how seriously organizations are taking behavioural data, with large enterprises currently commanding 68.9% of the market. You can explore the full report on the global behavior analytics market at Data Bridge Market Research.
Exploring the Core Types of Behavioural Segments
To really get what behavioural segmentation can do, you need to understand the different lenses you can use to look at user actions. Think of it like a mechanic's toolkit. You wouldn't use a sledgehammer to fix a watch; you need specialized instruments for specific jobs. Grouping users isn't a one-size-fits-all deal. The best strategies mix and match different behavioural segments to build a rich, multi-dimensional view of who their customers really are.
These models give you a framework for asking the right questions. Are we trying to figure out how much they use the product? Or why they bought it in the first place? Or maybe how committed they are to our brand? Each type of segment answers a different question, and when you put them together, you get a complete picture of what your users want and what they're worth to your business.
Let’s break down the four essential models that product and SaaS teams rely on to turn raw user data into a real strategic advantage.
Usage-Based Segments
This is probably the most fundamental way any software company can slice its user base. It's all about the frequency, intensity, and depth of a user's interaction with your product. It gets to the heart of questions like: Who are our most active users, and what separates them from the people who barely log in?
Common usage-based segments include:
- Power Users: These are the people who live inside your platform every day. They’re masters of advanced features, log long sessions, and jump on new functionality the moment it’s released. They’re your best source of feedback and perfect candidates for beta programs.
- Regular Users: This group logs in consistently—maybe a few times a week—and relies on a core set of features to get their work done. They are the bedrock of your user base, and a key goal is often to nudge them toward becoming power users by showing them new workflows.
- Light Users (or Casuals): These users pop in sporadically, maybe just once a month to do one specific thing. Understanding their narrow use case is key. You can either try to re-engage them with new features or just accept them as a low-touch segment.
- Inactive or Lapsed Users: This segment is made up of users who haven't logged in for a while, say 30+ days. They are a major churn risk and need immediate, targeted re-engagement campaigns to bring them back into the fold.
Purchase Behaviour Segments
While usage is about what happens in the product, purchase behaviour is all about their financial relationship with you. This model groups customers based on how they move through the buying process and what their spending habits look like. It helps you pinpoint your most profitable customers and what triggers them to open their wallets.
This isn't just about who spends the most. It's about understanding the patterns behind the purchases. When you spot these habits, you can tailor offers, forecast revenue more accurately, and focus your sales team where they'll have the biggest impact.
Key segments in this category are:
- High-Value Customers: These are the accounts on your top-tier plans or those with a long history of big spending and upgrades. They deserve the white-glove treatment and proactive account management.
- Price-Sensitive Customers: This group tends to stick to basic plans, only buys during a sale, or reacts strongly to price changes. Your messaging to them should scream value and efficiency.
- Upgrade Candidates: These are the users on lower-tier plans who are constantly hitting feature limits or usage caps. Their behaviour is a clear signal that they need—and are likely willing to pay for—a more advanced plan.
Journey and Loyalty Segments
This type of segmentation looks at where a user is in their lifecycle with your company and how deep their loyalty runs. A brand-new trial user has completely different needs and behaviours than a die-hard advocate who's been with you for five years. Grouping by journey stage and loyalty is absolutely critical for sending the right message at the right time.
Here’s how you can group users by their journey and loyalty status:
- New Users/Onboarding: This segment is all about users in their first few weeks. Their behaviour is exploratory as they figure out the basics. Your one job here is to guide them to that "aha!" moment as fast as humanly possible.
- Established Customers: These are users who are past the onboarding phase and have settled into a regular rhythm. The focus shifts to retention and encouraging them to adopt more of your product's features.
- Champions/Advocates: Your most loyal customers. They don't just use your product heavily; they actively promote your brand by leaving great reviews, referring new customers, or agreeing to be in a case study.
- At-Risk Customers: These users are waving red flags. Their usage might be dropping, or they might be flooding your support team with tickets. Their behaviour is a clear warning sign of potential churn.
Benefits Sought Segments
Finally, we have what might be the most insightful approach of all: benefits-sought segmentation. This method groups users based on the specific value or outcome they're trying to get from your product. It’s a simple but powerful idea: two customers might use the exact same feature for completely different reasons. Understanding the "why" behind the "what" is the secret to killer messaging and product positioning.
For example, a project management tool might have these distinct segments:
- The Collaborators: This group lives in features like team chat, shared dashboards, and comment threads. They're looking for a single source of truth to improve team communication.
- The Planners: These users are all about Gantt charts, timelines, and resource allocation features. Their main goal is hitting deadlines and executing on a strategic plan.
- The Reporters: This segment focuses on exporting data, building custom reports, and integrating with BI tools. They need executive-level insights and a way to track performance.
By layering these different types of behavioural segmentation, you can create incredibly specific and actionable user groups. For a deeper dive into how these groups change over time, check out our guide on what is a cohort analysis, which builds directly on these foundational concepts.
A Step-by-Step Guide to Implementing Behavioural Segmentation
Knowing the theory behind behavioural segmentation is one thing, but actually putting it to work is where you’ll see the payoff. The good news is, this isn’t some overly complex process reserved for huge companies with massive data science teams. It’s a straightforward, repeatable framework that any product, marketing, or growth team can use to make smarter decisions.
This practical guide breaks the process down into simple, manageable stages. By following these steps, you can stop making broad assumptions and start generating specific, actionable insights that directly impact your strategy and your bottom line.
Start with Clear Business Goals
Before you even think about looking at data, you need to know where you're going. What are you actually trying to accomplish? Without a clear goal, you’ll end up in "analysis paralysis"—drowning in data with no real purpose. Your objective is what tells you which user behaviours actually matter.
For instance, are you focused on:
- Reducing Churn? If so, you’ll need to pinpoint behaviours that scream "disengagement," like a sudden drop in login frequency or abandoning key features they once loved.
- Driving Expansion Revenue? Here, your attention shifts to spotting users who constantly hit paywalls or use features that are clearly tied to a higher-tier plan.
- Improving Onboarding? You'll want to track the specific actions new users take (or don't take) in their first few weeks that correlate with sticking around for the long haul.
Defining a specific, measurable goal is the most important first step. Think of it as your compass; it ensures every other action you take points toward a meaningful business outcome.
Identify and Collect the Right Data
Once you know your destination, it's time to build the map. This means figuring out which specific behavioural data points will help you reach your goal. Don't fall into the trap of tracking everything at once. Start with the data that's most relevant to the problem you're trying to solve.
You'll need to look across a few different customer touchpoints to get the full story:
- Product Usage Data: This is the heart and soul of behavioural segmentation for any SaaS company. Track events like feature clicks, session duration, how often users log in, and whether they complete important workflows.
- Customer Support Data: Your support tickets and chat logs are a goldmine of information. Look for common themes, keywords, and frustrations to understand where people are getting stuck.
- Sales and CRM Data: Notes from sales calls can tell you what "benefits" a customer was looking for when they first signed up, giving you context for their later actions.
The trick is to bring these different data sources together to create a single, unified picture of each customer's journey. This holistic view is what turns a pile of raw data into powerful, actionable segments.
Group Users into Meaningful Segments
Now that you have your data, it's time to find the patterns. This is where you connect specific behaviours to the business goals you defined earlier. The idea is to create clusters of users who all act in similar ways.
Let's say your goal is to reduce churn. You might create a segment called "At-Risk Users."
This segment isn't defined by who they are (company size, location), but by what they do. It could be a combination of actions like a 50% drop in logins over the past 30 days, a recent spike in support tickets, and abandoning a feature they used to use daily. This is a group you can act on right now.
On the flip side, you could create an "Upgrade Candidate" segment. These might be users who have looked at the pricing page multiple times and are frequently using features that belong to the next plan up. These segments are so valuable because they're based on demonstrated intent, not just static profiles.
The flow from a user's initial purchase to their ongoing usage and loyalty is what forms the basis of these segments.
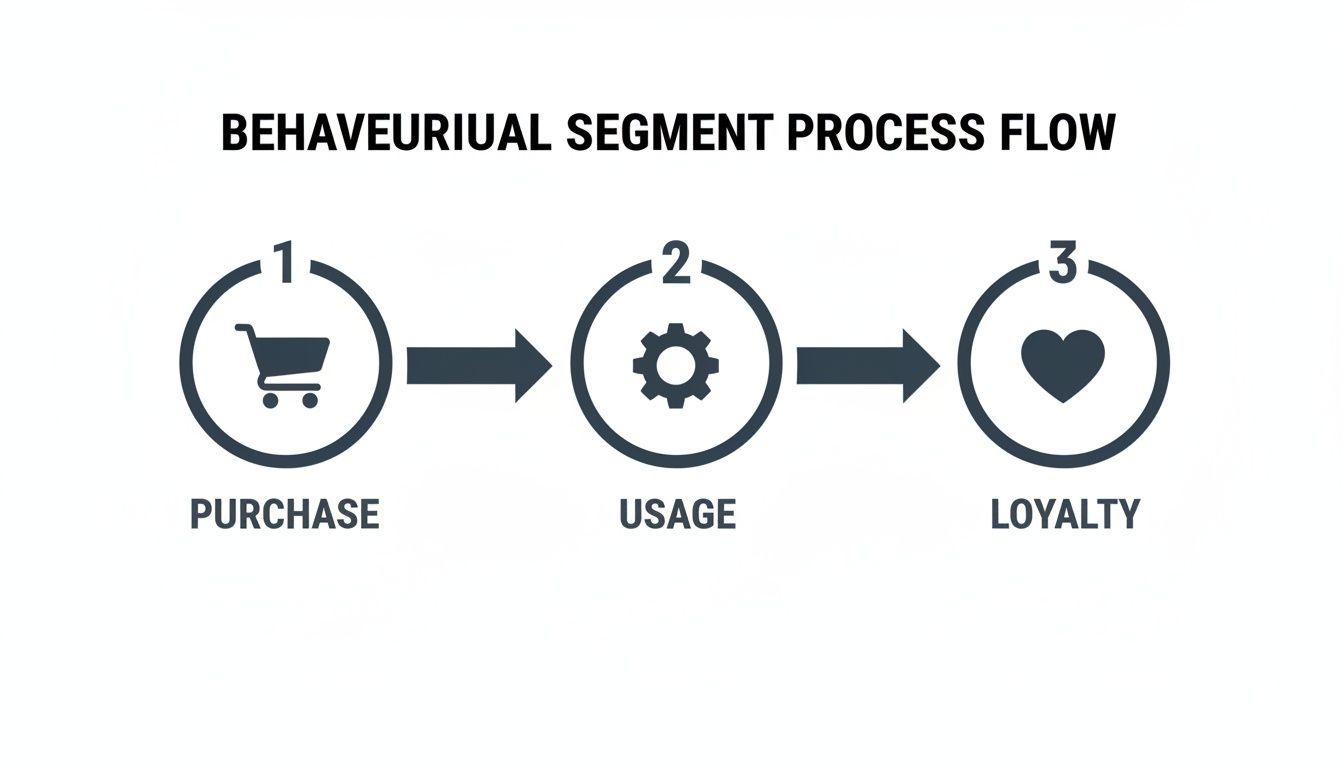
This visual shows how different actions connect across the customer lifecycle, giving you a framework for creating dynamic and truly relevant segments.
Develop and Execute Targeted Strategies
Creating segments is pointless if you don't do anything with them. For every segment you identify, you need a matching strategy designed to influence their behaviour. This is where you get to move away from generic, one-size-fits-all messaging and start personalizing the experience.
Here’s what that might look like in practice:
- For At-Risk Users: Don't wait for them to cancel. Trigger a proactive email from your customer success team offering a quick call or personalized training based on the features they've stopped using.
- For Upgrade Candidates: Launch a targeted in-app message that pops up when they use a premium-adjacent feature, highlighting exactly what they'd gain by moving up.
- For Power Users: Make them feel special. Invite them to an exclusive beta program or a customer advisory board to show you value their expertise and to get incredible feedback.
Taking targeted action like this is how you turn behavioural insights into real, measurable business results.
Measure, Refine, and Iterate
Finally, remember that behavioural segmentation isn't a "set it and forget it" project. It's a continuous cycle of learning and improving. After you launch your targeted campaigns, you have to measure what happened. Did that proactive outreach actually lower churn for the at-risk segment? Did those in-app messages lead to more upgrades?
Track the performance of every initiative against your original goals. Use what you learn to fine-tune your segments, tweak your messaging, and make your overall strategy smarter. This iterative loop ensures your understanding of customer behaviour gets sharper and more effective over time.
Putting Behavioural Segmentation into Practice
Understanding the theory is great, but seeing it drive real business outcomes is what actually matters. So, let’s move from concepts to concrete examples. We’ll look at two powerful use cases that show how SaaS companies can turn user behaviour into tangible results, like stopping churn before it happens and building a smarter product.
These examples get to the heart of why this matters: focusing on what users do gives you a much clearer path to growth than simply knowing who they are. The proof is in the numbers—a solid 80% of companies report increased revenue after putting segmentation strategies into action.
Use Case 1: Churn Prevention in Action
Picture a mid-sized SaaS company selling project management software. Their overall churn rate seems stable, but they have no idea why specific accounts are leaving. It’s a complete black box. After they start segmenting by behaviour, they create an “At-Risk” group defined by clear, action-based rules.
This segment includes any paying account that shows two specific signals over a 30-day period:
- A 40% or more drop in weekly active users.
- Zero usage of the “Reporting Dashboard,” a feature they know is a huge indicator of long-term stickiness.
Now, instead of waiting for the cancellation email to land in their inbox, the system automatically flags these accounts the moment they fit the criteria.
This flag immediately triggers a proactive, two-part response. First, an automated email goes out with a helpful guide on getting more value from the reporting tools. Second, a customer success manager gets a notification to place a personal call, find out what’s changed, and offer some targeted help.
By switching from a reactive “we’re sorry to see you go” model to a proactive one based on real behaviour, the company cut its monthly churn rate by 18% within a single quarter. They aren't just saving accounts; they're fixing the root causes of churn.
This strategy works so well because it relies on actual usage data, which is one of the strongest predictors of what a customer will do next. If you want to dive deeper into this, you can discover more insights about behavioural segmentation strategies on circana.com.
Use Case 2: Revenue-Driven Feature Prioritization
Now for another common scenario. Think of a B2B software platform trying to figure out what to build next. The engineering team is drowning in bug reports and feature requests, and every customer is convinced their problem is the most important one. The team has no objective way to prioritize the roadmap.
This is where a product intelligence platform like SigOS changes the game. It pulls in behavioural data from support tickets, product usage, and even sales calls, connecting every product issue directly to the revenue it impacts.
The product team’s messy backlog is replaced with a prioritized daily dashboard that answers the most important questions:
- Which bug is causing the most pain for our highest-value enterprise customers?
- How much potential revenue is stuck in the pipeline because of that one missing feature?
- What friction point is generating the most support tickets from our mid-market segment?
Suddenly, prioritization stops being a guessing game and becomes a clear business decision. The team might discover that a seemingly minor bug is blocking three high-value accounts from upgrading, putting 150,000 in Annual Recurring Revenue (ARR) on the line. At the same time, a popular feature request is holding up four deals in the sales pipeline, representing another ****200,000 in potential new ARR.
With this kind of data, the product team can confidently adjust its sprint. They tackle the bug fix and the feature request, knowing their work will directly and measurably grow the company’s bottom line. The roadmap is no longer just a to-do list—it's an engine for revenue.
How AI-Powered Platforms Automate Your Insights

Let's be honest: trying to manually piece together user behavior from a dozen different data sources just doesn't work anymore. It’s a constant struggle. Product teams know the pain all too well—support tickets are in one place, usage data is in another, and crucial sales feedback is buried in a CRM. This data chaos makes getting a clear, unified view of your users practically impossible.
This is where an AI-driven product intelligence platform changes the game. It acts as a central nervous system for all your user data, automatically connecting the dots you'd otherwise miss. Instead of spending weeks trying to link a bug report to a dip in usage, these platforms use AI to surface the most urgent behavioral patterns for you. They can instantly show you that a spike in support tickets is directly causing a drop in engagement from your highest-paying customers.
Turning User Behavior into Revenue-Smart Decisions
The real magic happens when you can directly link user actions to your bottom line. A platform like SigOS goes far beyond simple dashboards by actually quantifying the dollar cost of product friction. It finds the revenue opportunities hidden deep within your data.
Suddenly, your team can get fast, accurate answers to the most important questions:
- What's the revenue impact? The platform can calculate the exact ARR tied to customers hitting a specific bug or asking for a new feature.
- Which problems should we fix first? It automatically prioritizes issues based on what’s blocking renewals, holding back upgrades, or stalling new deals in your pipeline.
- What should we build next? It flags the feature requests that have the biggest potential to unlock expansion revenue from your existing customers.
When these prioritized insights land in your inbox every day, your behavioral segmentation strategy transforms from a slow, manual research project into an automated growth engine. To get the most out of your platform, it helps to understand some of the underlying AI data analysis techniques that power these insights.
Shifting from Reactive Firefighting to Proactive Growth
Ultimately, this level of automation fundamentally changes how product teams operate. You can finally stop reacting to the loudest voices and start proactively solving the problems that actually impact revenue.
This data-first approach ensures every hour your team spends is focused on work that directly reduces churn, drives expansion, and creates a better customer experience. To learn more about this shift, check out our guide on using AI for product development.
Got Questions About Behavioural Segmentation?
Getting started with behavioural segmentation can bring up a few common questions. Let's tackle them head-on to clear up any confusion and get you on the right track.
What’s the Real Difference Between Behavioural and Psychographic Segmentation?
It really comes down to actions versus attitudes.
Behavioural segmentation is all about what your users do. We're talking about concrete, measurable actions like how often they log in, which features they use every day, or when they last upgraded their plan. It's direct, objective, and incredibly powerful for product teams.
Psychographic segmentation, on the other hand, tries to understand who your users are on the inside—their beliefs, values, and lifestyles. While that’s useful for high-level brand messaging, behavioural data gives you immediate, tangible insights you can act on to improve the product itself.
How Much Data Do I Actually Need to Start?
You probably have enough to begin right now. You don't need a mountain of data to find your first meaningful insights.
Start with the basics you're likely already tracking:
- How often do people log in? (daily, weekly, monthly)
- Are they using that one core feature you built?
- What subscription plan are they on?
Just by looking at these simple data points, you can start to see patterns. The goal is to just get started; you can always build more complex segments as you go.
The key is to start now with what you have. Even basic segmentation is a significant step up from a one-size-fits-all approach, providing immediate opportunities for targeted action and learning.
Can a Small Startup Really Do This?
Absolutely. In fact, you could argue it's more critical for startups. When you have limited resources, you can't afford to guess.
Understanding how your first handful of users interact with your product helps you find product-market fit faster and tells you exactly where to focus your development time. When every customer counts, behavioural insights are your best friend for boosting retention. For more general product inquiries and details, you might explore their frequently asked questions.
Building this habit early creates a data-informed culture from day one, ensuring your roadmap is guided by what people actually do in your app, not just what they say they want.
Ready to turn user behaviour into your most valuable asset? SigOS uses AI to automatically analyze customer actions, connecting them directly to revenue impact. Prioritize the right features, prevent churn before it happens, and build a product your customers can't live without.
Discover how SigOS can transform your product strategy today


Ready to find your hidden revenue leaks?
Start analyzing your customer feedback and discover insights that drive revenue.
Start Free Trial →