How to Analyse Customer Feedback for Revenue Growth
Stop guessing. Learn how to analyse customer feedback with a playbook that connects support tickets and usage data to real revenue impact.

Stop chasing vanity metrics like satisfaction scores. If you really want to understand what your customers are telling you, you need to dig for the revenue signals buried in your support tickets, chats, and sales calls.
This is about connecting the dots between messy, qualitative feedback and tangible business outcomes—namely, customer churn and expansion revenue. The whole point is to build a system that transforms a constant stream of customer noise into a predictable source of intelligence.
Moving Beyond Surveys to Find Real Revenue Signals
Most product and support teams are in the same boat: drowning in feedback but starving for insights they can actually use. They’ll track CSAT and NPS scores down to the decimal point, but they can’t explain why a small dip in satisfaction is actually a specific bug quietly costing them thousands in MRR. The classic survey-first approach just doesn't cut it anymore; it gives you sentiment without context and almost never quantifies the financial hit of a problem.
This isn't a niche issue. Customer satisfaction has hit a critical low point, with markets in North America seeing their worst numbers in 2025. A recent study painted a grim picture: 18% of brands watched their satisfaction scores drop, while an incredible 73% flatlined, showing no improvement at all. This stagnation is proof that most companies are failing to turn feedback into changes that customers actually notice. You can dig into the complete findings in Forrester's customer satisfaction research.
The Shift from Volume to Value
If you want to break out of this cycle, you have to stop listening to the loudest customers and start tuning into the most valuable signals. Think about it: a single feature request from a prospect dangling a six-figure deal is infinitely more important than a hundred minor suggestions from free users. The secret is to build an operating system that automatically flags the exact issues losing you money and the feature requests that could unlock your next big deal.
The real goal isn't just to listen to customers; it's to understand the financial implications of what they're saying. This transforms feedback from a cost center into a powerful revenue-driving engine.
Getting there means ditching the manual tagging and endless spreadsheets. To genuinely get past superficial surveys and find insights that matter, you have to learn effective methods for gathering customer feedback that drives growth. It's all about drawing a straight, quantifiable line from a customer’s problem directly to your bottom line.
The screenshot above shows how a modern platform can automatically pull high-impact issues out of unstructured feedback. It’s not just counting mentions. It’s highlighting problems directly tied to revenue, churn risk, and expansion opportunities, turning raw data into a clear, prioritized action plan.
Building a Revenue-Focused Feedback Loop
Putting a system like this in place comes down to a few core ideas:
- Bring It All Together: Pull your feedback from every corner—support tickets, chat logs, sales call transcripts, even product usage data—into one central place.
- Let AI Do the Heavy Lifting: Use automation to categorize themes, analyze sentiment, and—this is the crucial part—connect feedback to specific customer segments and their revenue data.
- Score the Financial Impact: Put a dollar value on every piece of feedback. How much revenue is at risk because of this bug? What’s the potential expansion revenue tied to that feature request?
- Close the Loop: Feed these insights directly into your product and growth workflows. This ensures the problems with the biggest financial impact get fixed, fast.
Adopting this mindset is the first step toward a more effective voice of customer analysis that finally turns your feedback channels into a reliable engine for business intelligence.
Building a Unified Customer Feedback Hub
If you want to really understand what your customers are telling you, you have to see all of it. The real breakthroughs don't come from a single support ticket or a one-off comment. They show up when you connect the dots between a bug report, a salesperson’s notes, and the actual clicks happening inside your product. Data silos are where revenue signals go to die.
Breaking down those walls means creating one central place—a single source of truth—that pulls in every single customer interaction. This isn't just about dumping data into a big bucket. It's about building a smart pipeline that captures feedback from all the places your customers are talking.
You'll want to pull from:
- Support & Success Platforms: Tickets and chats from tools like Zendesk, Intercom, or Help Scout are overflowing with explicit problem statements.
- Sales & CRM Tools: Think about the notes from sales calls, QBRs, and lost deal reports sitting in your CRM. This is high-value context, especially from your enterprise accounts.
- Product Analytics: Usage data shows you what people do, not just what they say. It reveals where users get stuck or which features they ignore—the unspoken feedback.
- Call Transcripts: Recording and transcribing sales and support calls gives you a goldmine of unfiltered customer language and raw sentiment.
By pulling these streams together, you build a much richer picture. Suddenly, you can see how a bug flagged in Zendesk directly correlates with a dip in product engagement or a stalled expansion deal in Salesforce. That's the kind of insight you can’t get from looking at isolated dashboards.
Structuring Your Data Pipeline
Getting this unified view means being thoughtful about how you integrate your data. The goal is simple: link every piece of feedback back to a single customer or account profile. This usually involves mapping user IDs or company domains across your different platforms.
A common trap I've seen teams fall into is inconsistent formatting. A bug report from a support ticket looks totally different from a feature request jotted down during a sales call. You absolutely have to standardize key fields like "product area," "issue type," and "customer segment" as the data comes in. It's critical for clean analysis down the road.
Your ability to find revenue-driving signals is directly proportional to the quality and completeness of your underlying data. A fragmented view leads to fragmented, unreliable insights.
For example, a support agent might tag a ticket as "UI_Issue," while a salesperson logs a note about "confusing navigation." Without a unified taxonomy, your system won't see these as the same problem, and you’ll completely underestimate its true impact. This is exactly why a central data model is a non-negotiable.
This whole process is about turning noise into signal.
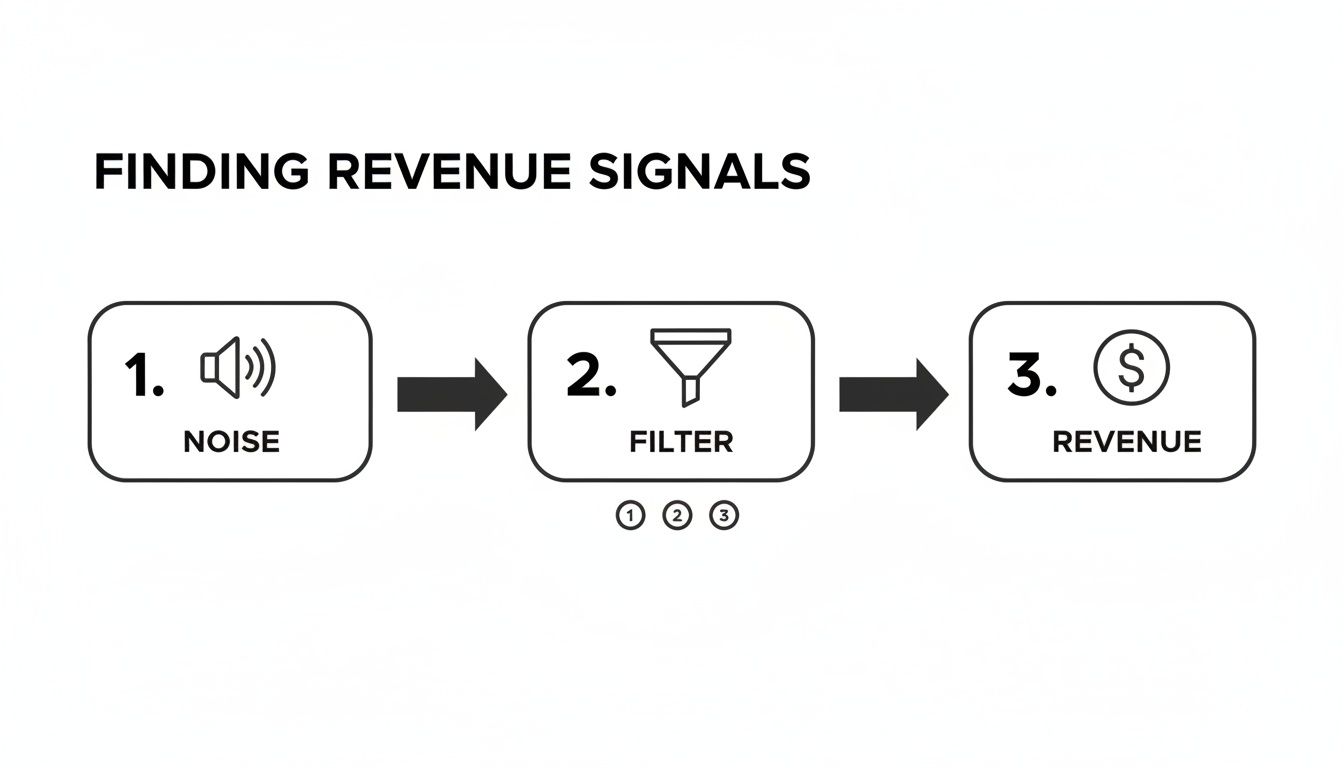
As you can see, a well-structured system acts as a filter, clearing away the chatter from multiple channels to isolate the signals that directly impact your bottom line.
Overcoming Common Aggregation Hurdles
Let’s be real—building this hub has its challenges. Many teams get stuck on technical limitations or just don't have the resources. But you don't need a massive data engineering team to get this off the ground.
Modern platforms like SigOS are built to do this heavy lifting for you. They come with pre-built integrations for common tools, automating the tedious work of pulling, cleaning, and unifying all those different data sources.
Here’s a practical way to get started:
- Identify Primary Sources: Don't try to boil the ocean. Start with your two most valuable feedback channels. For most SaaS companies, this will be your support platform and your CRM.
- Define a Core Schema: Decide on a simple, consistent way to label feedback. At a minimum, you need the customer's identity, their MRR or plan type, the source of the feedback, and the raw text itself.
- Automate Ingestion: Use APIs or integration tools to automatically pull new feedback into your central hub. Manually exporting and importing data is just not sustainable and is a recipe for errors.
Nailing these steps lays the foundation for everything that comes next. Instead of flipping between tabs and trying to connect patterns in your head, your team gets a single, powerful view of the entire customer experience. It becomes so much easier to spot the issues and opportunities that actually matter.
Using AI to Clean and Categorize Feedback
So, you’ve pulled all your feedback into one place. Great. Now comes the hard part: making sense of the chaos. You're looking at thousands of support tickets, chat logs, and call transcripts, all filled with typos, slang, and sarcasm.
Trying to read and tag this manually is a losing battle. It's not just slow; it’s a surefire way to end up with inconsistent, biased analysis that’s impossible to scale. This is the point where spreadsheets and manual processes completely break down.
To get a real handle on this data, you have to automate the cleaning and categorization. This is where AI, specifically natural language processing (NLP), comes into play. It's the only practical way to turn that mountain of messy text into a clean, queryable dataset that can actually tell you something useful. Think of it as the engine that turns raw complaints into structured insights.
From Manual Tags to Dynamic Taxonomies
The old way of doing things—manual tagging—just doesn't cut it anymore. A product manager comes up with a static list of tags like "Bug-Login" or "FeatureRequest-Dashboard," and the support team does their best to apply them correctly. But your product is always changing, and so are your customers' problems. New issues pop up that don't fit the old categories, leaving you with a growing pile of untagged, invisible feedback.
AI flips this entire model on its head by creating a dynamic taxonomy. Instead of forcing feedback into predefined boxes, NLP algorithms group it based on semantic similarity. They're smart enough to understand that "can't sign in," "login is broken," and "password reset failed" are all talking about the same core problem. This is an absolute game-changer for spotting new issues the moment they appear.
The goal isn't just to label feedback faster; it's to build a classification system that learns and adapts in real-time. A static list of tags will always be one step behind your customers' actual problems.
This automated approach helps you detect emerging themes before they blow up into widespread crises. You can watch a small cluster of tickets about "slow API performance" grow over a week, giving you a chance to react before it impacts thousands of users.
How AI Automatically Groups and Classifies
AI models do more than just match keywords; they get the context and intent behind the words. This is critical for accurately sorting the huge volume of qualitative data your team is collecting. If you're managing a high volume of conversations, exploring tools with dedicated AI email classification features can be a good move to automatically sort and tag incoming feedback.
Here’s a quick look at how this works behind the scenes:
- Theme Detection: Algorithms can identify and cluster recurring topics on their own, without any human guidance. This is perfect for uncovering the "unknown unknowns"—problems you didn't even know you should be looking for.
- Root Cause Analysis: AI can dig a layer deeper, connecting surface-level complaints to underlying technical issues. For example, it can link feedback about "slow loading times" and "dashboard errors" to a specific backend service outage.
- Classification: Once themes are identified, the system automatically sorts new, incoming feedback into the right buckets—bug report, feature request, usability friction, or pricing question.
This level of automation frees your team from hours of tedious, soul-crushing manual work. Even more importantly, it brings consistency. Every single piece of feedback is analyzed using the same model, which gets rid of the human bias and variability that always creeps into manual tagging. For a deeper dive on this, it's worth reading about how companies are using https://www.sigos.io/blog/ai-powered-decision-making to guide their product strategies.
A Practical Framework for Implementation
The good news is you don't need a team of data scientists to get started. Modern platforms like SigOS handle the heavy lifting for you. Your job is to give the system the right business context so its classifications are actually meaningful.
Here’s a straightforward way to get this up and running:
- Define Core Product Areas: Start by telling the AI about the main parts of your product. Think high-level, like "Onboarding," "Reporting," "Integrations," and "Billing." This gives the system an initial framework to work with.
- Connect Your Data Sources: Hook the AI platform directly into your feedback channels—Zendesk, Intercom, you name it. The system will start pulling in historical data and learning the specific language your customers use.
- Review and Refine: At first, you'll want to spot-check what the AI is doing. Most modern tools have a feedback loop where you can correct a miscategorized ticket. Each correction you make helps the model learn and get more accurate over time.
Following this path, you'll build a powerful, self-improving system. You're no longer just collecting comments; you're building a structured, intelligent database of customer needs. This becomes the bedrock for everything that follows, from tracking sentiment to scoring the revenue impact of each issue.
Tying Customer Sentiment to Real Business Impact
Once your feedback data is clean and organized, the real work begins. This is the fun part, where we move beyond just sorting comments and start connecting what customers feel to what they actually do. The two most powerful tools in our arsenal for this are sentiment and causal analysis.
Think of sentiment analysis as your high-level emotional pulse check. It’s fantastic for spotting widespread frustration or delight by looking at trends across thousands of interactions, not just a single angry support ticket. But on its own, sentiment is just a feeling. The real magic happens when you pair it with causal analysis, linking those feelings directly to hard business numbers.
Taking the Emotional Temperature with Sentiment Analysis
Modern sentiment analysis is much more than just slapping a "positive," "negative," or "neutral" label on feedback. A truly sophisticated approach goes deeper, identifying specific emotions like frustration, confusion, or even excitement. When you start layering this kind of analysis across different customer segments, some incredibly powerful patterns can emerge.
For example, imagine you notice a sudden spike in negative sentiment. That's interesting, but not very actionable. But by segmenting that data, you might discover the negativity is almost entirely concentrated among new users in their first 30 days—all of whom are getting stuck in the exact same spot in your onboarding flow. Now that is an insight you can take directly to your product team.
Here are a few practical ways I’ve seen teams put this into action:
- Track sentiment by product area: Is that new reporting feature you just launched generating buzz or just a lot of headaches?
- Monitor sentiment by customer tier: Are your enterprise clients expressing more frustration than your SMB accounts? This could signal a major risk.
- Analyze changes over time: Did sentiment take a nosedive right after you pushed that last release? Time to investigate.
This level of detail is what separates reactive fire-fighting from proactive experience management. You can finally pinpoint exactly where the friction is and who it's affecting most.
Finding the "Why" Behind Churn and Expansion
Causal analysis is where the rubber meets the road—it’s how you directly connect customer feedback to your bottom line. It’s all about building queries that answer the most critical questions your business faces. This is how you stop guessing and start knowing what drives customers away and what unlocks new revenue.
The core idea is to correlate specific themes or keywords from your feedback data with key business metrics living in your CRM or billing system. Instead of just knowing that some customers are unhappy, you can finally quantify the financial risk of their unhappiness.
Causal analysis transforms your feedback from a collection of opinions into a predictive financial model. It tells you which problems, if left unsolved, will cost you the most money.
This is more critical than ever, because customer patience is at an all-time low. Research shows that a staggering 56% of customers who have a bad experience don't even bother to complain—they just leave. What’s more, 86% of customers are willing to walk away from a brand after just two poor experiences. These numbers are a stark reminder that we have to find the silent majority of unhappy users before they disappear for good.
As you start to think about which analysis technique is right for you, it helps to see them side-by-side.
Feedback Analysis Techniques Comparison
| Technique | Accuracy | Scalability | Speed to Insight | Predictive Power |
|---|---|---|---|---|
| Manual Tagging | High (initially) | Very Low | Very Slow | Low |
| Basic Sentiment Analysis | Moderate | High | Fast | Moderate |
| AI-driven Causal Analysis | Very High | Very High | Near Real-time | High |
While manual tagging can feel precise for a small dataset, it simply doesn't scale. Causal analysis, on the other hand, gives you both the speed and the predictive insight needed to stay ahead of customer issues.
Building Queries That Uncover Revenue Impact
To get started with causal analysis, you need to think like a detective and form specific, testable hypotheses. Your goal is to find statistical links between what people are saying and what they do next.
Here are some real-world examples of queries you could build:
- Churn Correlation: Do customers who mention "slow performance" or "buggy integration" churn at a higher rate within 90 days compared to the average user?
- Expansion Opportunity: Which feature requests are most common among your highest Lifetime Value (LTV) accounts? Acting on these could be your fastest path to expansion revenue.
- Onboarding Friction: What are the top three issues mentioned by users who never complete the onboarding process? Fixing these could have a massive impact on your activation rate.
- Sales Blockers: What technical limitations or missing features pop up most often in "closed-lost" deal notes from your CRM? This is gold for your product roadmap.
Answering these questions turns your feedback hub into a powerful business intelligence tool. You can now walk into a meeting and say, "Fixing this performance issue is our top priority. It’s correlated with a 15% higher churn rate among our mid-market customers, which represents $30,000 in at-risk MRR."
That’s a conversation that gets things done. It removes subjectivity and aligns the entire company around fixing the problems that matter most to the bottom line.
How to Prioritize Fixes with Revenue Impact Scoring
Let's be honest: not all customer feedback carries the same weight. A feature idea from a free-tier user is a world away from a critical bug report filed by an enterprise account that's about to renew. Too many product teams still fall into the "squeaky wheel" trap, letting the loudest voices dictate their priorities.
If you want to break that cycle, you have to connect feedback directly to the bottom line. This means moving beyond simply counting ticket mentions and actually building a revenue impact scoring system.
The idea is to quantify the financial weight of every issue, turning a flood of subjective feedback into a clear, data-driven priority list. It removes the guesswork and gives you the confidence to decide what your engineers should tackle next. This works by tying the feedback themes you've identified directly to the financial data already sitting in your CRM and billing systems. Instead of just knowing an issue is "annoying," you'll know exactly how much monthly recurring revenue (MRR) it puts at risk.
Calculating At-Risk and Opportunity Revenue
At its core, this model is all about translating qualitative feedback into two crucial financial metrics. This is how you start building a real business case for every item that makes it into your development pipeline.
At-Risk Revenue
This is the most direct metric. It quantifies the MRR associated with every customer currently experiencing a specific bug or friction point. You just sum the MRR of all accounts that have reported the same underlying issue.
For instance, say ten customers report a broken integration. If their combined MRR is 15,000, then that specific bug has an at-risk revenue score of ****15,000. Suddenly, it’s crystal clear that this issue is a higher priority than another bug affecting customers who only contribute $2,000 in MRR.
Opportunity Revenue
This metric flips the script and measures the potential new or expansion revenue you're leaving on the table. This data is often gold hiding in plain sight within your sales team's CRM notes.
Imagine your sales team has three massive enterprise deals in the pipeline, worth a combined 250,000 in annual contract value (ACV). But they're all blocked because your product is missing a key security feature. That feature request now has an opportunity revenue score of ****250,000. That's a powerful argument for getting it on the roadmap, fast.
Revenue impact scoring transforms your product roadmap from a list of features into a strategic financial plan. It forces conversations to shift from "what should we build?" to "which initiatives will best protect and grow our revenue?"
This data-backed approach is also key for building customer trust. While AI is becoming more common in customer service—with 94% of customers open to AI-driven support—a healthy skepticism remains, as 61% still hesitate to fully trust AI systems. When you use this kind of sophisticated analysis to ground your roadmap in tangible business outcomes, you prove you're solving the problems that actually matter. You can find more customer support statistics and trends for 2025 here.
Putting a Scoring Framework into Practice
Doing this manually is a non-starter; no one has time to cross-reference every support ticket with the CRM. You need a system that can automatically link feedback to financials.
Here’s a practical way to set this up:
- Connect your data sources. First thing's first: make sure your feedback analysis platform (like SigOS) is properly integrated with your CRM (e.g., Salesforce) and your support desk (e.g., Zendesk).
- Create a unified customer view. The system needs a reliable way to know that "Customer A" in Zendesk is the same "Account A" in Salesforce. This is usually handled with a shared email address or a unique company ID.
- Automate your theme detection. Use AI to automatically group related pieces of feedback. A good system should instantly recognize that "can't connect to API" and "integration is failing" are talking about the exact same problem.
- Assign the revenue scores. Once a theme is identified, the system should automatically query your CRM, pull the MRR for every affected customer, and calculate the total at-risk revenue for that theme.
By automating this workflow, you get a living, breathing, prioritized list of issues based on their real-world financial impact. This ensures your engineering team is always focused on solving the problems that matter most to the health and growth of the business.
Turning Insights Into Action with Automated Workflows

Let's be honest: all the analysis in the world is pointless if the insights just collect dust in a dashboard. The final—and most important—step is to put your findings to work. This means building automated, closed-loop systems that actually drive action and ensure the signals you've uncovered lead to real product improvements.
Insights need to flow smoothly from your analysis hub right into the tools your teams live in every day. Manually copying and pasting customer quotes into a development ticket? That's a recipe for mistakes, delays, and a process that no one will stick with for long. A truly effective system closes the loop for you, bridging that critical gap between a customer's problem and your team's solution.
Creating a Direct Pipeline to Development
Your goal here is a direct, automated connection between high-priority feedback and your engineering team's workflow. Modern product intelligence platforms can integrate with tools like Jira, Linear, or Asana to instantly turn a validated customer issue into a development ticket.
Think about it. Your system flags a bug with a $25,000 MRR impact score. Instead of someone having to manually create a report, an automated workflow can fire off a Jira ticket that includes:
- A pre-populated title and description of the bug.
- The revenue impact score so it's prioritized correctly from the get-go.
- Direct quotes from affected customers, giving engineers the raw, unfiltered context they need.
- Links back to the original conversations for anyone who wants to dig deeper.
This way, when an engineer picks up the ticket, they have everything they need without ever leaving their own environment. It removes all the friction and dramatically speeds up the fix cycle by connecting customer pain directly to engineering action.
Keeping Stakeholders Informed with Real-Time Alerts
Not every insight needs a bug ticket, of course. Some trends are more strategic and require the immediate attention of leadership. This is where real-time alerts become your secret weapon, creating a nervous system that pings the right people at exactly the right moment.
You can configure workflows to send targeted notifications based on very specific triggers, essentially creating an early warning system for both risks and opportunities.
An automated alert system transforms feedback analysis from a reactive, backward-looking exercise into a proactive, real-time intelligence function. It empowers teams to act on signals the moment they emerge.
For instance, you could set up an alert that notifies the Head of Product in a dedicated Slack channel whenever a new theme related to churn risk pops up among enterprise accounts. Or maybe another alert notifies the sales team when a feature request blocking a major deal gets mentioned by several high-value prospects.
These automated taps on the shoulder ensure that critical signals never get lost in the noise, driving accountability and a much faster response across the entire company.
Common Questions and Sticking Points
Even with a solid game plan, a few questions always pop up when teams first start connecting customer feedback to revenue. Here are some of the most common ones I hear.
How Can Small Teams Get Started Without Expensive Tools?
You really don't need a huge budget to get this off the ground. My advice? Start small and manual. Pick your top one or two feedback channels—maybe support tickets from Zendesk and call notes from your sales team's CRM—and just consolidate them into a single spreadsheet.
From there, create a basic tagging system. Just simple categories like "bug," "feature request," or "usability issue" will do. It’s not a long-term solution, obviously, but doing this manually for a bit builds the right habits and gives you a gut feeling for what customers are struggling with before you even think about paying for software.
What’s the Single Biggest Mistake to Avoid?
Easy. Treating all feedback as if it's created equal. Too many teams fall into the trap of prioritizing whatever the "loudest" customers are yelling about, simply because the volume of requests is high.
A single feature request from a potential six-figure enterprise client is often more valuable than a similar request from fifty free-tier users. A revenue-driven approach prevents this by tying feedback directly to its business value.
This is the classic "squeaky wheel" problem, and it can send your roadmap in the completely wrong direction.
How Often Should We Be Analyzing This Stuff?
This isn't a quarterly project—it needs to be a continuous habit. The best systems today can process feedback pretty much as it comes in, which means you can spot a new, critical bug almost instantly.
For most teams, a daily or weekly huddle to review the top prioritized issues is a great rhythm. This ensures that what you're learning from customers is constantly feeding back into your development cycle. It’s how you keep your roadmap pointed directly at the most valuable problems to solve.
Ready to turn customer noise into clear, revenue-driving signals? SigOS uses AI to automatically analyze, categorize, and prioritize issues based on their direct financial impact, so your team can focus on what truly matters. See how it works.


Ready to find your hidden revenue leaks?
Start analyzing your customer feedback and discover insights that drive revenue.
Start Free Trial →