A Practical Guide to Analytics for Enterprise Transformation
Discover how to leverage analytics for enterprise transformation. This guide covers strategy, architecture, and real-world use cases to drive business growth.
Alright, let's ditch the jargon and talk about what enterprise analytics actually is. Forget the buzzwords for a moment. Think of it as your company's central nervous system—it’s the strategic process that takes all the raw data floating around your departments and turns it into smart, coordinated action.
This isn't about buying one more piece of software. It's about building a core capability across the entire business to make better decisions, the kind that give you a real edge over the competition.
So, What Is Enterprise Analytics Really About?
Picture a massive orchestra where every musician is a virtuoso, but they're all playing in soundproof rooms. The result? A chaotic mess. Now, bring in a conductor who hears every single instrument, understands how they fit together, and guides the whole group to create a stunning symphony.
That conductor is enterprise analytics. It connects the seemingly unrelated data points from sales, marketing, finance, and operations to reveal the bigger picture—the full story of your business.
Instead of siloed teams making calls based on their own limited slice of information, enterprise analytics gives everyone a unified view. It pulls together different data sources to answer the tough, complex questions that no single team could ever handle alone. This is how you connect customer support tickets with product usage data to get ahead of churn, or directly link marketing campaign spend to the sales revenue it generated.
Beyond Departmental Dashboards
Look, most companies have some form of analytics. The marketing team has their campaign dashboard, sales lives in their CRM reports, and the operations folks are watching their own KPIs. The problem is, this approach creates massive blind spots.
Enterprise analytics is about breaking down those walls. It’s built to deliver cross-functional insights that matter to the entire business.
The whole point is to shift from just reporting on what already happened to building a proactive strategy for what's next. It’s the difference between knowing what happened last quarter and truly understanding why it happened—and, even better, predicting what's likely to happen next. This kind of foresight can only be built on a foundation of clean, accessible, and deeply interconnected data.
An enterprise analytics strategy transforms data from a simple record of the past into a predictive guide for the future, enabling leaders to steer the entire organization with clarity and confidence.
The Strategic Value of a Unified View
When you get this right, a strong analytics program delivers real, tangible business results by creating a single source of truth. This unified perspective helps organizations do three things incredibly well:
- Improve Operational Efficiency: When you can see a process from end to end, you can spot the bottlenecks, cut out the waste, and make your workflows smoother. A retailer, for instance, could connect its supply chain data with sales forecasts to perfect its inventory levels, avoiding both costly overstock and frustrating stockouts.
- Enhance Customer Experience: Imagine integrating customer feedback, purchase history, and product engagement data. Suddenly, you can create hyper-personalized experiences. This might mean proactively offering help to a user who seems stuck or recommending the one product you know they'll love.
- Drive Strategic Growth: Armed with a complete view of the market and your own performance, leaders can spot new opportunities with confidence. It allows you to validate big strategic moves and put your resources where they'll have the most impact. It’s all about making big bets with a much, much higher chance of paying off.
The Architecture of Enterprise Analytics Explained
To really get what enterprise analytics is all about, you need to look under the hood at its architecture. I like to think of it as a sophisticated farm-to-table restaurant. It’s not just about the final meal; it’s about the entire supply chain that gets fresh, high-quality ingredients from the farm, through the kitchen, and onto a diner's plate as a masterpiece. In this case, your data is the raw produce.
The journey starts at the source—the "farm." This is where raw data is generated and gathered from countless systems across your entire organization. We're talking about everything from your CRM and ERP systems to customer support platforms and product usage logs. Each system holds a vital ingredient, but on its own, it’s just one piece of a much larger recipe.
The next step is getting all that produce from the farm to the kitchen. This is the data ingestion phase, where raw data is collected and moved into a central system. This requires solid, reliable pathways—what we call data pipelines—to move information securely and efficiently without spoiling it along the way. If you're curious about the nuts and bolts, our guide on how to build data pipelines is a great place to start.
The Kitchen: Where Data Gets Processed
Once the raw data arrives, it enters the "kitchen"—your central data storage and processing environment. This is where the real magic happens, transforming raw ingredients into something the chefs can actually work with. In a typical enterprise setup, this kitchen comes in one of two forms.
- Data Lake: Picture this as the restaurant's giant walk-in pantry. It stores huge amounts of raw, unstructured data in its native format. It's a massive storage area for every possible ingredient you might ever need, from neat sales figures to messy text from support tickets.
- Data Warehouse: This is more like the organized prep station. A data warehouse holds cleansed, structured, and processed data that's been prepared for specific analytical purposes. It’s where the ingredients are washed, chopped, and organized, ready for your analysts (the chefs) to use in their recipes.
Many modern setups actually use a combination of both. Data gets dumped into a lake first for flexible storage, then refined and moved into a warehouse for high-speed analysis. This hybrid approach gives you the best of both worlds: the sheer scale of a lake and the sharp performance of a warehouse.
The concept map below shows how all these pieces come together to connect various business functions and drive smarter decisions.
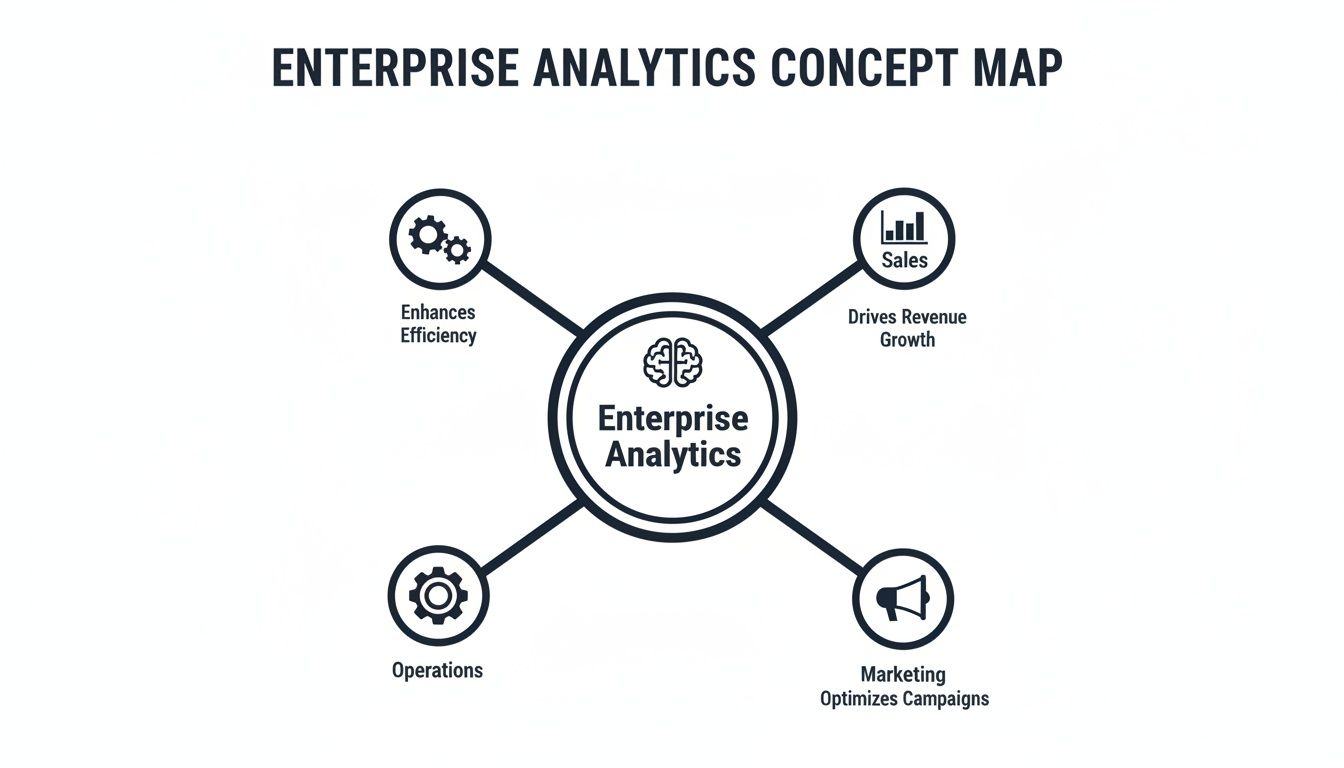
As you can see, the whole point of this architecture is to serve up unified insights to key departments like sales, marketing, and operations.
Serving Insights to the Business
Finally, the prepared data is ready to be served. This is the "front of house," where business users get to consume the finished product. The insights are presented through different tools that make complex data easy to understand and act on.
The ultimate goal of any enterprise analytics architecture is not just to store data, but to transform it into clear, accessible insights that empower people to make smarter decisions, faster.
These insights are delivered through a few key channels:
- Business Intelligence (BI) Tools: These are the dashboards and reports that give you a high-level view of business performance. They serve up key metrics and trends, letting executives monitor the overall health of the company at a glance.
- Specialized Platforms: This is where tools like product intelligence platforms, such as SigOS, fit in. They plug into the broader architecture to provide deep, contextual insights that general BI tools can’t. For example, while a BI dashboard might tell you customer churn is up, a product intelligence tool can dig into user behavior and support tickets to tell you exactly which product issues are driving customers away.
This end-to-end architecture ensures the right data gets collected, processed securely, and delivered to the right people in a format they can actually use. It’s a scalable, secure foundation that turns raw information into a real competitive advantage.
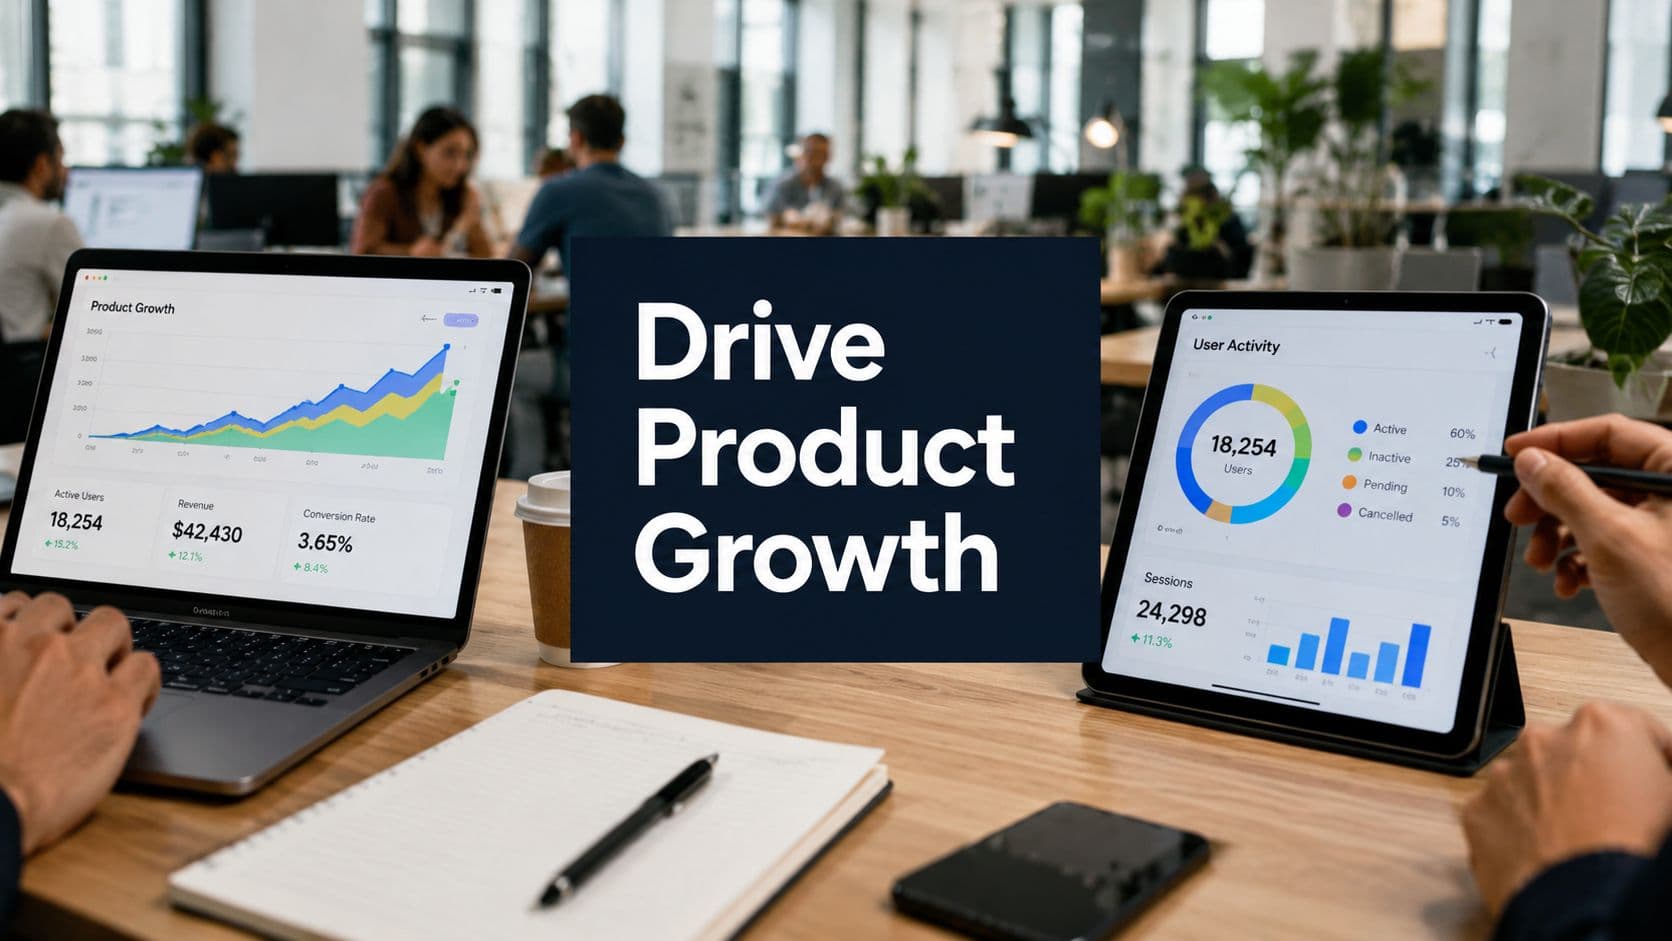
How Enterprise Analytics Drives Real-World Value
It’s one thing to talk about architecture and data models, but the real magic happens when you see enterprise analytics in action. This isn't just an abstract IT exercise; it's about turning raw data into concrete business results that echo through every department.
The end game is always about creating measurable improvements—whether that’s cutting operational costs, creating happier customers, or finding entirely new ways to grow revenue. Let's look at a few real-world examples of how teams are making this happen.

Marketing Hyper-Personalization at Scale
The days of one-size-fits-all marketing campaigns are long gone. With enterprise analytics, marketing teams can finally connect the dots between website behavior, purchase history, and even customer support chats to build incredibly detailed customer profiles.
Think about a retail company for a moment. They can see a customer not only bought running shoes but also spent time reading three blog posts on marathon training. Instead of a generic "shoe sale" email, they can send a highly relevant message with a curated list of marathon gear and a helpful training guide. That’s the kind of personalization that builds genuine brand loyalty.
This strategic approach is paying off big time. Large enterprises now command over 60% of the data analytics market, a sector valued at USD 50.04 billion and projected to explode to USD 658.64 billion by 2034. Companies that get this right often see revenue boosts of 15-25% from personalized strategies and get much better at spotting risks before they become problems.
Predictive Sales Forecasting That Actually Works
For any sales leader, accurate forecasting is the holy grail. Traditional methods often lean too heavily on gut feelings and a quick look in the rearview mirror. Enterprise analytics changes the game by bringing predictive modeling into the mix. By analyzing historical sales data, deal stages, and even external market signals, organizations can forecast future revenue with a level of precision that was once impossible.
A big piece of this involves using advanced techniques to enable Predictive Analytics for Business Growth, which allows teams to make decisions proactively instead of reactively.
For instance, a B2B software company could analyze the DNA of its most successful deals—things like industry, company size, and how the first contact was made. This data feeds a lead-scoring model that automatically flags new leads with the highest probability of closing. Suddenly, the sales team knows exactly where to focus its energy for the biggest impact.
The true value of analytics emerges when it moves from explaining what happened to reliably predicting what will happen next, turning reactive teams into proactive, strategic forces.
Streamlining Complex Operations and Logistics
Operations is where analytics can unlock massive cost savings and efficiency gains. From untangling supply chains to predicting equipment failure, data provides the clarity needed to optimize incredibly complex, interconnected systems.
Take a large consumer packaged goods (CPG) company struggling with high logistics costs. By pulling in data from its truck fleet, warehouse inventory systems, and real-time traffic feeds, it can build a model to optimize delivery routes. The system might flag that certain routes are always delayed on Tuesdays, suggesting smarter alternatives that save both fuel and time.
But this isn't just about being more efficient; it's about preventing disasters before they strike. The same logic applies directly to the factory floor:
- Predictive Maintenance: Sensors on machinery can stream performance data to an analytics platform. The system can then spot subtle signs of trouble that indicate a potential failure, letting the team schedule maintenance before a costly breakdown shuts down the entire production line.
- Inventory Optimization: By linking real-time sales data with supply chain information, companies can keep just the right amount of product on hand. This cuts down on carrying costs and, more importantly, prevents the stockouts that frustrate customers.
To give you a clearer picture, here’s a breakdown of how different departments are putting enterprise analytics to work.
Enterprise Analytics Applications by Department
This table illustrates common use cases and the resulting business impact of enterprise analytics across different organizational functions.
| Department | Primary Use Case | Key Performance Indicator (KPI) Impacted | Example Business Outcome |
|---|---|---|---|
| Marketing | Customer Segmentation & Personalization | Customer Lifetime Value (CLV) | 20% increase in repeat purchases from targeted campaigns. |
| Sales | Predictive Lead Scoring | Lead-to-Close Conversion Rate | Sales team focuses on top 10% of leads, increasing close rates by 15%. |
| Operations | Supply Chain Optimization | On-Time Delivery Rate | 98% on-time delivery achieved by optimizing routes based on real-time data. |
| Finance | Financial Risk Modeling | Days Sales Outstanding (DSO) | Reduced DSO by 10 days through better prediction of late payments. |
| HR | Employee Churn Prediction | Employee Turnover Rate | Proactively addressed flight risks, reducing voluntary turnover by 5%. |
| Product | Feature Usage Analysis | User Engagement & Retention | Identified underused features for improvement, increasing daily active users. |
As you can see, the applications are as diverse as the business itself. Each of these examples highlights how a unified enterprise analytics strategy tears down old departmental silos. By connecting disparate data sources, organizations become smarter, faster, and far more responsive to the world around them.
Your Step-by-Step Implementation Roadmap
Getting an enterprise-wide analytics initiative off the ground can feel daunting. But breaking it down into a clear roadmap makes it not just manageable, but far more likely to deliver real results. The secret is to avoid thinking of it as one giant tech project. Instead, approach it as a series of deliberate, value-focused phases.
The strategy has to come first. The technology is there to serve the business, never the other way around. This roadmap lays out the process in a logical sequence, with each step building on the last, ensuring you create a program that delivers measurable value from the get-go.
Phase 1: Define Your Business Objectives
Before you even think about data, you have to answer one critical question: “What problem are we actually trying to solve?” Without a clear destination, you’re just collecting data for data’s sake. Start by zeroing in on the most pressing challenges or biggest opportunities your organization is facing right now.
Are you trying to slash customer churn by 15%? Find new efficiencies in your supply chain? Or maybe you want to boost cross-sell revenue by finally understanding what makes your customers tick. These specific, measurable goals will become the north star for your entire analytics program.
Nailing this down first ensures every decision you make—from which data to pull to which tools to buy—is tied directly to a tangible business outcome. It gets everyone on the same page and keeps the project from becoming a purely academic exercise.
Phase 2: Assess Your Data Foundation
With your goals set, it's time for an honest look at your raw materials: your data. Think of it like a chef inspecting the pantry before creating a menu. You need to know exactly what ingredients you have, their quality, and where to find them.
This means you’ll need to conduct a thorough audit of your data sources.
- Identify Data Sources: Start by mapping out every system that holds a piece of the puzzle. This includes your CRM, ERP, marketing automation tools, product usage logs, and anything in between.
- Evaluate Data Quality: How good is the data, really? Be critical. Look for inaccuracies, incomplete records, duplicates, and outdated information that needs to be cleaned up or flagged.
- Check for Accessibility: How easy is it to actually get to this data? You might find technical roadblocks or stubborn departmental silos that need to be addressed before you can move forward.
This assessment gives you a realistic baseline. It shows you where you’re strong and shines a light on the foundational work you’ll need to do to support your bigger analytics goals.
Phase 3: Select the Right Technology Stack
Okay, you know your goals and you've audited your data. Now you can finally start thinking about tools. The technology you choose should be a direct answer to your specific needs. It's easy to get distracted by the latest, shiniest platform, but your focus should be on what will effectively solve the problems you defined in Phase 1.
Your tech stack will probably have a few different layers, from a data warehouse for storage to visualization tools for dashboards. This is also where specialized platforms can make a huge difference. A general BI tool might show you high-level trends, but a product intelligence platform like SigOS can dig deep into user behavior to tell you exactly which product flaws are causing churn—directly answering one of your core business questions.
A successful enterprise analytics implementation isn't about having the most tools; it's about having the right tools working together to turn data into clear, actionable answers.
Phase 4: Launch a Pilot Program
Don’t try to boil the ocean. Instead of attempting a massive, company-wide rollout right out of the gate, start with a focused pilot program. This approach dramatically lowers your risk and lets you prove the value of analytics much faster.
Pick a single, high-impact business problem from your list and concentrate all your efforts on solving it for one specific department or team.
This pilot acts as your proof of concept. It’s a chance to test your data pipelines, validate your technology choices, and iron out any kinks in a controlled, low-stakes environment. A successful pilot creates buzz, builds momentum, and makes it much easier to get the buy-in you need for a broader rollout.
Phase 5: Execute a Phased Rollout and Train Users
Once your pilot has proven its worth, you can start expanding. But even now, it’s best to stick with a phased approach. Roll out the analytics solution to one business unit at a time, gathering feedback and making tweaks as you go.
Ultimately, user adoption is the only thing that matters. This makes training absolutely non-negotiable. Don’t just show people how to use a dashboard. Teach them how to ask smart questions of the data and use the answers to make better decisions in their day-to-day work. This focus on data literacy is what separates a company with dashboards from a true data-driven culture.
Phase 6: Continuously Improve and Iterate
Finally, it’s crucial to remember that analytics for enterprise is never "done." It’s a living, breathing process of continuous improvement. Once the system is live and people are using it, the real work of uncovering insights has just begun.
Create a feedback loop where users can request new reports and analysts can share interesting findings. Regularly circle back to your original business objectives to track your progress and look for new opportunities as the business changes. An iterative mindset ensures your analytics program stays relevant, valuable, and woven into the very fabric of your organization.
Choosing the Right Enterprise Analytics Platform
Picking the right technology is one of the most important decisions you'll make on your analytics journey. The platform you choose is the engine for your entire data strategy, so it's critical to look past flashy features and focus on what will actually support your business for years to come.
Think of it like buying a car for a long road trip. A zippy little city car might be fun for quick errands, but for a cross-country haul, you need something else entirely. You need a vehicle that's reliable, can handle any terrain you throw at it, and has plenty of room to grow. Your enterprise analytics platform is no different—it has to be tough enough to handle the demands of a complex organization.
Core Evaluation Criteria
When you start looking at options, you need a consistent set of criteria to measure them against. This is the only way to make sure you're deciding based on long-term value, not just a slick demo. Your evaluation should really zero in on a few non-negotiable pillars.
- Scalability and Performance: Can this thing grow with you? It absolutely must handle more and more data and users without grinding to a halt.
- Ease of Integration: How well does it play with others? You need seamless connections to your existing systems—your CRM like Salesforce, your ERP like SAP, and other critical tools—to build a truly unified data ecosystem.
- User Experience (UX): A great platform has to serve two very different crowds. It needs the horsepower for your data analysts but also has to be simple enough for business users who just need to get answers without learning to code.
That dual-audience requirement is where a lot of platforms stumble. If a tool is so complex that only a handful of experts can use it, you’ll never get the widespread data adoption you're aiming for.
Security, Governance, and Total Cost of Ownership
Beyond the core features, three other factors are absolutely vital for any enterprise-level deployment. Think of these as the guardrails that keep your data safe, reliable, and affordable.
First up, robust security and compliance features are non-negotiable. The platform must give you granular access controls, strong encryption, and clear audit trails. This isn't just about protecting sensitive information; it's about meeting regulatory standards like GDPR.
Second, you have to look at the Total Cost of Ownership (TCO), which is way more than just the sticker price. You need to factor in the costs of implementation, training, ongoing maintenance, and even hiring specialized talent. This is where cloud-based subscription models have really changed the game. The global business analytics market, which already hit USD 96.6 billion, is projected to more than double to USD 196.5 billion by 2033. A big reason for that growth is that cloud solutions can slash upfront costs by up to 70% compared to old-school on-premise setups.
Finally, consider a more modern approach: the composable analytics stack. Instead of being locked into one massive, do-it-all platform, many companies now combine a general-purpose BI tool (like Power BI or Tableau) with more specialized solutions. This is exactly where a product intelligence tool like SigOS fits in. While your BI platform gives you the 30,000-foot view, SigOS lets you zoom in on granular user behavior, connecting things like support tickets to actual usage data to reveal why customers are churning. Our guide on the best predictive analytics software can help you get a better handle on these kinds of specialized tools.
The best analytics platform isn't just a tool for looking at dashboards. It's a strategic asset that plugs into your business, scales without breaking a sweat, and empowers everyone to make smarter, data-backed decisions.
Mastering Data Governance and Security

Powerful data comes with serious responsibilities. Strong data governance and security aren’t just bureaucratic hoops to jump through; they're the very foundation of trust for any successful enterprise analytics program. Without them, even the most impressive dashboards are built on quicksand, leading to bad decisions and exposing the entire organization to risk.
This framework is all about making sure your data is accurate, consistent, and used ethically across the company. It creates a system where everyone knows the rules of the road, which naturally builds confidence and encourages people to actually use the insights you generate.
Building Your Governance Framework
Good governance starts by answering some basic questions about your data. Who owns it? How do we define quality? Who gets to see what? Establishing clear ownership, defining quality standards, and controlling access are essential for making sure your information is both reliable and protected. This is how you avoid the classic "garbage in, garbage out" problem that derails so many analytics projects.
To build a solid framework, you need to focus on these core pillars:
- Data Ownership: Assign a clear owner for every critical data set. This person is the go-to for its accuracy, timeliness, and proper use.
- Quality Standards: Define exactly what "good" data looks like. This means setting standards for completeness, accuracy, and consistency across all your different systems.
- Access Controls: Implement role-based access so people only see the data they absolutely need for their jobs. This is fundamental for protecting sensitive information.
Following clear protocols for how data flows between systems is crucial. You can dive deeper into managing these connections by exploring data integration best practices.
A well-defined governance strategy is the immune system of your analytics program. It actively protects against bad data, ensures compliance, and builds the trust necessary for true data-driven decision-making.
Fortifying Data Security and Ensuring Compliance
Beyond governance, robust security is completely non-negotiable. A key part of any serious enterprise analytics strategy involves focusing on enterprise data security practices to protect sensitive information and ensure you're meeting regulatory requirements. This means putting a multi-layered defense in place to safeguard data whether it's sitting in a database or moving across the network.
This focus is especially critical as large enterprises continue to pour money into the big data and business analytics market, a sector projected to be worth over USD 309.68 billion by 2025. In regulated industries, analytics tools are not only vital for navigating complex laws like GDPR but also for finding hidden revenue opportunities within those constraints.
When you embed strong security and governance from the very beginning, you build an enterprise analytics program that is not only powerful but also responsible and trustworthy.
Common Questions About Enterprise Analytics
Even with a perfect roadmap, you're going to hit some practical bumps and questions along the way. That's just part of building a serious analytics program. Let's tackle some of the most common challenges leaders face head-on—getting these answers straight builds confidence and keeps everyone on the same page.
How Do We Measure the ROI of Our Analytics Program?
This is the big one. To get a real measure of return on investment for enterprise analytics, you have to stop thinking like an IT department and start thinking about business results. Forget tracking things like dashboard usage—that's a vanity metric. Instead, tie every single effort back to the business KPIs you set out to improve from day one.
Let’s say your goal was to knock down customer churn. The ROI calculation here is actually pretty clean. You simply measure the revenue you saved by preventing customers from leaving after you rolled out your analytics initiative. The math looks like this: (Revenue Saved from Reduced Churn - Total Cost of Analytics Program) / Total Cost of Analytics Program. That's a number your CFO will understand.
What Is the Difference Between BI and Enterprise Analytics?
It's easy to get these two mixed up, but the distinction is crucial. The simplest way to think about it is that Business Intelligence (BI) is descriptive—it tells you what happened in the past. Enterprise analytics goes much further; it's diagnostic, predictive, and prescriptive. It tells you why something happened, what’s likely to happen next, and most importantly, what you should do about it.
Business Intelligence reports on the past, often from a single department’s viewpoint. Enterprise Analytics connects data from the entire organization to predict the future and guide strategic action.
BI tools often live in their own little worlds, like a sales dashboard that only shows sales data. True enterprise analytics breaks down those walls. It connects sales figures with marketing campaign costs and actual product usage data to answer the really complex, high-value questions that span the whole company.
How Can We Build a Data-Driven Culture That Sticks?
You can't buy a data-driven culture with a new software license. It's built on people, starting with leadership. When executives and managers consistently use data to back up their decisions in meetings, everyone else takes notice. That one habit sets a powerful example for the entire organization.
From there, you need to focus on data literacy for everyone, not just your team of analysts. Offer practical training that teaches people how to ask good questions of the data and make sense of the answers. Finally, make the insights impossible to ignore by serving them up in user-friendly tools. The culture sticks when data stops feeling like a chore and starts feeling like an indispensable guide for doing your job well.
What Are the Most Common Implementation Roadblocks?
Nine times out of ten, the biggest hurdles have nothing to do with technology. The real roadblocks are almost always about people and processes. Here are the usual suspects:
- Poor Data Quality: The old saying holds true: "Garbage in, garbage out." If your foundational data isn't clean and reliable, even the most advanced platform will produce useless insights.
- Lack of Clear Objectives: Kicking off an analytics program without a specific business goal is like setting sail without a destination—it's just a very expensive experiment.
- Resistance to Change: Don't underestimate inertia. Teams that have run on gut-feel and instinct for years can be deeply skeptical of trusting data over their own intuition.
- Siloed Information: When departments hoard their data, they kill the potential for discovery. The most powerful insights come from connecting the dots across the business, which is impossible when data is locked away.
Ready to turn your customer feedback into a powerful, revenue-driving asset? SigOS is the AI-driven product intelligence platform that connects support tickets, sales calls, and usage metrics to pinpoint the issues costing you money and the features that will drive growth. Learn more about SigOS.
Keep Reading
More insights from our blog
Ready to find your hidden revenue leaks?
Start analyzing your customer feedback and discover insights that drive revenue.
Start Free Trial →