Automated Pattern Recognition Guide for Product Teams
Learn how automated pattern recognition turns customer feedback into revenue signals, with practical algorithms, evaluation metrics, and deployment strategies

On Tuesday morning, a product manager scans the previous night's support queue and sees the same phrases repeating: “export broke,” “stuck at 47%,” and “CSV missing rows.” No one manually tagged the tickets, yet the cluster points to a feature released three weeks earlier. By Wednesday, the same language appears in call transcripts from the same account.
That's the practical promise of automated pattern recognition. Software examines feedback, behavior, and telemetry, then surfaces recurring structures that a team would struggle to find by hand. The useful question isn't whether a model can identify a pattern. It's whether your team can decide which signal deserves action, which alert can wait, and which false positive or missed event the business can afford.
What Automated Pattern Recognition Means for Product Teams
Automated pattern recognition turns raw operational data into prioritized product signals. It can group support tickets by meaning, identify a sequence of behaviors that often precedes expansion, or flag a usage change that appears before an incident reaches a status page.
A conventional analytics dashboard answers questions someone already anticipated. It shows ticket volume, feature adoption, or login activity according to predefined dimensions. Pattern recognition works upstream of that reporting layer. It helps discover structures the team didn't explicitly define, including new language clusters, unusual behavior, and relationships across sources.
A useful product-team definition is:
Automated pattern recognition is software that finds recurring, sequential, linguistic, or anomalous structures across customer data so teams can triage revenue and product risk.
That definition matters because product teams don't deploy models for mathematical elegance. They deploy them to make decisions.
Three outputs that matter
A production system should produce an artifact someone can act on:
- A churn-risk cluster: Related tickets reveal that customers are struggling with exports, even though they describe the problem in different words.
- An expansion phrase: Sales and success transcripts contain repeated requests for data residency or higher limits from accounts approaching renewal.
- A usage anomaly: A cohort's committed workflow drops sharply, giving engineering time to investigate before customers flood support.
The system may use embeddings, clustering, sequence models, or anomaly scoring internally. The product team experiences the result as a ranked queue, a linked issue, a customer segment, or an alert with supporting evidence.
Teams evaluating the concept can use this practical explanation of pattern recognition as a foundation, but the deployment decision should remain operational. Ask what enters the pipeline, what leaves it, and who owns the next step.
Automated pattern recognition differs from an open-ended data science project because it has a defined decision loop. It also differs from a dashboard because it can surface previously unknown groupings and connect signals across text, behavior, and telemetry. The output isn't merely “something changed.” It's a defensible reason to investigate a specific customer, issue, cohort, or opportunity.
How the Field Evolved Into Today's Product Intelligence Stack
A support dashboard can show a spike in export complaints, while call transcripts and usage logs reveal the same issue elsewhere. Connecting those signals comes from several decades of work across statistical computing, engineering, speech, handwriting, chemistry, and machine learning. Historical surveys place early computer pattern-recognition systems in the 1950s and 1960s, followed by the first international joint conference on pattern recognition in 1973 and the creation of the International Association for Pattern Recognition in 1978 (EBSCO's historical overview).
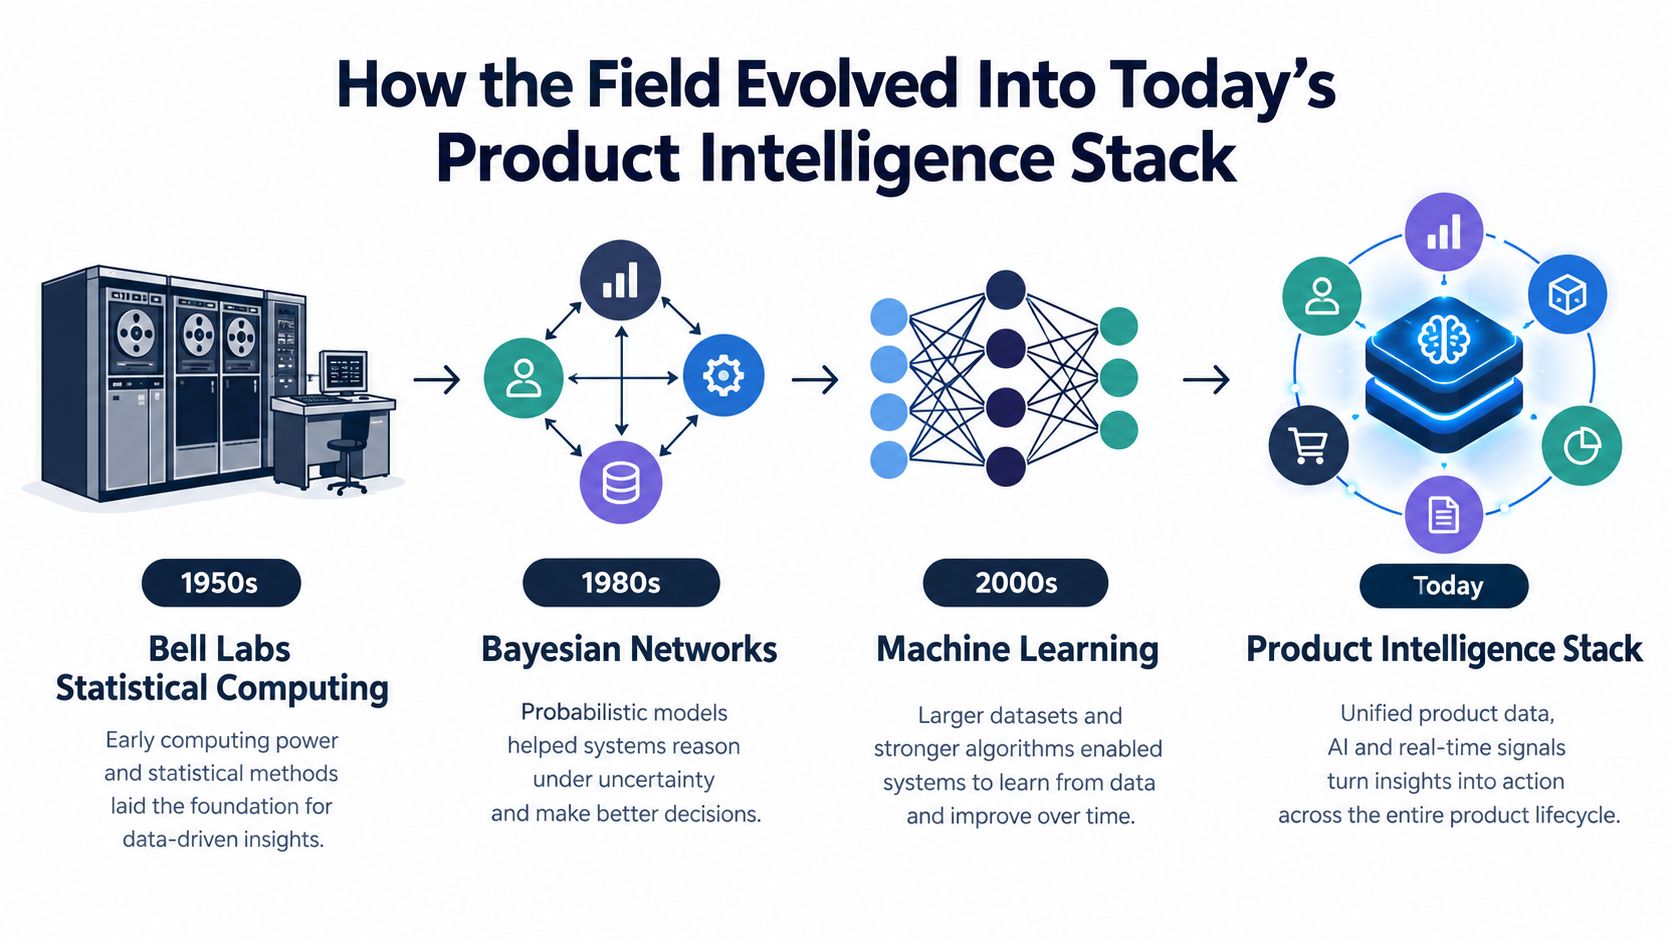
One important inheritance is probabilistic sequence modeling. A historical account of automatic speech recognition describes the 1980s shift from template-based methods toward Hidden Markov Models, as greater computing capacity supported more capable statistical approaches (review of automatic speech recognition history). Product teams apply the same broad idea to call routing, conversation intent, and ordered customer behaviors.
Neural methods created another bridge. The 1989 landmark involving Yann LeCun's neural-network approach to distinguishing handwritten cheque digits shows how systems could learn useful representations from inputs rather than relying entirely on hand-built rules. Modern embedding systems carry that principle into product data. They can group different expressions of the same problem, although teams still need to check whether a similarity is meaningful enough to drive revenue triage.
Why the history matters now
Today's product intelligence stack combines these lineages. Sequence models interpret ordered actions, learned representations compare meaning, and statistical methods identify departures from expected behavior. Together, they can connect “export failed” in a ticket with an incomplete workflow in product analytics and a renewal risk in the account record.
The practical question is which errors the team can afford. A noisy expansion signal may waste account-manager time, while a missed usage decline can delay intervention until renewal risk is harder to address. That is the operating context for automated insight generation for product teams. Vendors may present the capability as a new feature, but the foundations are cumulative. Evaluate the evidence, workflow fit, and cost of false positives and false negatives before judging the interface.
Core Algorithms Powering Modern Pattern Detection
No single algorithm family covers product feedback well. Tickets contain language, calls contain sequences and intent, and usage data contains time-dependent behavior. A reliable stack matches each input to the method that can represent it, then connects the outputs in a shared workflow.
Four families teams actually use
Clustering groups records by similarity. K-means works when teams can define a suitable number of groups and the data has reasonably clear structure. DBSCAN can surface dense groups and outliers without forcing every record into a cluster, while hierarchical methods help teams inspect relationships at multiple levels. Embedding-based clustering compares semantic meaning, so “CSV drops records” and “exported file is incomplete” can land together even when keyword overlap is limited.
Sequence mining looks at order. PrefixSpan, Markov chains, and transformer sequence models can represent paths such as viewing pricing, encountering an export limit, and opening multiple support requests. The output should be a pathway or cohort view, not a mysterious score.
Anomaly detection identifies observations that depart from a baseline. Isolation Forest can isolate unusual records, autoencoders can flag poor reconstruction, and statistical control charts can monitor stable operational measures. For time-series work, teams may also compare approaches such as detecting anomalies with ARIMA and Prophet, especially when seasonality and trend affect the baseline.
Natural language processing extracts structure from unstructured text. Topic models, named-entity recognition, sentence embeddings, sentiment-shift analysis, and zero-shot classifiers can identify intents, product names, competitors, and emerging complaints across tickets and transcripts.
| Algorithm Family | Best Feedback Input | Product-Team Output | Typical Failure |
|---|---|---|---|
| Clustering | Tickets, reviews, transcripts | Theme or issue clusters | Groups look coherent but mix different severities |
| Sequence mining | Event streams and account journeys | Behavioral pathways | Correlation gets mistaken for intent |
| Anomaly detection | Usage metrics, telemetry, logs | Outlier or incident alerts | Normal seasonality appears abnormal |
| NLP pattern methods | Calls, chats, support text | Intent, topic, entity, and sentiment signals | Ambiguous language produces unstable labels |
The dashboard view should reflect the method. A cluster needs representative examples and affected accounts. A sequence needs ordered events and a time window. An anomaly needs a baseline, deviation context, and comparable cohorts. An NLP result needs source excerpts, not just a category label.
Most production systems blend at least two families. A support cluster becomes more valuable when it connects to declining feature use, and a usage anomaly becomes more actionable when related tickets explain what customers are experiencing. Teams can explore this combined approach through real-time anomaly detection, but they should still validate whether each surfaced relationship supports a real decision.
Data Requirements and Preprocessing for Reliable Signals
Pattern recognition fails when the input data is inconsistent. A model may return confident clusters and rankings while reflecting duplicated tickets, timestamp errors, or a biased slice of customer behavior.
Start with the sources your team already operates. Zendesk and Intercom provide tickets and conversations. Gong and similar call systems provide transcripts. Amplitude and Mixpanel provide product events. Application logs, billing records, account attributes, and CRM data add context that helps distinguish a noisy complaint from a revenue-relevant pattern.
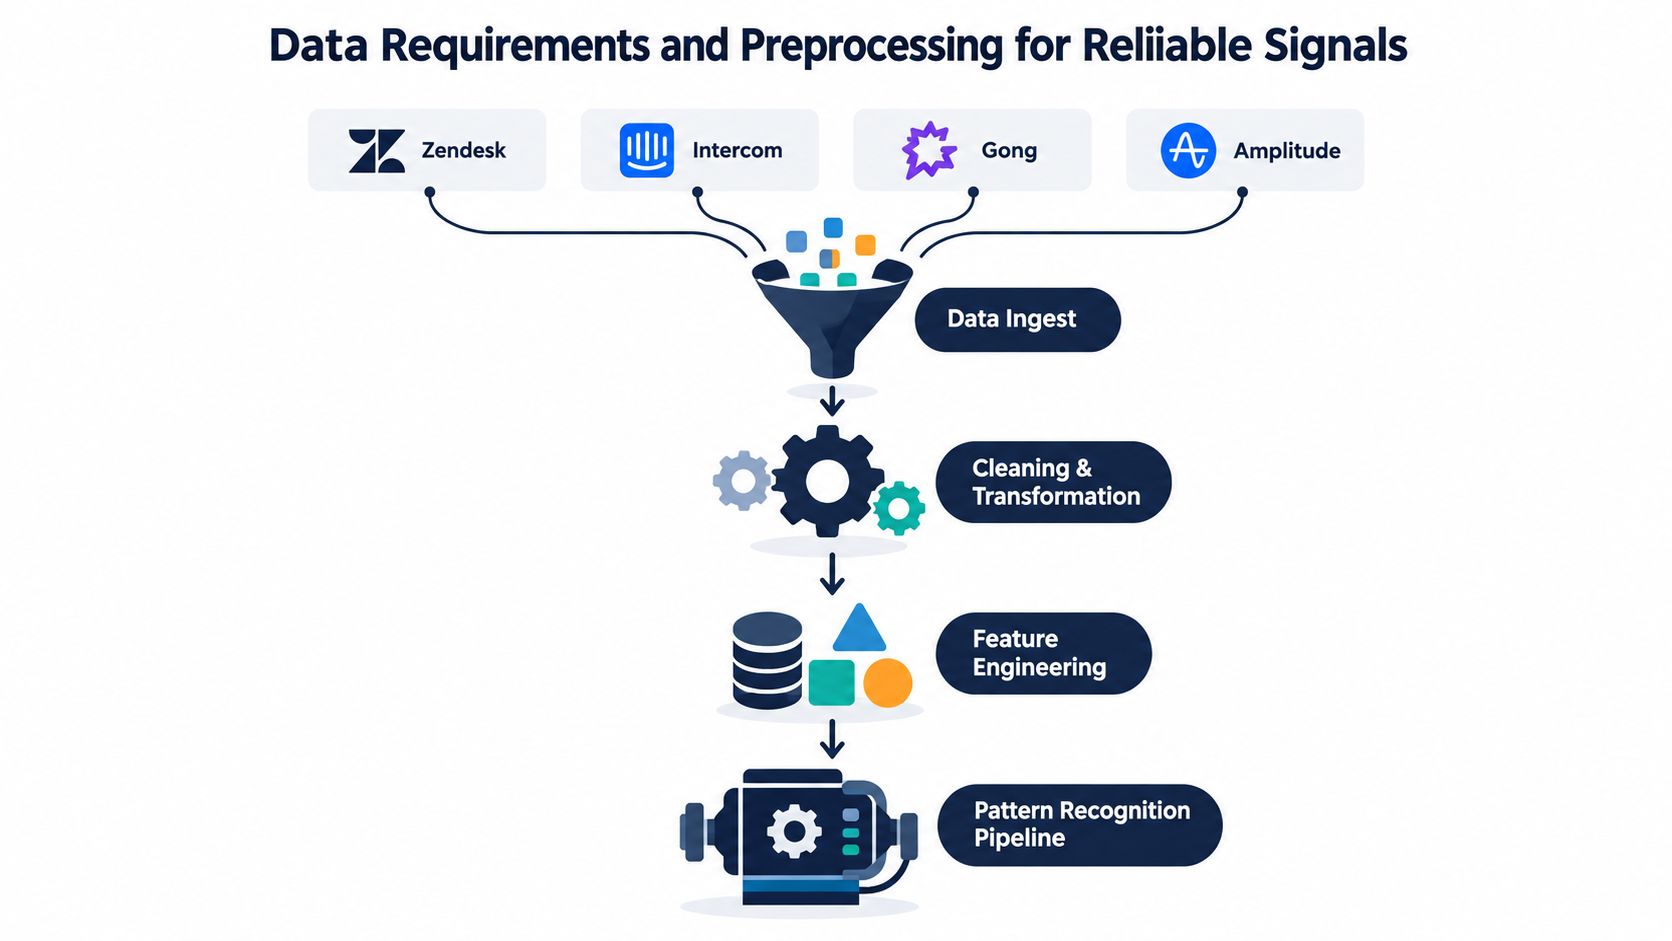
Raw records aren't model-ready. Support systems often merge follow-up messages into one thread. Call transcripts contain filler words, speaker overlap, and transcription mistakes. Product analytics mixes exploratory clicks with committed actions. Without preprocessing, the model can learn volume, formatting, or ingestion artifacts instead of customer intent.
Decisions that protect signal quality
- Redact sensitive data at ingestion: Remove or tokenize personal and confidential fields before downstream processing.
- Detect language early: Route multilingual content through suitable processing and avoid treating translation artifacts as new themes.
- Deduplicate complaints: Repeated tickets, copied messages, and automated follow-ups can inflate apparent severity.
- Normalize timestamps: Align event time, ticket time, call time, and account time zones before building sequences.
- Aggregate at the right level: Session-level and account-level features often represent intent better than isolated clicks.
- Use meaningful windows: Ticket velocity over a defined period can reveal escalation, while a single ticket count may only reflect an active support process.
One common mistake is training on support volume alone. Five low-severity questions can outweigh one urgent account-blocking defect unless the pipeline includes severity, affected workflow, account value, and resolution state.
Another is relying only on happy-path events. Edge-case bugs often appear in incomplete flows, retries, unusual permissions, or specific integrations. A model that sees only successful journeys won't recognize the behavior that precedes a failure.
Use this practical checklist before model selection:
- Confirm source ownership and refresh timing.
- Redact personal data before feature generation.
- Remove duplicates and merged-thread artifacts.
- Reconcile timestamps across systems.
- Define account, user, session, and event-level entities.
- Label outcomes separately from inputs.
- Inspect rare classes and missing values.
- Preserve representative raw examples for review.
A short walkthrough can help stakeholders understand the pipeline's mechanics:
The final test is practical. Can a product manager trace a surfaced pattern back to the records, transformations, and outcome definition that produced it? If not, the pipeline may be technically active but operationally untrustworthy.
Evaluation Metrics and the Precision-Recall Trade-Off
Product teams should select metrics according to the cost of acting on an alert or missing one. Precision measures the share of flagged records that are relevant. Recall measures the share of relevant records the system catches. F1 balances both when raising one tends to reduce the other.
A model with 99.35% precision and 68.12% recall produces a very different work queue from one with 74.91% precision and 96.41% recall, as shown in a survey of IoT and sensor anomaly detection (precision and recall examples in anomaly detection). The first gives analysts a cleaner queue but misses more events. The second catches more genuine events while creating substantially more noise to investigate.
For revenue triage, the right threshold depends on the workflow. A customer-success team funding costly save motions may choose fewer, better-supported alerts. An engineering team watching for regressions may accept more false alarms because missing the first evidence of an incident costs more.
Evaluate the interval, not only the timestamp
Many product signals unfold across a window. Declining usage may emerge over several days, while an incident can affect a sequence of logs rather than one event. Range-based evaluation gives partial credit when the system identifies the correct episode slightly early or late. A timestamp-only score can treat that near miss as a complete failure.
The MLSys research defines temporal precision and recall for ranges as TP/(TP+FP) and TP/(TP+FN) (range-based anomaly detection). That approach better matches how product teams review episodes, clusters, and account-level patterns.
Set thresholds by the decision the alert will trigger:
- Outbound save campaigns: Favor higher precision because each alert may start human outreach.
- Early bug detection: Favor higher recall when a missed regression costs more than extra investigation.
- Expansion discovery: Use a balanced threshold, then require account context before sales action.
- Support routing: Optimize for the cost of misrouting, not only correctly classified tickets.
| Use Case | Precision Priority | Recall Priority | Threshold Strategy | Operational Impact |
|---|---|---|---|---|
| Churn-risk outreach | High | Moderate | Raise threshold and require evidence | Smaller queue for customer-success review |
| Incident detection | Moderate | High | Lower threshold with deduplicated alerts | Earlier investigation with more noise |
| Expansion signals | Balanced | High | Combine score with account context | More opportunities, human qualification required |
| Ticket routing | High enough to protect teams | Relevant for critical queues | Tune by intent and severity | Fewer misrouted cases |
A benchmark from a major bank reported an 87.1% reduction in false positives after adopting AI for payment-fraud detection (reported false-positive reduction and adversarial findings). The practical lesson is broader than the headline result. Thresholds and workflow design can reduce wasted investigation, while detection quality determines which revenue or reliability signals reach the team.
Evaluate precision and recall on a time-based holdout. Inspect the precision-recall curve, then review records at the proposed threshold with the people who will act on them. A leaderboard score cannot show whether the customer-success queue is usable on Monday morning, whether engineering can group repeated alerts, or whether a missed signal would have changed a decision. Metrics become useful when they expose that operating trade-off.
Deployment Choices From Real-Time Streams to Secure Batch Jobs
Latency should follow the decision window. Real-time scoring makes sense when a signal loses value quickly, such as a live coaching prompt or an onboarding nudge. Batch scoring fits decisions that depend on broader context, such as nightly churn ranking, recurring usage reviews, or archive-wide theme analysis.
A real-time pipeline usually ingests an event, computes features, scores the record, and routes the result into an existing workflow. The challenge isn't only response time. It's keeping features consistent between online and offline systems, preventing duplicate alerts, and making sure a transient event doesn't become a permanent customer label.
Batch jobs trade immediacy for reproducibility. A scheduled process can rebuild features from a known data snapshot, compare results across periods, and provide a stable audit trail. That makes batch a strong default for product intelligence, where account-level evidence often improves a score more than instant delivery does.
Put the result where teams already work
A pattern that requires a new dashboard rarely gets acted on consistently. Push scored tickets into Zendesk views, create engineering work in Linear or Jira only after human review, and deliver deduplicated anomaly summaries through Slack. Looker and Mode can provide exploration, while the operational system should hold the decision and its evidence.
Security needs to cover the full inference path. Encrypt transcript content at the field level where appropriate, isolate tenants in multi-customer SaaS systems, and document how EU customer data is processed under GDPR and how applicable personal data is handled under CCPA. If an automated score influences an account action, retain the input references, model version, threshold, reviewer, and final decision.
Deployment rule: A fast alert without evidence creates faster confusion. Every production signal needs a traceable source and an owner.
Model updates should start in shadow mode. Compare the candidate against the current model, review changes in precision and recall, monitor drift after release, and keep a rollback path. A model that performs well in testing can degrade when ticket language, product workflows, or customer mix changes.
Product Use Cases and ROI Scenarios You Can Defend
The strongest business case starts with a decision, not an algorithm. A product leader can defend a pattern-recognition project when the team can name the input, the action, the owner, and the avoided or created value. Without those four pieces, an attractive cluster is still just a research artifact.
Consider a B2B SaaS support pipeline. Clustering can group recurring Zendesk tickets around an undocumented feature gap, then connect that issue to affected accounts and renewal status. The defensible output isn't “the model found a topic.” It's a prioritized product issue with representative tickets, account context, and a measurable follow-up plan.
A second scenario uses call-transcript NLP. The system extracts repeated requests, product mentions, and changes in customer language, then routes likely expansion signals to the account team. The model shouldn't create an opportunity automatically. It should give the account owner a concise evidence set to qualify against current usage, contract terms, and customer intent.
A third scenario comes from usage telemetry. Anomaly detection can flag a billing-related workflow that diverges from its normal baseline. Engineering and finance can inspect the event path, reproduce the issue, and determine whether customers were affected before the problem becomes a larger support pattern.
Build the finance case around action
| Use Case | Algorithm | Detection Lag | Revenue Impact | Payback |
|---|---|---|---|---|
| Recurring support issue | Clustering with account enrichment | Batch or near-real-time | Protects renewals by prioritizing product fixes | Depends on validated retention value |
| Expansion language in calls | NLP and sequence analysis | Near-real-time or scheduled | Gives sales qualified evidence for follow-up | Depends on conversion and account economics |
| Billing or workflow regression | Time-series anomaly detection | Real-time or short batch interval | Prevents avoidable customer harm and remediation work | Depends on incident severity |
The model's score shouldn't be the business case. Finance needs a comparison between the cost of review and the expected value of acting on qualified signals. Track how many surfaced patterns receive human confirmation, how often the resulting action changes an outcome, and whether the same issue reappears after remediation.
SigOS is one product-intelligence option that correlates support tickets, conversations, sales calls, and usage metrics to surface patterns associated with churn and expansion, with integrations that can route findings into product workflows. Teams should evaluate it alongside other tools using their own data, governance requirements, and precision-recall targets.
The practical payback window comes from closing the loop. A system that creates clusters but never changes prioritization won't produce defensible ROI. A smaller system that reliably changes which customer gets contacted, which bug gets fixed, or which feature gets validated can.
Pitfalls, Trust Signals, and a Best-Practice Checklist
A detector can surface a genuine correlation and still trigger the wrong business response. Operating conditions may have changed, evidence may be incomplete, or the team may be unable to explain an alert beyond its confidence score. Automated analysis can improve detection while outcomes remain flat when the system does not show why it flagged a pattern (discussion of trust and operating-regime validity).
False positives also shift with data quality and attack conditions. In one reported scientific-data experiment, adversarial conditions produced false positives throughout the test, while an AI payment-fraud deployment substantially reduced false positives. The practical lesson is to judge each system against its intended workflow, review cost, and acceptable error mix, rather than treating model performance as universal.
Use this checklist before expanding deployment:
- Audit weekly: Review precision by segment, source, and alert type.
- Deduplicate routing: Stop one underlying issue from creating repeated notifications.
- Assign an owner: Give each recurring pattern a named product, success, or engineering owner.
- Preserve evidence: Store representative records and the model version behind every alert.
- Test drift: Recheck performance after product, policy, language, or customer-mix changes.
- Keep humans involved: Treat alerts as triage hypotheses, not automatic-action conclusions.
A trustworthy alert is reproducible, explainable, and tied to a decision someone owns.
Revenue triage makes the trade-off explicit. Finance should compare review cost with the expected value of acting on qualified signals. Track human confirmations, outcome changes after action, and recurrence after remediation. The business case is the prioritization change, not the model score.
SigOS correlates support tickets, conversations, sales calls, and usage metrics to surface patterns associated with churn and expansion, with integrations that can route findings into product workflows. Evaluate it with other tools against your data, governance requirements, and precision-recall targets. A smaller system that changes who gets contacted, which bug gets fixed, or which feature gets validated can produce more defensible ROI than a larger detector that only creates clusters.
Start with existing feedback and usage sources, then use SigOS to connect recurring language and behavioral changes to churn, expansion, and product priorities. Visit SigOS to review an AI-driven product intelligence workflow for revenue-focused actions.
Keep Reading
More insights from our blog



Ready to find your hidden revenue leaks?
Start analyzing your customer feedback and discover insights that drive revenue.
Start Free Trial →