Real time anomaly detection for SaaS Growth: A Practical Guide
Real time anomaly detection insights for SaaS growth: explore algorithms, pipelines, and use cases to reduce churn and uncover opportunities.

At its core, real-time anomaly detection is about finding the weird stuff in your data the moment it happens. It’s the art of spotting data points that don't fit the expected pattern within a non-stop stream of information, letting you catch problems or opportunities right away, not hours or days later.
Why Real-Time Anomaly Detection Is Your SaaS Superpower

Here's a way to think about it. Imagine your SaaS platform is a huge, modern electrical grid that powers thousands of customers. A traditional analytics setup is like getting outage reports at the end of the day to see which neighborhoods went dark.
Real-time anomaly detection, on the other hand, is like having an operator in the control room who sees a single transformer’s voltage dip and acts before it can trigger a city-wide blackout.
This isn’t just a nice-to-have anymore; it's a critical competitive edge. For a SaaS business, just a few hours of poor performance, a buggy feature launch, or a missed growth opportunity can mean losing customers and taking a serious hit to your reputation.
From Noisy Data to Actionable Signals
Your platform is constantly churning out data—user clicks, feature adoption rates, support ticket submissions, API call volumes, you name it. Trying to find a meaningful signal in that mountain of noise by hand is a fool's errand. Real-time anomaly detection automates this, acting as a tireless sentinel for your business.
It cuts through the chaos and turns high-volume data into clear signals by constantly asking important questions:
- Is user engagement with a core feature suddenly tanking?
- Are error rates for a specific customer group spiking?
- Are we seeing a surge in support tickets that mention a competitor by name?
The bedrock of any good real-time anomaly detection system is solid continuous monitoring. You need that constant, reliable stream of data to fuel the analysis engine.
This is what makes it a superpower. It fundamentally flips your entire team’s posture from being reactive to proactive. Instead of analyzing why customers churned last month, you get an alert on the leading indicators—like rage clicks or failed payments—so you can step in and save the account. Instead of finding out about a critical bug from angry tweets, you’re notified the instant usage patterns go sideways after a release.
The Business Case for Instant Insight
The financial argument for this kind of technology is impossible to ignore. The global anomaly detection market is expected to jump from USD 5.66 billion in 2024 to USD 19.4 billion by 2031.
For a SaaS company, that investment is all about protecting revenue. When you can quickly spot a feature bug that lines up with a 15-20% revenue dip, your team can prioritize a fix that has a direct, measurable financial impact. You can get more details on this trend from this global market growth report.
Ultimately, real-time anomaly detection forges the crucial link between raw operational data and real-world business results. When you learn how to harness these instant insights, you can build a more resilient product, safeguard your revenue, and find growth opportunities you never knew were there. To explore this further, take a look at our guide on https://www.sigos.io/blog/real-time-data-analytics.
Understanding the Core Anomaly Detection Algorithms
So, how does a system actually spot anomalies in real time? It’s not magic—it’s all about picking the right tool for the job.
Think of it like choosing a security system for your house. You could install simple tripwires on the doors and windows. They’re straightforward and effective at catching obvious intrusions. Or, you could install smart cameras that use AI to learn your family's daily routines, ignoring the mail carrier but flagging an unfamiliar person lingering by the garage.
The engines that power real-time anomaly detection work in a similar way. They range from simple statistical rules to highly sophisticated machine learning models. Each approach has its place, and knowing the difference helps you understand what’s happening under the hood. For product leaders, this demystifies the technology and empowers you to ask the right questions when choosing a solution.
Statistical and Streaming Methods
The most straightforward approach involves statistical methods. These are the "tripwires" of anomaly detection. They use proven mathematical principles to define a normal range and flag anything that falls too far outside of it.
You'll often see techniques like:
- Z-Score: This measures how many standard deviations a data point is from the average. A high score means it's a statistical outlier. Simple, but effective.
- Interquartile Range (IQR): This method focuses on the middle 50% of your data and flags points that fall drastically above or below that central cluster.
These methods are computationally light, making them perfect for streaming algorithms that need to process data with sub-second latency. They work beautifully for predictable, high-volume metrics like API response times or server CPU usage, where "normal" is a well-defined and stable baseline.
Supervised and Unsupervised Machine Learning
But what happens when the patterns are more subtle and complex? That’s when teams turn to machine learning (ML). This is like installing that intelligent security camera that actually learns from what it sees. ML models can be broadly split into two camps: supervised and unsupervised.
A supervised model is trained on historical data you’ve already labeled. You essentially show it past examples of what you're looking for—like data from customers who churned—and it learns to recognize those specific fingerprints in new, incoming data. This is incredibly powerful for tracking known issues you want to monitor closely.
Unresolved anomalies are a silent killer for SaaS growth. Studies show they contribute to 22% of customer churn, but implementing real-time detection can flip that into a 12% gain in retention. This underscores the immense business value of these algorithms. You can explore more data on the rapidly growing anomaly detection market from Precedence Research.
Unsupervised models, on the other hand, are built to find the "unknown unknowns." They don't need labeled data to get started. Instead, they analyze your data, learn the baseline of normal behavior on their own, and flag anything that deviates. This is how you discover entirely new types of fraud, emerging customer friction points, or unexpected software bugs you never knew existed. You can also explore our guide on using similar techniques for predicting customer churn before it happens.
The choice isn't about which algorithm is universally "better," but which one solves your specific problem right now.
Choosing Your Anomaly Detection Algorithm
To make the right choice, you need to weigh the trade-offs between different approaches. This table breaks down the most common methods to help you decide which one best fits your data and your goals.
| Algorithm Type | Best For | Pros | Cons |
|---|---|---|---|
| Statistical | Predictable, high-volume metrics (e.g., latency, error rates) where "normal" is stable. | Fast, computationally cheap, easy to interpret and implement. | Struggles with complex or seasonal patterns; can be too rigid. |
| Supervised ML | Detecting known, specific problems (e.g., a specific type of churn signal or fraud). | High accuracy for the problems it's trained on; great for targeted monitoring. | Requires a large amount of clean, labeled historical data; can't find new types of anomalies. |
| Unsupervised ML | Discovering new and unexpected issues ("unknown unknowns") in complex data. | Excellent for discovery; doesn't need labeled data to start. | Can be harder to interpret "why" something is an anomaly; may have a higher false-positive rate initially. |
| Hybrid | Comprehensive, end-to-end monitoring that requires both discovery and targeted tracking. | The best of both worlds: finds new issues and tracks known ones with high precision. | More complex to build and maintain an integrated system. |
Ultimately, many advanced systems, like SigOS, use a hybrid approach to create a powerful feedback loop. An unsupervised model might first discover a new, problematic user behavior. A product manager can then validate that finding, and the event can be used to train a supervised model to track that specific issue with even greater precision going forward.
This creates a detection engine that is constantly learning and improving, keeping you one step ahead.
Building Your Sub-Minute Detection Pipeline
Great algorithms are only half the battle in real-time anomaly detection. Honestly, even the most advanced model is just an expensive paperweight if it’s starved of data or gets it too late. To catch issues in under a minute, you need an engineering pipeline that’s built for speed—a data assembly line designed to move information from its source to an actionable insight, fast.
Think of it like a newsroom breaking a story. Information rushes from reporters in the field, gets refined by editors, hits the broadcast desk, and lands on your phone as a push notification. Every single step is optimized for speed and accuracy. Your data pipeline is no different; it has four essential stages that have to work together seamlessly.
Stage 1: Data Ingestion
It all starts with data ingestion, which is just a technical way of saying "collecting the raw data." This is your team of reporters on the ground, grabbing information the second it's created. For a SaaS product, this means tapping into a constant flow of data from all over your business.
Common sources include:
- Product Databases: Every user click, feature interaction, and session event.
- Support Tools: New tickets from platforms like Zendesk or chat logs from Intercom.
- Billing Systems: New subscriptions, failed payments, and plan changes.
- Infrastructure Logs: API response times, server error rates, and system health metrics.
The goal here isn't to run a batch job every hour. We need to collect this data as a continuous, real-time stream. That’s the only way to ensure the information flowing into the pipeline is always fresh and truly reflects what’s happening right now.
Stage 2: Feature Engineering
Once the data is in, it hits feature engineering. This is where raw, often messy information gets cleaned, shaped, and transformed into meaningful signals—or "features"—that a model can actually interpret. It’s like an editor taking a reporter’s jumbled notes and turning them into a clear, concise story.
For example, a raw stream of individual user clicks is mostly noise. But if you engineer it into a feature like "clicks-per-minute-on-checkout-button," it suddenly becomes a powerful business signal. A sharp drop could point to a critical bug, while a big spike might confirm a marketing campaign is working.
A well-architected pipeline is the circulatory system of a proactive business. It closes the loop between a detected event and an actionable response, often in seconds. This speed is what separates businesses that react to problems from those that prevent them.
This stage has to happen on the fly. Any complex transformations that take minutes to run will create a bottleneck and completely undermine the "real-time" aspect of the system.
Stage 3: Model Inference
With clean features in hand, the data moves to model inference. This is the moment of truth. The anomaly detection algorithm—whether it's statistical, unsupervised, or supervised—examines the feature and makes a judgment call: normal or not?
The following diagram illustrates the different kinds of algorithms that might be crunching the numbers at this stage.
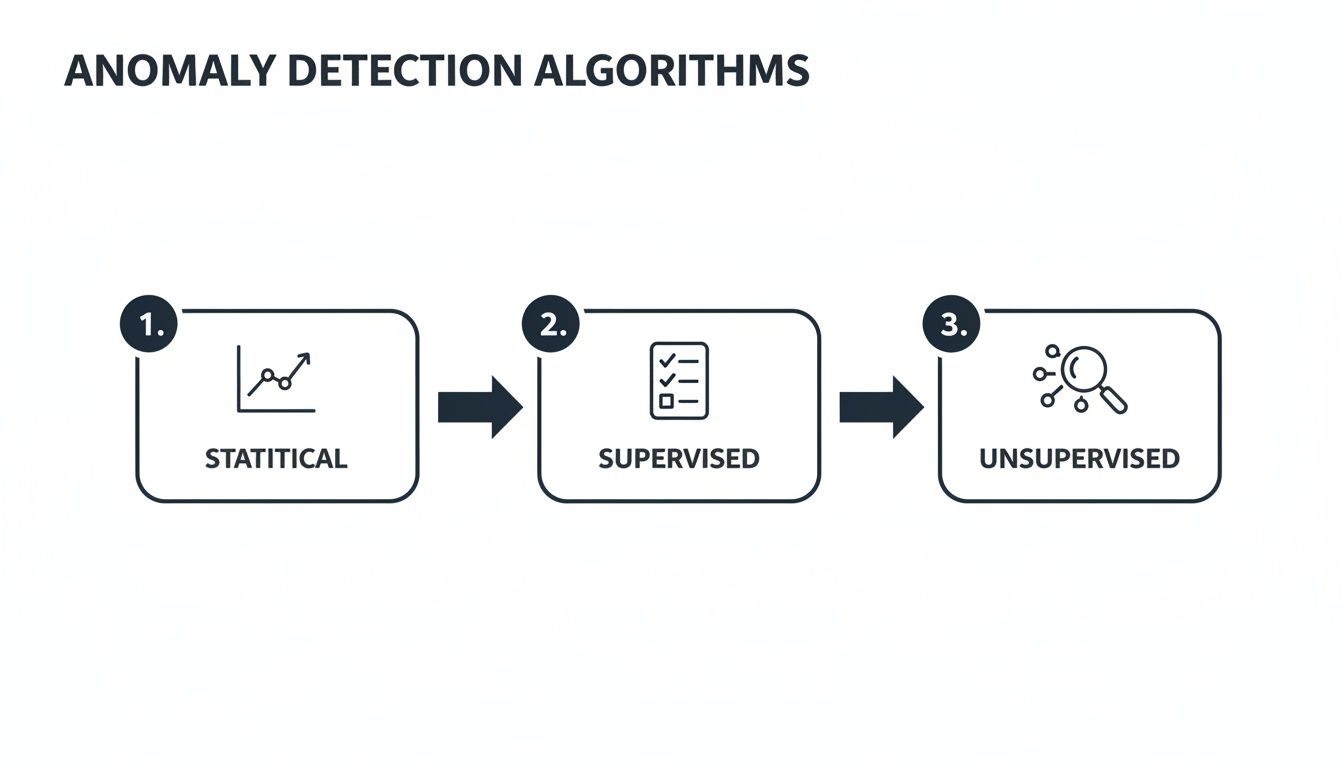
Each algorithm offers a different lens for viewing the data, from simple threshold checks to sophisticated pattern recognition. The key is that the inference step must be incredibly fast, ideally taking just milliseconds to process a data point and deliver a verdict.
Stage 4: Alerting and Action
Finally, if an anomaly is found, the pipeline triggers the alerting and action stage. This is the "breaking news" alert that lands in front of the right person. After all, a detection is worthless if it just sits in a dashboard that no one is looking at.
A truly great system does more than just send a generic notification. It routes a specific, contextual alert to the team that can actually fix the problem.
- An anomaly in product usage might trigger a direct alert to the product team's Slack channel.
- A spike in support tickets from a major account could page the dedicated Customer Success Manager.
- A critical API error could automatically create a high-priority ticket in Jira or Linear for the on-call engineers.
This is the step that delivers the real business value. Modern platforms like SigOS make this seamless by integrating directly with the tools your teams already use, automatically creating trackable issues complete with context and even estimated revenue impact. This smooth handoff is what turns a sub-minute detection into a sub-hour resolution.
How to Measure Anomaly Detection Success
So you’ve rolled out a real-time anomaly detection system. That’s a huge step, but how can you tell if it's actually working? A flood of alerts might feel like progress, but it’s usually the opposite. When your team is drowning in notifications, they start to tune them out. It’s the classic “boy who cried wolf” problem, and it’s a recipe for missing the one alert that truly matters.
Success isn’t about the number of alerts you generate; it’s about their quality. A great system delivers clear, trusted signals that your team can act on immediately. You need to look past vanity metrics and focus on what genuinely impacts your business.
Defining Success with Precision and Recall
To sidestep the alert fatigue trap, we need to borrow a couple of concepts from data science: Precision and Recall. Don’t worry, the idea is simple.
Imagine you have a security guard watching monitors for intruders.
- Precision answers the question: "Of all the times the guard hit the alarm, how many were actual intruders?" High precision means your alerts are trustworthy, not just false alarms.
- Recall answers: "Of all the intruders who showed up, how many did the guard actually catch?" High recall means your system is sensitive enough to catch most problems.
There’s always a trade-off. If you crank up the sensitivity to catch every little thing (high recall), you’ll inevitably get more false alarms (lower precision). But if you tune it to only flag dead-certain anomalies (high precision), you risk missing subtle but important issues (lower recall). The real art is finding the balance that works for your business.
A well-tuned system is your direct line to business outcomes. The whole point is to get alerts that help you do something valuable, like preventing a customer from churning or squashing a bug before it affects thousands of users.
The Challenge of Labeling Your Data
Calculating precision and recall requires you to know which alerts were legitimate anomalies and which were noise. This means you need to label your data, essentially teaching the system what a "real" problem looks like. But how do you do that if you don't have a massive, perfectly labeled historical dataset to start with?
You let your business outcomes do the labeling for you. Instead of having someone manually review every alert, you can create feedback loops based on what happens after an alert fires.
- Did a customer churn within 30 days of a "high user friction" alert? That was almost certainly a true positive.
- Did your support team confirm a bug after an alert flagged a sudden drop in usage? Another true positive.
- Did an alert fire but nothing bad happened and no one complained? That’s likely a false positive, and a sign that you need to adjust your model's sensitivity.
This reframes the problem from a technical exercise to a practical business process. It also makes the ROI crystal clear. In fact, studies show that using ML models for real-time systems can reduce false positives by 65%. For SaaS companies, detecting behavioral anomalies can predict an 18% impact on revenue. Real-time alerts have been shown to slash incident response times by 75%, turning potential crises into manageable fixes. Proactive flagging has even been shown to boost feature adoption by 28% by helping teams focus on the right user experience improvements, as noted in recent anomaly detection market research.
When you tie alerts directly to outcomes like churn, revenue, and support costs, you create a powerful cycle of continuous improvement. You’re not just detecting anomalies; you’re proving the system's value every single day. If you want to go deeper on this, check out our guide on choosing the right metrics and reporting strategies.
Real-World Use Cases for SaaS Teams

Theory is one thing, but seeing real time anomaly detection in action is where the magic happens. For any SaaS team, this technology stops being an abstract concept and starts being a way to turn a daily flood of data into direct, revenue-impacting insights.
Instead of forcing your teams to hunt through dashboards for clues, you can give them automated alerts that point to the exact problem or opportunity. Let's get practical and look at how product, growth, and customer success teams can use these instant signals to make better decisions, fast.
Detect User Friction Before It Becomes Churn
Picture this: a user is trying to export a critical report from your app. They click the export button again and again, but nothing happens. We've all been there. Those frantic "rage clicks" are a neon sign of user frustration.
A traditional analytics dashboard might show you this trend days later, but by then, the user has likely given up, or worse, churned.
With a real-time system, this weird clicking pattern is flagged the moment it starts. That event can immediately kick off a workflow.
- Proactive Support: The system can automatically open a high-priority support ticket, complete with all the session details for a fast follow-up.
- Product Team Alert: A Slack notification can go straight to the product manager in charge of that feature, giving them the user context they need to investigate.
Suddenly, a silent point of friction becomes a solvable problem. Your team can jump in, fix the root cause, and save a customer before they ever had a chance to complain.
Pinpoint Hidden Bugs After a Release
Your team just pushed a new release. The dashboards look good, and no major error alarms are going off. Everything seems fine. But under the surface, an anomaly detection system is watching how people are actually using the updated feature.
Within an hour, it spots a statistically significant drop in engagement with that feature, but only from a specific user segment. This is the kind of subtle signal that’s easy to miss. It's not a full-blown outage, but it might mean a hidden bug or a confusing UI change is tripping up a key group of users.
The system instantly alerts the right engineering team. They can then investigate and push a hotfix before the problem affects everyone or tanks your performance metrics for the quarter.
Anomaly detection essentially turns your user behavior data into the world’s most diligent QA team. It automates the painstaking work of post-release monitoring, shrinking a multi-day data-digging exercise into an immediate, precise alert that protects both your revenue and your customer experience.
Identify Competitive Threats and Opportunities
Your customer success managers work hard to keep key accounts happy. The problem is, you often only find out about a competitive threat when it's too late—like during a tense contract renewal call.
Real-time anomaly detection can act as an early warning system.
By analyzing incoming support tickets and chat logs, the system can spot unusual patterns. For example, it might notice a sudden spike in messages from a single account where every other message mentions a competitor's name.
This isn't just a simple keyword alert. The system understands this is a contextual anomaly—a major deviation from that account’s normal behavior. This triggers an immediate heads-up for the Customer Success Manager, giving them the chance to proactively engage the customer, understand their pain points, and reinforce your product's value long before the renewal is at risk.
Uncover Positive Anomalies for Growth
Not every anomaly is a fire that needs putting out. Sometimes, they point to a hidden goldmine.
Imagine an unsupervised model flagging a cohort of users from a particular industry who are adopting a secondary feature at a shockingly high rate. This "positive anomaly" is a huge growth signal.
It tells you that a group of customers has found a new, valuable way to use your product—one you never even planned for. For your product and growth teams, this insight is pure gold.
- New Playbook: This gives you the blueprint for a new sales and marketing strategy aimed directly at that vertical.
- Feature Roadmap: It validates that you should be investing more resources into developing that feature further.
This becomes even more critical in the world of connected devices. For instance, effective simulation and IoT for risk mitigation depends on spotting tiny deviations to head off system failures or find new efficiencies. It's the exact same principle that helps SaaS teams find untapped markets hiding right inside their existing user base.
Common Questions About Real-Time Anomaly Detection
When product and engineering leaders start exploring real-time anomaly detection, the same practical questions tend to pop up. It’s a big leap from looking at historical reports to monitoring what’s happening right now, so it's only natural to want to get the details straight.
Let's walk through the most common questions I hear and get you some straightforward answers.
How Much Data Do I Need to Start?
This is a big one, but the answer is probably "less than you think." You don't need a massive, petabyte-scale data lake to get going. The right amount of data really just depends on your goal and the algorithm you're using.
Simple statistical models, for example, can start finding value with just a few weeks of data. If your metrics are fairly stable—think daily active users or API calls—these models can quickly learn a baseline and spot obvious deviations. They’re a great starting point.
For more sophisticated machine learning models, the game changes. It's less about historical volume and more about the quality and velocity of your live data stream. Modern platforms are built to learn on the fly, so they can start identifying patterns almost as soon as you plug them in.
My advice? Don't try to boil the ocean. Start with a single, high-impact data stream—like user engagement events for a key feature or the flow of new support tickets. This gets you to a tangible win much faster and makes it a whole lot easier to show the value.
What Is the Biggest Mistake to Avoid?
Easy. The single biggest mistake is treating anomaly detection like a pure engineering problem instead of a core business process. I’ve seen teams spend months perfecting an algorithm, only to completely forget about what happens after an alert fires.
An alert, no matter how accurate, is just noise if it doesn't trigger a clear, fast, and effective response. The real magic happens when you close the loop between detection, alerting, and action. For instance, an alert flagging a high churn risk for an account is useless unless it’s instantly routed to the right Customer Success Manager with all the context they need to step in.
It’s like building a world-class fire alarm but forgetting to hook it up to the fire department. This is exactly why platforms with built-in workflow integrations are so critical—they automatically bridge that gap between insight and action.
Can Anomaly Detection Really Predict the Future?
It’s not a crystal ball, but it’s the closest thing you’ll get to having powerful leading indicators. Real-time anomaly detection is brilliant at spotting small, subtle shifts from the norm right now that almost always signal a bigger problem—or opportunity—on the horizon.
Think about it this way: a sudden spike in API error rates for one specific customer is an anomaly happening in the present. But it's also a flashing red light that predicts future events like angry customer emails, a flood of support tickets, and even churn.
By catching these signals the moment they appear, you get a critical head-start to change that future. So no, it doesn't "see the future," but it gives you the foresight to step in and prevent a bad outcome from happening in the first place. When a system can connect these technical blips to real business impact, it’s effectively putting a number on future risk so you can protect your revenue.
Is Unsupervised or Supervised Detection Better?
This isn't a "one is better" situation. They're just different tools for different jobs, and you’ll likely need both.
- Supervised detection is your tool of choice when you know exactly what you’re looking for. Have a history of specific fraud patterns? You can train a supervised model to find more of that exact thing with incredible precision. The downside is that it’s blind to anything it hasn’t been trained on.
- Unsupervised detection is for finding the "unknown unknowns." This is the approach that's a game-changer for most SaaS teams. It learns what "normal" looks like on its own and flags anything that deviates, making it perfect for discovering brand-new software bugs, emerging friction in the user journey, or novel security threats.
In practice, the most effective systems use a hybrid model. An unsupervised model might be the first to spot a totally new type of system failure. Once a product manager confirms it's a real issue, that event can be used as a new label to train a supervised model, which can then track that specific problem with higher accuracy from that day forward.
Ready to turn your product data into actionable, revenue-driving insights? SigOS uses AI-powered real-time anomaly detection to connect user behavior to business outcomes. Stop digging through dashboards and start getting automated alerts that tell you exactly where to focus your development efforts. Explore how SigOS can help you reduce churn and accelerate growth.
Keep Reading
More insights from our blog


Ready to find your hidden revenue leaks?
Start analyzing your customer feedback and discover insights that drive revenue.
Start Free Trial →