How to calculate ltv saas: A Founder's Guide to Growth
Learn how to calculate ltv saas with practical formulas, cohort analysis, and segmentation tips to boost profitability and scalable growth.

Calculating SaaS LTV isn't some back-office accounting exercise; it's the heartbeat of your growth strategy. A solid LTV calculation tells you how much you can spend on marketing, whether your pricing makes sense, and if your business model is actually built to last.
Nail this, and you create a predictable growth engine. Get it wrong, and you’re essentially flying blind, hoping you don't run out of cash.
Why Accurate LTV Is The Bedrock Of SaaS Strategy

A precise LTV is more than just another number on your dashboard. Think of it as the compass guiding every major decision you make. Its most immediate job is setting a clear limit on your Customer Acquisition Cost (CAC), making sure you don't spend more to land a customer than they'll ever be worth to you.
That simple relationship—LTV to CAC—has massive ripple effects across the business:
- Smarter Marketing Spend: It shines a light on which acquisition channels are actually profitable and which are just burning money. You can pour gas on a channel where the LTV is 4x the CAC, but you’ll know to immediately kill a campaign where that ratio dips below 1:1.
- Informed Pricing Strategy: Knowing your LTV helps you validate or rethink your pricing tiers. If the LTV for your "Pro" plan is barely higher than your "Basic" plan, but it costs you way more to support, that’s a red flag. It’s time to adjust features or bump the price.
- A More Focused Product Roadmap: When you segment LTV, you quickly see which types of customers are your most valuable. This is gold for your product team. They can prioritize features that make these high-value users stick around longer and spend more, which directly juices your LTV.
The Real-World Cost Of Getting It Wrong
A bad LTV calculation isn't just a rounding error; it costs real money.
Imagine a startup overestimates its LTV by just 20%. Armed with this faulty number, they confidently set their CAC target at 500, thinking they’re in a great spot. The problem is, their true LTV only justifies spending ****400 to acquire a customer.
That seemingly small mistake means they're losing $100 on every single customer they bring in. Quarter after quarter, that "minor" error compounds into hundreds of thousands of dollars in losses, draining the bank account and putting the whole company in jeopardy.
An imprecise LTV creates a domino effect of bad decisions. It’s not just about one number being wrong; it’s about the entire strategic foundation of your company becoming unstable, from your marketing budget all the way to your conversations with investors.
Garbage In, Garbage Out: The Data Problem
The only way to calculate LTV in SaaS with any confidence is to start with clean, trustworthy data. It's impossible to overstate this. A huge part of building a durable SaaS business is understanding why data accuracy is crucial for organizations, and this is especially true for a metric as foundational as LTV. If your churn numbers are a mess or you can't properly attribute revenue, your LTV is pure fiction.
Before you even open a spreadsheet, you need to have a handle on the core inputs.
Core Inputs For An Accurate SaaS LTV Calculation
This table breaks down the metrics you absolutely must get right. Each one tells a crucial part of the story, and getting any of them wrong will throw your entire calculation off.
| Metric | What It Measures | Why It's Critical for LTV |
|---|---|---|
| ARPA | Average Revenue Per Account | This is your starting point. It establishes the baseline revenue you earn from a typical customer in a given period (usually a month or year). |
| Customer Churn Rate | The percentage of customers who cancel their subscriptions | This directly determines the "lifetime" part of LTV. Higher churn means a shorter customer lifespan and, therefore, a lower LTV. |
| Gross Margin % | The percentage of revenue left after subtracting the cost of goods sold (COGS) | LTV should reflect profit, not just revenue. This ensures you're accounting for costs like hosting, support, and third-party services. |
| Expansion Revenue Rate | The rate at which existing customers increase their spending | This is a powerful LTV amplifier. Factoring in upgrades, add-ons, and cross-sells gives you a much more realistic picture of a customer's true value. |
Every single one of these inputs—from Average Revenue Per Account (ARPA) to your churn rate—has to be tracked with discipline.
Without that rigor, your LTV becomes a vanity metric. It might look good on a slide deck, but it gives you a false sense of security while the underlying economics of your business are quietly falling apart. For any SaaS company playing the long game, mastering LTV isn't optional.
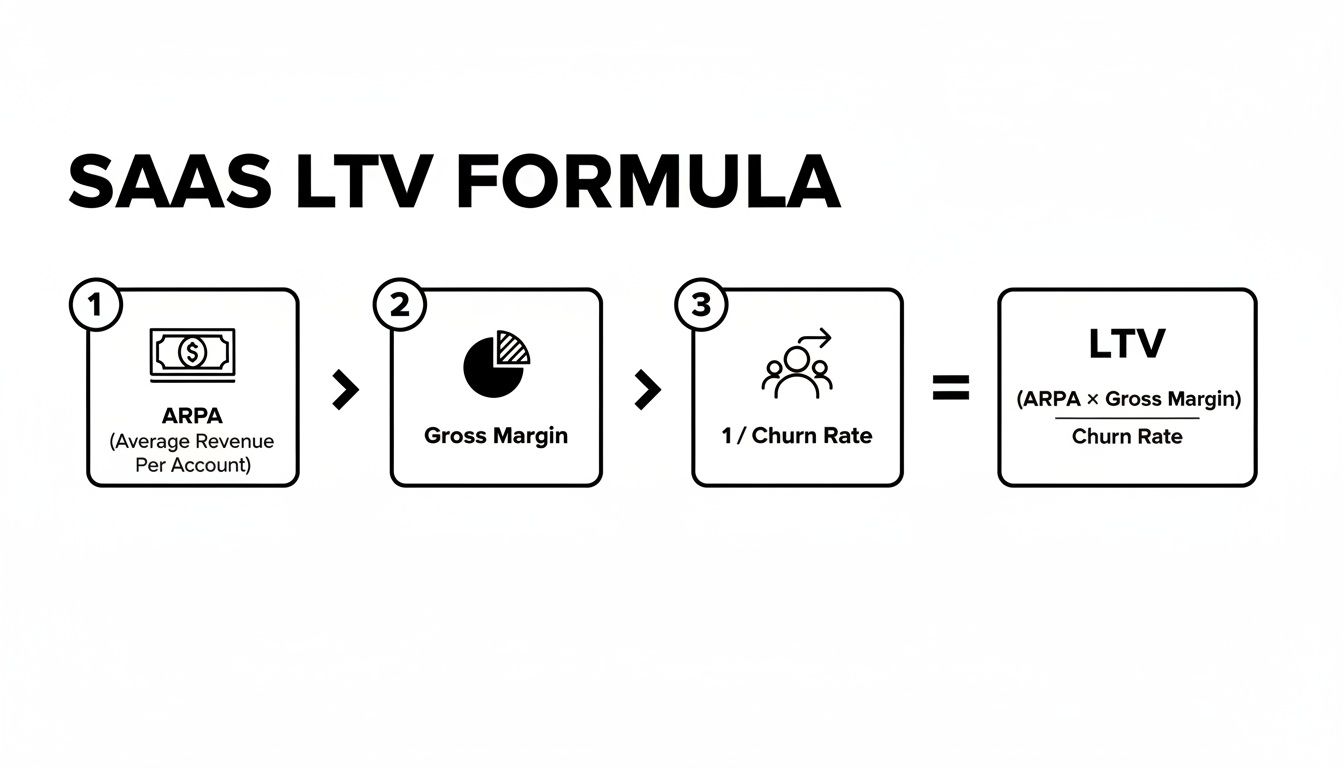
The Simple LTV Formula: Your Starting Point
If you want to get a handle on your SaaS LTV, you need a place to start. The quickest and most common way to get a baseline understanding is with the simple LTV formula. Think of it as a foundational health check for your business—it’s the first tool most of us reach for, and for good reason. It’s fast, straightforward, and gives you an immediate sense of your unit economics.
Here’s the classic formula: LTV = (ARPA x Gross Margin %) / Customer Churn Rate
Now, let's get our hands dirty and break down each piece of this puzzle. This isn't just about plugging in numbers; it's about truly understanding the story each metric tells about your customers and your operational efficiency.
Deconstructing ARPA (Average Revenue Per Account)
ARPA, or Average Revenue Per Account, is the average amount of money you make from a customer each month. A classic rookie mistake is just using the sticker price of your subscription plans. To get a real, accurate LTV, you have to dig deeper.
A solid ARPA calculation needs to include:
- Recurring Subscription Fees: This is your bread and butter, the core of your revenue.
- Expansion Revenue: Don't forget the money from upsells (customers upgrading to a pricier plan) and cross-sells (customers buying new features or add-ons).
- One-Time Fees: This includes things like setup costs, implementation fees, or special training sessions. Just be sure to average them out across your entire customer base for the period.
Let's imagine you have 100 customers. 90 are on a 50/month plan, and 10 high-value customers are on a ****150/month plan. Your base MRR is 6,000. But this month, you also pulled in ****500 from upsells and another 200 from one-time setup fees. Your total revenue is actually ****6,700.
Your ARPA is therefore **6,700 / 100 customers = **67. That's a far more accurate picture.
Nailing Down Your Gross Margin
This is where I see a lot of SaaS companies get tripped up. Your gross margin isn't your profit. It’s the slice of revenue left over after you pay for everything directly required to deliver your service—what accountants call the Cost of Goods Sold (COGS). Getting this number right is absolutely critical.
You have to be honest with yourself and include costs like:
- Hosting: Your bills from AWS, Google Cloud, or whatever data center you use.
- Third-Party Software: Think data APIs, infrastructure monitoring tools, or anything else essential for your app to run.
- Customer Support & Success: This includes the salaries and tools for the teams directly serving your paying customers.
If your total monthly revenue is 100,000 and your COGS add up to ****25,000, your gross profit is $75,000. That gives you a Gross Margin of 75%. If you just use total revenue in your LTV calculation, you're going to dangerously inflate your numbers and make bad decisions based on phantom profits.
Choosing the Right Churn Rate
Churn is simply the rate at which you lose customers. But it's not quite that simple—you have to decide what you’re measuring.
- Customer Churn: This is the most common one. It measures the percentage of customers who cancel. If you start a month with 100 customers and 5 leave, your customer churn is 5%. It's straightforward and easy to track.
- Revenue Churn: This measures the percentage of revenue you lose from those cancellations. What if those 5 lost customers were all on your cheapest plan? In that case, your revenue churn might only be 2%.
For this simple LTV formula, you should almost always use customer churn. It directly reflects the "lifetime" part of the equation—how long customers stick around. We'll get into the nuances of revenue churn when we talk about cohort analysis later on.
Let me be clear: an LTV calculation is only as reliable as the data you feed it. Inaccurate ARPA, an overly optimistic gross margin, or a fuzzy churn rate will spit out a number that might make you feel good but will ultimately lead you down the wrong path.
Putting It All Together: A Practical Example
Let’s run the numbers for a fictional B2B SaaS company we'll call "SyncUp."
Here are their metrics:
- ARPA: $300 per month
- Gross Margin: 80% (or 0.80)
- Monthly Customer Churn Rate: 4% (or 0.04)
Now, let's plug them into the formula: **LTV = (**300 x 0.80) / 0.04 **LTV = **240 / 0.04 LTV = $6,000
What does this tell us? On average, SyncUp can expect to generate $6,000 in gross profit from each customer over their entire time with the company.
This is powerful stuff. With this one number, you suddenly have a much better sense of what you can afford to spend to acquire a customer. From my experience, even tiny improvements to these inputs can have a massive impact. Dropping churn by just 1% can dramatically increase LTV across the board. If you want to play around with your own numbers, you can find some great inspiration in these SaaS LTV calculator examples.
This foundational formula gives you a vital baseline. It’s the essential first step before you can graduate to more sophisticated methods for understanding your business.
Beyond the Basics with Cohort Analysis
The simple LTV formula gives you a great starting point—a quick pulse check on your business. But if you stop there, you're missing the real story. Relying on a single, company-wide LTV is like trying to navigate a new city with a map that only shows the outer city limits. You can see the general shape, but you have no idea what's happening on the streets inside.
That’s where cohort analysis completely changes the game. Instead of lumping all your customers into one big average, you group them into "cohorts" based on a shared trait, usually the month they signed up. This lets you track the real performance and value of each group over time, completely independently from the others.
Why Cohorts Reveal What Averages Hide
Isolating different customer groups finally lets you see how your business decisions actually impact their long-term value. A single LTV number might look perfectly stable, but underneath the surface, one cohort's value could be taking off while another is quietly crashing.
For instance, maybe your blended LTV for the year is a solid 5,000. But a cohort analysis could show that customers you acquired back in January—before you shipped a major product update—have an LTV of only ****3,500. Meanwhile, the customers from June, who got the new features from day one, are tracking toward an LTV of $7,000. Your blended average completely buries this game-changing insight.
A single LTV metric tells you what your average customer is worth. Cohort analysis tells you why certain customers are worth more, giving you a real lever you can pull to drive growth.
How to Set Up Your First Cohort Analysis
Grouping customers isn't just a data-crunching exercise; it’s about asking the right strategic questions. You can slice your customer base into cohorts using different attributes to uncover specific trends.
- By Acquisition Month: This is the classic. It's the best way to see if your LTV is trending up as your product, marketing, and onboarding improve.
- By Acquisition Channel: Are customers coming from paid search more valuable than those from your organic content? This tells you exactly where to put your marketing dollars for the best return.
- By Initial Pricing Plan: Do customers who start on your "Pro" plan stick around longer and upgrade more than those who start on "Basic"? The answer can reshape your entire pricing strategy.
If you need help structuring the data, a good guide on SaaS customer lifetime value calculation can provide a solid framework. The whole point is to isolate one variable at a time so you can clearly attribute a change in LTV to a specific action you took.
Each cohort gets its own LTV calculation, using the same core inputs you're already familiar with.
By applying these metrics—ARPA, Gross Margin, and Churn—to each distinct group, you swap a blurry, averaged-out picture for a high-definition view of your business's health.
Turning Raw Data into Action
Once you have your cohorts, you start tracking their cumulative revenue month by month. The standard way to visualize this is with a triangular chart, often called a retention table, which shows how each cohort's behavior evolves over its lifecycle.
Let's imagine a real-world scenario. Your team notices the March 2023 cohort has a 30% higher LTV after 12 months than the cohort from January 2023. After a bit of digging, you realize the March group was the first to experience your newly redesigned onboarding flow. That's not just a cool fact; it's a clear signal that the new onboarding is a massive success and needs to be rolled out immediately.
Or think about marketing spend. An analysis by channel might show that while Google Ads bring in the most sign-ups, the handful of customers you got from a niche podcast sponsorship have double the LTV. Why? Because they're a perfect fit. This insight empowers your team to reallocate its budget for a dramatically better ROI. To really dig into this, it's worth exploring the nuances of tracking user behavior over time with a deeper dive into cohort retention analysis.
This approach transforms historical data from a simple report card into a powerful predictive tool. You stop looking in the rearview mirror and start using past performance to make smarter, data-backed decisions about your product, marketing, and customer success roadmap.
Go Deeper: Why You Need to Segment Your LTV Calculations
While cohort analysis gives you a powerful time-based view, segmentation is where you truly start to understand the why behind the numbers. Calculating a single, blended LTV for your entire customer base is a good starting point, but it hides massive, and often critical, variations.
It’s like knowing the average temperature of a country—it doesn’t tell you much about the difference between the frigid mountains and the scorching desert. You can’t make good decisions based on an average that doesn’t reflect reality.
Strategic LTV segmentation is all about slicing your customer data into meaningful groups to expose these hidden truths. This moves you beyond just looking in the rearview mirror and helps you make smart, forward-looking decisions about where to invest your time, money, and effort. It's how you focus your marketing, sales, and product teams on the activities that generate the highest return.
Powerful Ways to Segment Your LTV Calculation
The goal here is simple: create segments that reveal distinct behaviors and values. Instead of just grouping by sign-up date, you start analyzing LTV based on customer characteristics that actually predict their long-term worth.
Here are a few of the most impactful ways I’ve seen companies segment their customers:
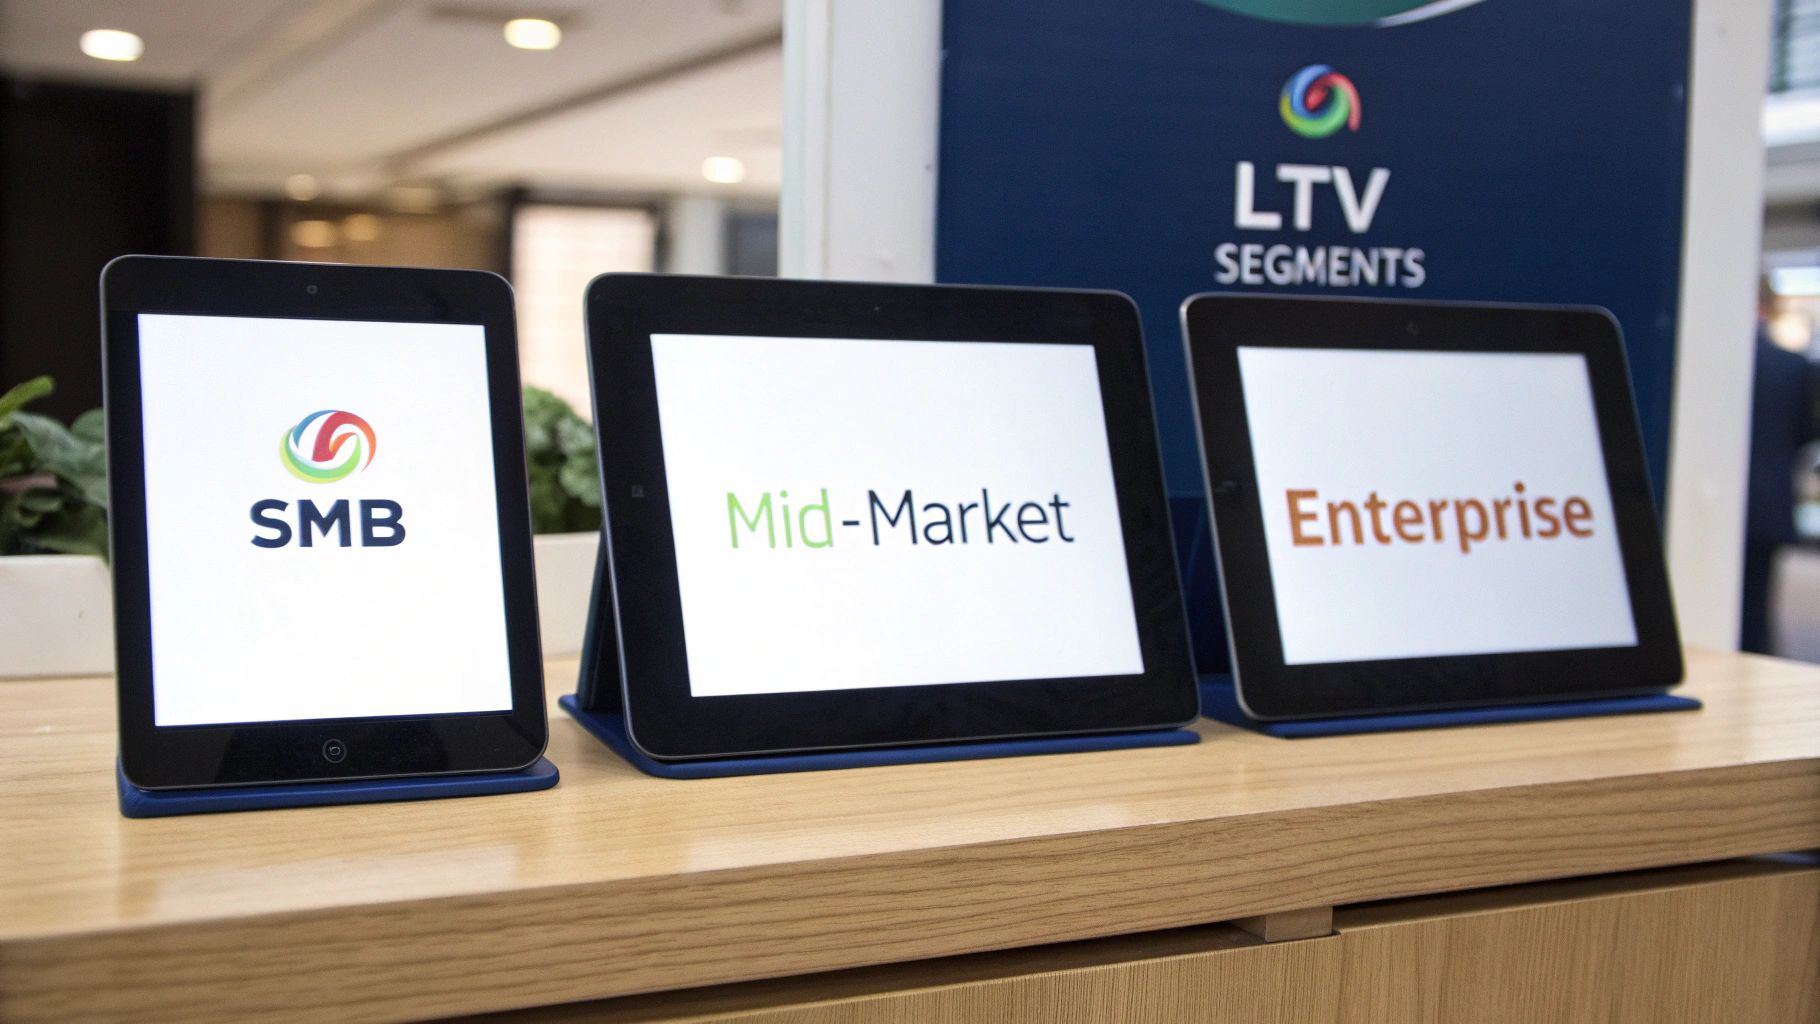
- By Pricing Tier: This is often the most revealing place to start. You can directly compare the LTV of customers on your "Starter," "Pro," and "Enterprise" plans. It's not uncommon to discover that Enterprise customers have an LTV that is 10x or even 20x higher than those on your entry-level plan.
- By Company Size (SMB vs. Enterprise): Similar to pricing, this helps you understand the real-world economics of serving different market segments. Enterprise clients typically have much lower churn and significantly higher expansion revenue, leading to a dramatically higher LTV.
- By User Persona or Job Role: Do marketers who use your product stick around longer than salespeople? Do developers have a lower expansion rate than project managers? Answering these questions helps you tailor everything from your product roadmap to your onboarding messaging.
This isn’t just an academic exercise. Armed with this segmented data, you can finally answer critical business questions with confidence. You might discover your SMB segment has a terrible LTV:CAC ratio, signaling that you need to completely rethink your acquisition strategy for smaller companies or build a more efficient, self-serve funnel.
The Stark Reality: Not All Customers Are Created Equal
The differences you'll find between segments can be staggering. Recent industry benchmarks show just how wide this gap can be.
Small and Medium Businesses (SMBs) might generate an LTV between **15,000 to **40,000, often held back by higher monthly churn rates of 5-7%. In contrast, Mid-Market customers can push LTV into the **80,000 to **200,000 range, largely thanks to greater upsell potential.
Enterprise deals are in another league entirely. LTVs here often soar past 300,000 and can even exceed ****1,000,000 thanks to multi-year contracts and net revenue retention that climbs well over 110%. For a closer look at the data, you can explore the full B2B SaaS LTV benchmarks.
This proves a fundamental SaaS truth: not all revenue is created equal. A dollar from an enterprise customer is often far more valuable in the long run than a dollar from an SMB.
Calculating LTV by segment transforms it from a passive reporting metric into an active strategic tool. It stops being about what your average LTV was and starts being about how you can intentionally build a more valuable customer base.
Let’s look at a quick comparison to make this tangible.
How LTV Varies Across Customer Segments
This table gives a simplified but realistic look at how LTV and its core components can differ dramatically across common SaaS customer segments.
| Segment | Typical ARPA | Average Churn Rate | Resulting LTV Range |
|---|---|---|---|
| SMB | 100 - 500/mo | 3-7% monthly | 5,000 - 15,000 |
| Mid-Market | 1,000 - 5,000/mo | 1-3% monthly | 50,000 - 250,000 |
| Enterprise | $10,000+/mo | <1% monthly | $500,000+ |
The numbers here clearly illustrate why segmentation is essential when you calculate LTV in a SaaS business. The LTV of an Enterprise customer isn't just a little higher—it reflects a completely different business model with different support costs, sales cycles, and growth opportunities.
By understanding these differences, you can start making much smarter, more profitable decisions. You can justify dedicating a direct sales team to the Enterprise segment while relying on more automated, cost-effective marketing for the SMB segment. This strategic alignment, all driven by a segmented view of LTV, is how you build a truly efficient and scalable growth engine.
Balancing LTV and CAC for Profitable Growth
Figuring out how to calculate LTV in a SaaS business is a huge win, but that number doesn't tell you much on its own. The real magic happens when you pair it with its other half: your Customer Acquisition Cost (CAC).
The relationship between these two metrics—the LTV:CAC ratio—is basically the ultimate health check for your entire business model. It answers the most important question: are you building a profitable growth engine or just pouring money into a leaky bucket?
The Magic Number for SaaS Viability
In the SaaS world, there’s a benchmark that tends to separate the businesses that are thriving from those that are just surviving. That magic number is 3:1. An LTV:CAC ratio of 3:1 means that for every dollar you put into acquiring a customer, you're getting three dollars in gross profit back over their lifetime.
This is widely seen as the minimum bar for a healthy, sustainable SaaS company.
- A ratio below 3:1 is a serious red flag. It’s a strong signal that you're probably losing money on each new customer once you factor in all your operational costs. Your cash flow takes a hit, and trying to scale will only make the problem worse.
- A ratio of 4:1 or 5:1 points to a really efficient business. You’ve likely found strong product-market fit and have a well-oiled sales and marketing machine. This is the sweet spot where you can hit the growth accelerator with confidence.
Here’s a twist, though: an incredibly high ratio, say 8:1 or 10:1, might not be the home run it appears to be. Often, it means you're underinvesting in growth. You have the green light to spend more aggressively on marketing and sales to grab more of the market before a competitor does.
Using the Ratio to Drive Smart Decisions
Once you’ve got a handle on your LTV:CAC ratio, it becomes a seriously powerful tool for making sharp, data-driven decisions. It helps you move from gut feelings to strategic action.
Here’s how you can put it to work:
- Set Realistic Marketing Budgets: Let's say your LTV is 6,000. If you’re targeting a healthy 3:1 ratio, you now have a hard ceiling for your CAC: ****2,000. This gives your marketing team a clear, justifiable budget to work with.
- Optimize Channel Performance: Don't just look at the overall ratio; calculate it for each of your acquisition channels. You might discover that LinkedIn Ads are bringing in a 4:1 ratio, while your Google Ads are stuck at 2:1. That data tells you exactly where to double down and where you need to re-evaluate.
- Validate Pricing and Strategy: If you just can't seem to hit a healthy ratio with your current pricing, it's a sign that something needs to give. The numbers might force you to consider raising prices, shifting focus to a higher-value customer segment, or investing in your product to improve key customer retention metrics. If you want to dive deeper into that, you can check out our guide on essential customer retention metrics.
The LTV:CAC ratio is more than a metric; it's a discipline. It forces you to maintain a constant, healthy tension between what you spend to grow and the long-term value you create.
This ratio really is the north star for SaaS profitability. Analysis of B2B companies often points to an average of 3:1, but it definitely varies by industry. For instance, Medtech and Pharma companies can average a 4:1 ratio, with an LTV of 16,300 against a CAC of ****3,665. If you're curious, you can discover more insights about the SaaS LTV to CAC ratio to see how different sectors stack up. This is exactly why segmentation is so critical—your target ratio should always be in line with your specific market and business model.
How Product Intelligence Sharpens Your LTV Calculations
Relying on traditional methods to calculate LTV in SaaS feels a bit like driving while looking only in the rearview mirror. You're using lagging indicators—historical churn, past expansion rates—to predict the future. This approach tells you what went wrong last quarter, but by then, the damage is done. You’re always reacting, never getting ahead.
Product intelligence changes the game completely. It’s a proactive strategy that draws a direct line from what users are saying and doing inside your product to your core financial metrics. So instead of just seeing that churn ticked up by 2%, you can see why. You can pinpoint the exact bug, the frustrating workflow, or the missing feature that’s pushing customers away.
From Vague Feedback to Financial Impact
Let's be honest, we've all been there. Your support team has a hunch about a problem, but it's just a collection of anecdotes. A product intelligence platform like SigOS takes all that unstructured feedback from support tickets, sales calls, and user reviews and finds the patterns. More importantly, it quantifies their financial impact.
Imagine your support team flags a few complaints about a slow report-generation feature. It’s annoying, but is it a priority? Product intelligence connects the dots. It might reveal that users who hit this specific snag are 30% more likely to churn within the next 60 days. Suddenly, you have a clear, data-backed business case for fixing that report. You’re no longer guessing; you’re making informed decisions.
The real power here is turning qualitative feedback from a fuzzy "nice-to-have" list into a prioritized roadmap based on revenue. The conversation shifts from, "What should we build next?" to, "Which of these roadmap items will protect the most revenue or unlock the biggest expansion opportunities?"
Actively Shape Your LTV, Don't Just Measure It
This kind of insight gives you a powerful lever to influence LTV, not just measure it after the fact.
- Prevent Churn Before It Happens: When you can spot the early warning signs of frustration—like a spike in complaints about a key integration—you can intervene before that customer starts shopping for alternatives. You’re not waiting for the exit survey; you’re solving the problem that would have triggered it.
- Find Hidden Expansion Opportunities: In the same way, the system can flag feature requests that keep coming up in conversations with your highest-value customers. Building these isn't just about keeping people happy; it creates a natural path for upsells and cross-sells, directly boosting your ARPA.
Ultimately, this approach transforms LTV from a passive metric you report on into an active one you can control. When you finally understand the financial drivers behind user behavior, you can make smarter, more focused product decisions. You're no longer just calculating LTV—you're actively engineering it for growth.
Got Questions About SaaS LTV? We've Got Answers.
Even after you’ve got the formulas down, you'll probably still run into some specific questions when you start calculating LTV for your own business. Let's walk through a few of the most common ones I hear from SaaS leaders.
How Often Should I Be Calculating LTV?
For most SaaS companies, running the numbers monthly or quarterly is the sweet spot. This cadence gives you enough data to spot meaningful trends and see how your latest marketing campaigns or product updates are playing out.
If you're an early-stage startup in a high-growth sprint, I'd lean towards a monthly calculation. It's crucial for keeping a close eye on your unit economics so you can make quick, informed pivots when needed.
What’s Considered a "Good" LTV for a SaaS Company?
This is a trick question—there's no magic number. A "good" LTV is all about context and its relationship to your Customer Acquisition Cost (CAC).
An enterprise software company might be perfectly healthy with a 250,000 LTV, while a popular tool for small businesses could be crushing it with a ****10,000 LTV.
The absolute LTV figure doesn't tell you much on its own. What really matters is your LTV:CAC ratio. The goal is to keep that ratio at 3:1 or higher. That’s the real signal that you've built a profitable, scalable business model.
If I Have Negative Churn, Is My LTV Infinite?
Theoretically, yes! When you hit net negative churn, it means your expansion revenue from existing customers is bigger than the revenue you're losing from churn. This is an amazing place to be, but it breaks the simple LTV formula because the denominator (your churn rate) becomes zero or negative.
So, what do you do? This is where you need to bring in more sophisticated financial models. Your finance team will likely use a discounted cash flow (DCF) analysis to find the Present Value of a customer. This gives you a more realistic, finite LTV by accounting for the time value of money. It’s a clear sign of a powerful growth engine and an incredibly healthy company.
Ready to stop guessing and start quantifying the real revenue impact of your product decisions? SigOS analyzes your user feedback to show you which bugs are costing you the most and which feature requests will drive the biggest deals. See how it works.


Ready to find your hidden revenue leaks?
Start analyzing your customer feedback and discover insights that drive revenue.
Start Free Trial →