Top 7 Customer Satisfaction Measurement Methods for 2025
Discover the key customer satisfaction measurement methods to enhance your business in 2025. Learn effective strategies to boost customer insights and loyalty.

In today's competitive market, understanding customer sentiment is not just a 'nice-to-have' element; it's the core engine of sustainable growth. Satisfied customers do more than just make repeat purchases. They become your most credible and effective marketing channel, driving organic growth through referrals and positive reviews. Yet, how do you transition from anecdotal evidence and intuition to a precise, data-driven strategy for gauging their experience?
Relying on a single metric to understand your user base is like trying to navigate a complex journey with a single, outdated map. It provides a limited view that can be misleading and incomplete. To gain a true, multi-dimensional understanding of your audience, you need a comprehensive toolkit of customer satisfaction measurement methods. A holistic approach is essential for identifying friction points, validating product decisions, and forecasting churn with greater accuracy.
This guide provides a detailed, side-by-side comparison of the seven most powerful customer satisfaction measurement methods available today. We move beyond simple definitions to explore the specific mechanics, pros, cons, and ideal implementation scenarios for each. You will learn not just what these metrics are, but how to strategically combine them to build a robust system that doesn't just measure satisfaction but actively works to improve it. From transactional surveys to behavioral analytics, we will equip you with the knowledge to select and deploy the right combination for your unique business needs, turning customer feedback into your most valuable asset.
1. Net Promoter Score (NPS)
The Net Promoter Score (NPS) stands as one of the most widely adopted customer satisfaction measurement methods, valued for its simplicity and direct correlation with business growth. It measures customer loyalty with a single, powerful question: "On a scale of 0 to 10, how likely are you to recommend our company/product/service to a friend or colleague?" This question gauges overall sentiment rather than satisfaction with a single interaction, making it a powerful predictor of future customer behavior.

Based on their response, customers are categorized into three distinct groups:
- Promoters (9-10): Your most enthusiastic and loyal customers. They are your brand advocates, likely to make repeat purchases and refer others, fueling organic growth.
- Passives (7-8): Satisfied but unenthusiastic customers. They are vulnerable to competitive offerings and are not actively promoting or detracting from your brand.
- Detractors (0-6): Unhappy customers who can damage your brand through negative word-of-mouth and churn.
The final NPS score is calculated by subtracting the percentage of Detractors from the percentage of Promoters, resulting in a score ranging from -100 to +100.
When and Why to Use NPS
NPS is an ideal method for measuring long-term customer loyalty and overall brand health. It's particularly effective for businesses looking to tie customer sentiment directly to revenue potential, as Promoters are a key driver of growth. Companies like Apple, which consistently maintains an NPS above 70, and Tesla, which has achieved scores as high as 96, use this metric to benchmark their performance and maintain a loyal customer base.
Actionable Implementation Tips
To effectively integrate NPS as one of your primary customer satisfaction measurement methods, move beyond just collecting the score.
- Segment Your Data: Don't rely on a single, company-wide score. Segment NPS results by customer demographics, product line, or stage in the customer journey to uncover specific pain points and opportunities.
- Close the Loop: Implement a system to act on feedback immediately. Follow up with Detractors within 24 hours to resolve their issues and prevent churn. Engage with Promoters to request testimonials, case studies, or participation in referral programs.
- Track Trends Over Time: A single NPS score is a snapshot, but tracking it over time reveals the impact of your product updates, policy changes, and customer service improvements. This trend analysis provides a much richer narrative of your customer relationships.
2. Customer Satisfaction Score (CSAT)
The Customer Satisfaction Score (CSAT) is one of the most straightforward and widely used customer satisfaction measurement methods. It directly assesses a customer's happiness with a specific interaction, product, or service. This is typically done by asking a direct question, such as, "How satisfied were you with your recent support experience?" The responses are captured on a rating scale, commonly 1-5 or 1-10.

Unlike broader metrics like NPS, CSAT provides an in-the-moment snapshot of a particular touchpoint. Customers are typically segmented based on their response:
- Satisfied (e.g., 4-5 on a 5-point scale): Customers who had a positive experience.
- Neutral (e.g., 3 on a 5-point scale): Customers whose expectations were met but were not particularly impressed.
- Dissatisfied (e.g., 1-2 on a 5-point scale): Customers who had a negative experience and are at risk of churning.
The final CSAT score is calculated as the percentage of satisfied customers. For example, if 80 out of 100 respondents rate their satisfaction as a 4 or 5, your CSAT score is 80%.
When and Why to Use CSAT
CSAT excels at measuring transactional, short-term satisfaction. It is the ideal method for pinpointing strengths and weaknesses at specific points in the customer journey, such as after a customer support call, upon completion of a purchase, or following a feature usage. Companies like Uber, which asks for a rating after every ride, and Microsoft, which measures satisfaction after each support ticket is resolved, use CSAT to gather immediate, actionable feedback on their service delivery. This allows for rapid service recovery and targeted operational improvements.
Actionable Implementation Tips
To make CSAT a valuable part of your customer satisfaction measurement methods, focus on context and timely action.
- Time Your Surveys Carefully: Deploy CSAT surveys immediately following the conclusion of the interaction you want to measure. For a support ticket, send the survey right after it's closed. For a product purchase, send it within a few hours.
- Maintain Scale Consistency: Use the same rating scale (e.g., 1-5) across all touchpoints. This allows you to benchmark performance accurately between different departments or stages of the customer journey, such as comparing onboarding satisfaction to support satisfaction.
- Combine with an Open-Ended Question: Always follow up a low score with a qualitative question like, "What could we have done better?" This provides crucial context that helps you understand the root cause of dissatisfaction and prevent future issues.
- Track Trends, Not Just Scores: A single CSAT score offers limited value. Monitor CSAT trends over time for specific touchpoints. A declining score in post-purchase satisfaction, for instance, could signal a problem with your checkout process or delivery partner.
3. Customer Effort Score (CES)
The Customer Effort Score (CES) is a powerful transactional metric that shifts the focus from delight to ease. It measures how much effort a customer had to exert to resolve an issue, complete a request, or use a product feature. The central idea, popularized by research in the Harvard Business Review, is that reducing customer effort is a more reliable driver of loyalty than creating "wow" moments. The survey typically asks a straightforward question like, "To what extent do you agree or disagree with the following statement: The company made it easy for me to handle my issue?" answered on a 1-7 scale from "Strongly Disagree" to "Strongly Agree."
This approach zeroes in on the friction within the customer journey. By identifying and eliminating obstacles, companies can significantly reduce frustration and prevent churn. Unlike broader metrics, CES provides a specific, actionable assessment of a particular process or interaction.
Research has consistently shown the direct financial impact of reducing customer effort. The following infographic highlights the key data points that make CES one of the most compelling customer satisfaction measurement methods for service-oriented businesses.
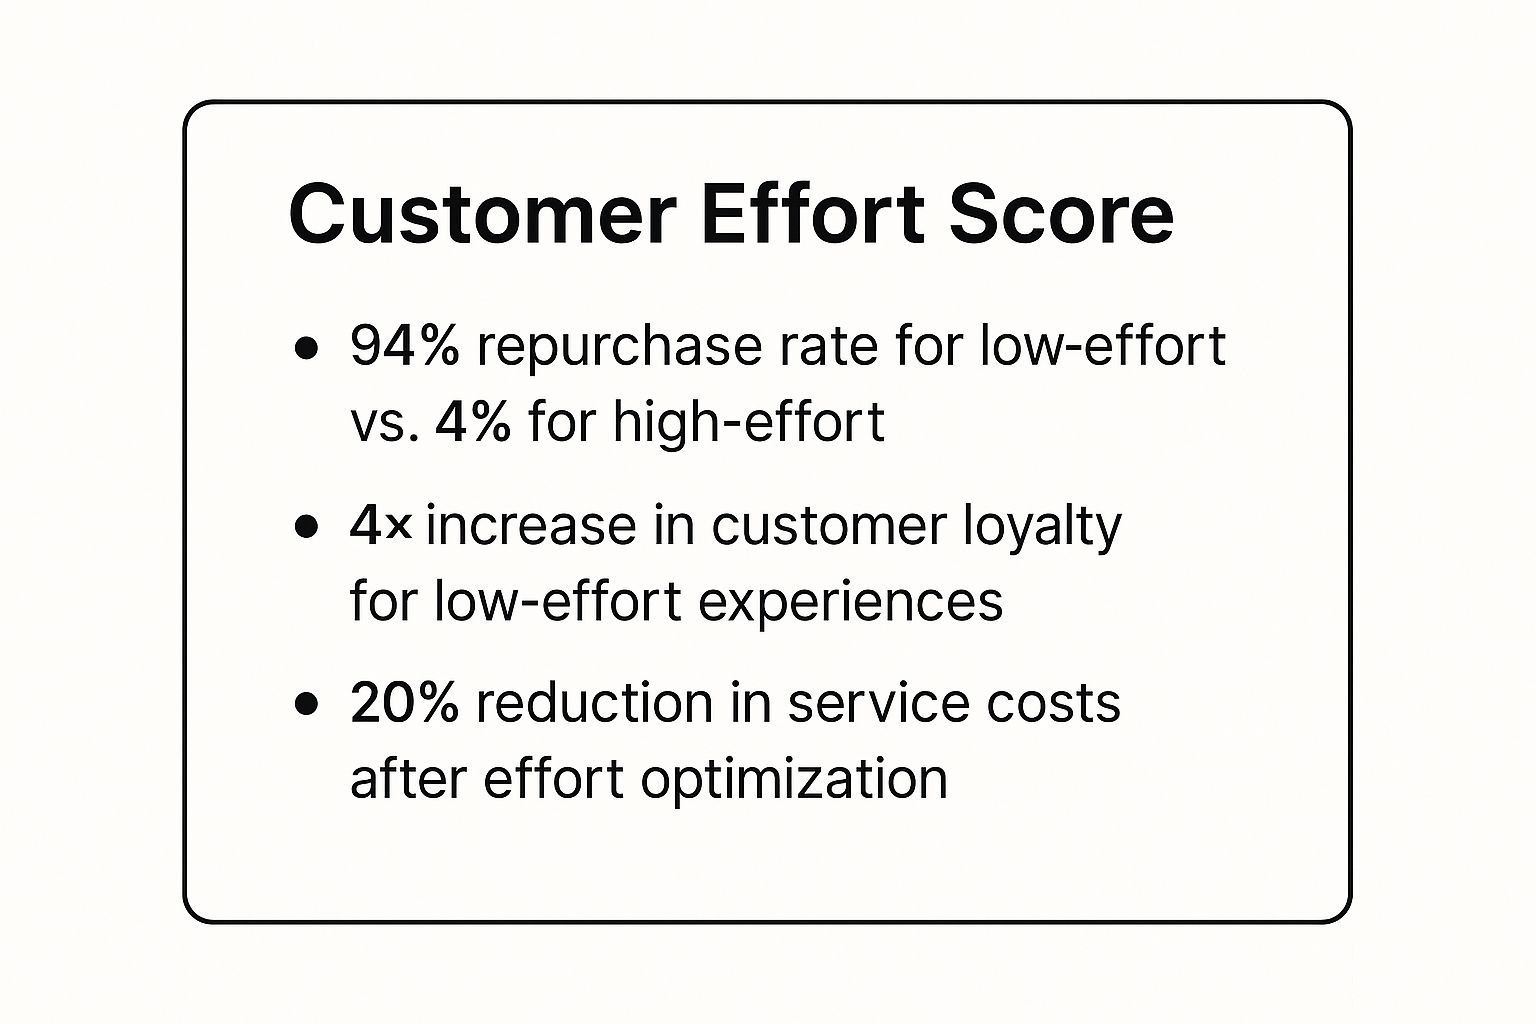
The data clearly illustrates that a low-effort experience not only retains customers at a staggering rate but also drives significant cost savings and fosters long-term loyalty.
When and Why to Use CES
CES is the ideal metric for gauging the effectiveness of customer service interactions, support processes, and product usability. It excels at pinpointing specific pain points in the customer journey. Companies like Amazon use this principle to create an almost effortless returns process, while Netflix simplifies content discovery, directly reducing the cognitive load on the user. The goal is to make interactions so seamless that they feel invisible. CES is particularly valuable for support teams, product managers, and UX designers looking to optimize specific touchpoints.
Actionable Implementation Tips
To effectively use CES as one of your core customer satisfaction measurement methods, focus on turning insights into process improvements.
- Deploy Immediately: Trigger a CES survey immediately after a specific interaction, such as a support ticket closure, a purchase, or the use of a new feature. This provides fresh, context-specific feedback while the experience is top of mind.
- Identify High-Effort Triggers: Analyze feedback to identify common causes of high effort, such as channel switching (e.g., from web to phone), repeat contacts for the same issue, or confusing navigation. Use this data to prioritize which processes to fix first.
- Empower Frontline Staff: Train your support and success teams to recognize signs of customer effort during an interaction. Give them the autonomy to resolve issues efficiently without unnecessary escalations or policy roadblocks, directly improving the CES score for that interaction.
4. Customer Health Score
The Customer Health Score moves beyond single-question surveys to create a holistic, predictive view of the customer relationship. It is a composite metric that aggregates multiple data points into a single, actionable score, indicating the overall "health" of an account. This score is designed to proactively identify at-risk customers long before they express dissatisfaction, making it one of the most powerful predictive customer satisfaction measurement methods.
Instead of relying on a single survey response, a health score might combine behavioral data like product usage frequency, feature adoption, and session duration with transactional data like billing history and support ticket volume. The result is often a color-coded indicator (e.g., Red for poor health, Yellow for at-risk, and Green for healthy) that gives customer-facing teams an at-a-glance understanding of an account's status.
The score is calculated by assigning weights to different inputs based on their correlation with positive outcomes (like renewals and upsells) or negative outcomes (like churn). For example:
- Product Engagement (40%): How often do they log in? Are they using key features?
- Support Tickets (20%): What is the volume and severity of their support requests?
- NPS/CSAT Scores (15%): What is their stated satisfaction level?
- Billing History (15%): Are their payments consistently on time?
- Marketing Engagement (10%): Do they open emails or attend webinars?
This weighted combination provides a much richer and more accurate picture of customer satisfaction and loyalty than any single metric could alone.
When and Why to Use a Customer Health Score
A Customer Health Score is essential for B2B and SaaS businesses with recurring revenue models where customer retention is paramount. It is the ideal method for companies looking to transition from a reactive "firefighting" support model to a proactive customer success strategy. Platforms like Gainsight, Salesforce Health Cloud, and ChurnZero have institutionalized this approach, allowing companies to systematically identify and engage at-risk accounts. For instance, HubSpot uses health scoring to prioritize which clients its customer success managers should focus on each week.
Actionable Implementation Tips
To effectively implement a Customer Health Score as one of your core customer satisfaction measurement methods, focus on a strategic and iterative rollout.
- Start Small and Validate: Begin with just 3-5 key metrics that you strongly believe predict churn or retention. For a SaaS company, this could be daily active users, adoption of a "sticky" feature, and the number of high-severity support tickets. Validate your initial model against historical churn data before adding more complexity.
- Weight Metrics by Impact: Not all data points are created equal. Analyze which behaviors and attributes have the strongest correlation with customer retention and assign them a higher weight in your scoring algorithm. For example, a drop in daily usage may be a more powerful churn predictor than a single low CSAT score.
- Automate Proactive Workflows: The real power of a health score is in the action it enables. Create automated playbooks triggered by score changes. A score dropping from Green to Yellow could trigger a check-in email from a customer success manager, while a drop to Red could automatically schedule an urgent call. To learn more, explore these proven strategies on how to reduce customer churn on sigos.io.
- Train Your Team: A score is useless if your team doesn't know how to interpret it or what to do with it. Train your customer success and support teams on what each health level means and the specific actions they should take to improve the customer's health.
5. Voice of Customer (VoC) Programs
Voice of Customer (VoC) is not just a single metric but a comprehensive program designed to systematically capture, analyze, and act upon the full range of customer expectations, needs, and feedback. It moves beyond isolated surveys to create a holistic, 360-degree view of the customer experience by integrating data from multiple sources. This approach consolidates direct feedback (surveys, interviews), indirect feedback (social media comments, online reviews), and inferred feedback (behavioral data, support tickets) into a unified strategy.

A VoC program functions as an organizational nervous system, collecting signals from every customer touchpoint to inform strategic decisions across the entire business. It aims to answer fundamental questions about the customer journey:
- Expectations vs. Reality: Are we meeting, exceeding, or falling short of what customers expect at each stage of their journey?
- Unmet Needs: What are the hidden needs or pain points that customers aren't explicitly stating?
- Priorities: Which improvements or new features will deliver the most value and impact to our customer base?
The ultimate goal of a VoC program is to embed customer-centric thinking into the company's DNA, ensuring that product development, marketing, and service delivery are all aligned with customer desires.
When and Why to Use VoC
VoC is the ideal framework for businesses committed to building a deeply customer-centric culture and making data-driven strategic decisions. It's particularly powerful for complex organizations with multiple products, channels, or customer segments where a single metric isn't enough. Companies like Dell leverage customer advisory panels, a core VoC component, to guide product innovation, while American Express uses an enterprise-wide program to maintain its reputation for superior service. Using VoC programs is one of the most effective customer satisfaction measurement methods for achieving a deep and actionable understanding of customer needs.
Actionable Implementation Tips
To build an effective VoC program, you must create a systematic and repeatable process for listening and responding.
- Map the Customer Journey: Before collecting data, create detailed customer journey maps. This will help you identify the most critical touchpoints where feedback will be most valuable, such as onboarding, post-purchase, or support interactions.
- Establish Clear Governance: Define who owns the VoC program, how feedback is collected, who analyzes it, and how insights are distributed to relevant departments. A clear governance process prevents data from becoming siloed and ensures accountability.
- Implement Closed-Loop Systems: Create workflows to ensure every piece of significant feedback receives a response. This means following up with dissatisfied customers to solve problems, engaging with neutral customers to understand their hesitation, and thanking advocates for their support.
- Share Insights Broadly: Democratize customer feedback. Use dashboards, internal newsletters, or regular all-hands meetings to share key findings with every department, from engineering to marketing, so the entire organization is aligned with the customer's perspective.
6. Social Media Sentiment Analysis
Social Media Sentiment Analysis leverages artificial intelligence, natural language processing (NLP), and machine learning to analyze the vast and unstructured data from social platforms. This method automatically interprets the emotions, opinions, and attitudes expressed in customer posts, comments, and reviews, categorizing them as positive, negative, or neutral. It goes beyond simple mention-counting to provide a real-time pulse on public perception and brand health.
This powerful technique allows businesses to tap into unsolicited, organic customer feedback. Instead of asking for an opinion via a survey, companies can listen to what customers are already saying publicly. This provides authentic, unfiltered insights into customer satisfaction drivers, emerging issues, and competitive positioning.
The process involves:
- Data Collection: Gathering mentions of your brand, products, or relevant keywords from platforms like X (formerly Twitter), Facebook, Instagram, and Reddit.
- Sentiment Classification: Using AI models to automatically assign a sentiment score (positive, negative, neutral) to each mention.
- Topic & Theme Identification: Pinpointing the specific subjects of conversation, such as "customer service," "product quality," or "pricing," to understand the root cause of the sentiment.
When and Why to Use Social Media Sentiment Analysis
This is one of the most effective customer satisfaction measurement methods for understanding brand reputation and market trends in real-time. It is ideal for consumer-facing brands that want to monitor campaign effectiveness, manage potential PR crises, and gather competitive intelligence. For instance, Netflix famously monitors social media reactions to its content to inform creative and marketing decisions, while United Airlines uses sentiment analysis for rapid service recovery when customer complaints spike online.
Actionable Implementation Tips
To effectively use social media sentiment analysis, focus on converting raw data into strategic actions.
- Combine with Traditional Metrics: Correlate sentiment trends with your NPS, CSAT, or CES scores. A sudden drop in social sentiment can be an early warning sign that will later impact your internal survey results.
- Monitor Competitor Sentiment: Don’t just track your own brand. Analyzing the sentiment around your competitors reveals their weaknesses and highlights opportunities for you to differentiate your products or services.
- Set Up Real-Time Alerts: Configure your monitoring tools (like Brandwatch or Sprout Social) to send immediate alerts for significant shifts in sentiment or a sudden spike in negative mentions. This enables your team to respond to potential crises before they escalate.
- Focus on Actionable Insights: Move beyond simply reporting the percentage of positive or negative mentions. Dig into the "why" by analyzing the recurring topics and themes within each sentiment category to identify specific operational areas for improvement.
7. Customer Journey Analytics
Moving beyond single-interaction metrics, Customer Journey Analytics offers a holistic view of the customer experience. This method involves mapping and analyzing every interaction a customer has with your brand, from initial awareness to post-purchase support and advocacy. By connecting data from multiple touchpoints, it uncovers how cumulative experiences shape overall satisfaction, identifying critical moments of truth and friction points that individual surveys might miss.
Customer Journey Analytics synthesizes both quantitative data (e.g., website clicks, purchase history, support ticket volume) and qualitative feedback (e.g., survey comments, social media mentions) to create a comprehensive narrative. This method allows businesses to measure satisfaction not just at one point, but across the entire lifecycle, linking specific interactions to long-term loyalty and business outcomes.
Key stages typically analyzed include:
- Awareness: How customers first discover your brand.
- Consideration: The research and evaluation phase.
- Purchase: The transaction experience, whether online or in-store.
- Service & Onboarding: The initial experience post-purchase.
- Loyalty & Advocacy: Ongoing engagement, repeat purchases, and referrals.
When and Why to Use Customer Journey Analytics
This is one of the most powerful customer satisfaction measurement methods for businesses with complex, multi-channel customer lifecycles. It is essential for identifying and fixing systemic issues that cause dissatisfaction across different departments. Companies like Bank of America use it to analyze the end-to-end banking journey, while retailers like Target map the omnichannel experience to create seamless transitions between online and in-store shopping.
Key Insight: Customer satisfaction is often the sum of many micro-experiences. A journey-based approach reveals how a minor issue at one touchpoint can create a major satisfaction problem later, a blind spot for transaction-specific metrics.
Actionable Implementation Tips
To effectively implement Customer Journey Analytics, you must adopt a cross-functional and data-driven mindset.
- Map Key Journeys First: Don't try to map every possible path. Start by identifying the most common or highest-impact customer journeys, such as new user onboarding or the returns process, and focus your analysis there.
- Integrate Diverse Data Sources: Combine behavioral data from your CRM and analytics platforms with direct feedback from surveys (NPS, CSAT) and user interviews. Creating a unified view is crucial for accurate insights. For a deeper dive into consolidating complex information, you can learn more about how enterprise data analytics powers these initiatives.
- Assign Journey Ownership: Create cross-functional teams responsible for specific journeys. For example, a team with members from marketing, sales, product, and support should own the "new customer acquisition" journey to ensure a cohesive experience and quick implementation of improvements.
Customer Satisfaction Methods Comparison
| Item | Implementation Complexity 🔄 | Resource Requirements ⚡ | Expected Outcomes 📊 | Ideal Use Cases 💡 | Key Advantages ⭐ |
|---|---|---|---|---|---|
| Net Promoter Score (NPS) | Low - Single question survey | Low - Minimal setup | Moderate - Customer loyalty indicator | Customer loyalty benchmarking, referral growth | Simple, high response rates, benchmarkable |
| Customer Satisfaction Score (CSAT) | Low - Straightforward surveys | Low - Easy to deploy | Moderate - Satisfaction on specific touchpoints | Post-interaction feedback, product/service evaluation | Quick, versatile, real-time insights |
| Customer Effort Score (CES) | Low to Medium - Task-specific inquiries | Low to Medium - Needs trigger events | High - Predicts loyalty via ease of experience | Process improvement, reducing churn | Strong loyalty predictor, actionable for ops |
| Customer Health Score | High - Composite metric setup | High - Data integration & analytics | High - Predicts churn, health monitoring | SaaS/customer success, churn prevention | Comprehensive, proactive, data-driven |
| Voice of Customer (VoC) Programs | High - Multi-channel integration | High - Requires organizational resources | High - Holistic customer insights | Enterprise-wide CX programs, strategic insights | Comprehensive, cross-functional, strategic |
| Social Media Sentiment Analysis | Medium to High - NLP & ML integration | Medium to High - Technical tools & expertise | Moderate to High - Real-time sentiment tracking | Brand monitoring, issue identification | Real-time, broad reach, cost-effective |
| Customer Journey Analytics | High - End-to-end data integration | High - Cross-departmental coordination | High - Optimizes entire customer lifecycle | Omnichannel experience optimization | Holistic, identifies critical drivers |
From Data to Dollars: Turning Measurement into Action
Navigating the landscape of customer satisfaction measurement methods can feel like learning a new language. From the simplicity of a CSAT survey to the complexity of a comprehensive Customer Journey Analytics platform, each tool offers a distinct dialect for understanding your user base. As we've explored, methods like Net Promoter Score (NPS), Customer Satisfaction Score (CSAT), and Customer Effort Score (CES) provide crucial, quantifiable snapshots of user sentiment at specific touchpoints. They are the essential vocabulary for gauging immediate reactions and tracking performance over time.
However, relying solely on these scores is like hearing only a few words of a conversation. To grasp the full narrative, you must integrate qualitative and behavioral insights. This is where more holistic approaches like Voice of Customer (VoC) programs, Customer Health Scores, and Social Media Sentiment Analysis come into play. They add context, emotion, and predictive power to your data, revealing the underlying reasons behind the numbers and anticipating future customer behavior. A dip in your NPS is no longer an isolated metric; it’s a story explained by a frustrating user flow identified through journey analytics or a wave of negative sentiment on social media.
Unifying the Signals for a Holistic View
The real challenge, and the greatest opportunity, lies not in choosing a single "best" method, but in orchestrating several of them into a cohesive intelligence system. The modern customer experience is fragmented across multiple channels: support tickets, in-app feedback, social media comments, and product usage data. A truly mature customer-centric strategy synthesizes these disparate signals into a single source of truth.
Key Takeaway: Individual metrics are indicators; combined insights are a strategy. A low CSAT score might point to a problem, but cross-referencing it with a high CES and negative sentiment analysis reveals exactly where and why customers are struggling. This integration is what separates reactive problem-solving from proactive, strategic product development.
This unified approach prevents data silos and departmental blind spots. When your product, support, and marketing teams all draw from the same well of integrated customer insights, alignment becomes second nature. The product team can prioritize features based on quantified customer pain points, the support team can identify and preempt common issues, and the marketing team can craft messaging that resonates with the genuine voice of the customer.
From Measurement to Monetization
Ultimately, the goal of implementing robust customer satisfaction measurement methods is to build a more profitable, sustainable business. Happy customers are not just a vanity metric; they are a direct driver of revenue and a powerful defense against churn. By moving beyond simple data collection and focusing on actionable intelligence, you can directly link your customer satisfaction efforts to tangible business outcomes.
Here’s how to put this into practice:
- Prioritize with Impact: Don't treat all feedback equally. Use a combination of quantitative scores (like NPS) and qualitative data (like VoC analysis) to identify the issues that have the most significant impact on your most valuable customer segments.
- Close the Loop: Actively communicate with customers whose feedback you've implemented. Closing the feedback loop demonstrates that you are listening and reinforces their value, turning potentially dissatisfied users into loyal advocates.
- Operationalize Insights: Embed customer feedback directly into your operational workflows. Feed insights from journey analytics into your product roadmap sessions. Use real-time sentiment analysis to inform your customer support training. Make customer data an active participant in every strategic decision.
The journey from measuring satisfaction to mastering it is a continuous cycle of listening, analyzing, acting, and iterating. By thoughtfully selecting and combining the right customer satisfaction measurement methods, you transform customer feedback from a stream of raw data into your most valuable strategic asset. This is how you build a product that customers don't just use, but truly value and champion.
Ready to unify your customer feedback and turn insights into revenue? SigOS automatically analyzes data from all your customer channels, identifies the highest-impact issues, and provides a clear, prioritized roadmap to boost satisfaction and retention. Discover how SigOS can transform your customer satisfaction measurement strategy today.
Keep Reading
More insights from our blog


Ready to find your hidden revenue leaks?
Start analyzing your customer feedback and discover insights that drive revenue.
Start Free Trial →