Solving Data Quality Issues for Modern Teams
Struggling with bad data? Learn to identify and solve the most common data quality issues with actionable strategies for SaaS and data teams.

When we talk about data quality issues, we're talking about any flaw that makes your data unreliable for its real-world job. Think of it as data that’s inaccurate, missing key pieces, or just plain inconsistent. These aren't just minor glitches; they're the silent killers of business intelligence and AI projects, leading to bad decisions, financial hits, and operational chaos.
The Hidden Costs of Unreliable Data
Let's be real—bad data isn't just a technical nuisance; it's a massive strategic liability. Imagine your data is the foundation of a skyscraper. If that foundation is full of cracks, everything you build on it, from your financial reports to your shiny new AI models, is at risk of crumbling. The scary part is that these cracks are often invisible until the damage is done.
What seems like a tiny error can snowball into a huge problem. A single wrong customer address means wasted marketing dollars. A duplicated sales entry completely throws off your revenue forecasts. These small mistakes add up, sending ripples of confusion across your entire company.
The Real-World Consequences
For SaaS product and data teams, the stakes couldn't be higher. Flawed data doesn't just mess up a dashboard; it undermines the very products you build and the insights you promise to deliver.
Here are a few scenarios that probably hit close to home:
- Unreliable AI Models: Feed an AI model garbage data, and you'll get garbage predictions. This leads to bizarre product recommendations, wildly inaccurate churn predictions, and biased automated decisions that can seriously tick off your customers.
- Eroded Customer Trust: Ever sent an invoice to the wrong person or personalized an email with outdated info? It seems small, but it slowly chips away at customer confidence. These mistakes make you look sloppy and can eventually push users right into the arms of a competitor.
- Wasted Engineering Resources: How much time does your team spend on "data janitor" work? Manually cleaning, validating, and putting out data fires is a huge time suck that pulls your best people away from innovation and high-value analysis.
For any organization that wants to stay in the game, making data quality a priority is non-negotiable. The first step is admitting you have a problem. The next is building a solid plan to find, fix, and prevent the data issues that are holding you back. This guide will give you that framework.
Decoding the Six Dimensions of Data Quality
The term "good data" can feel a bit vague, but it's not some kind of mystical concept. At its core, high-quality data is simply data that's fit for the job you need it to do. Think of it like cooking a gourmet meal—if you start with the wrong ingredients, or if they’re stale or incomplete, the final dish is going to be a letdown, no matter how talented the chef is.
It's the same with data. Even the most sophisticated AI models and beautiful analytics dashboards will fall flat if the data feeding them is garbage. To get our arms around this, we can break down "good data" into six core dimensions. This framework gives product and data teams a shared language and a practical way to diagnose and fix data quality problems.
1. Accuracy
Accuracy is probably the one that comes to mind first. It’s all about whether your data correctly reflects reality. Does that customer email address actually belong to them? Is the purchase price logged in your system the amount they really paid?
In a SaaS context, an accuracy flaw might be a user’s subscription getting logged as "Pro" when they're actually on the "Free" plan. This single mistake can throw everything off, leading to bad user segmentation, skewed revenue forecasts, and product decisions based on a complete misunderstanding of what your "Pro" users are doing.
2. Completeness
Next up is completeness, which is just what it sounds like: are there any missing pieces? A dataset is complete if all the required data points are actually there. Missing values can bring analysis to a screeching halt, and many machine learning models simply can't run with empty fields.
Picture this: your onboarding flow has a field for a new user's industry, but it's optional. When the analytics team goes to analyze product adoption by industry, they discover 40% of user profiles have a big, empty gap where that data should be. The whole analysis is now on shaky ground.
This infographic helps paint a picture of how these seemingly small data issues snowball into major business costs, from direct financial losses to untrustworthy AI and a loss of customer confidence.
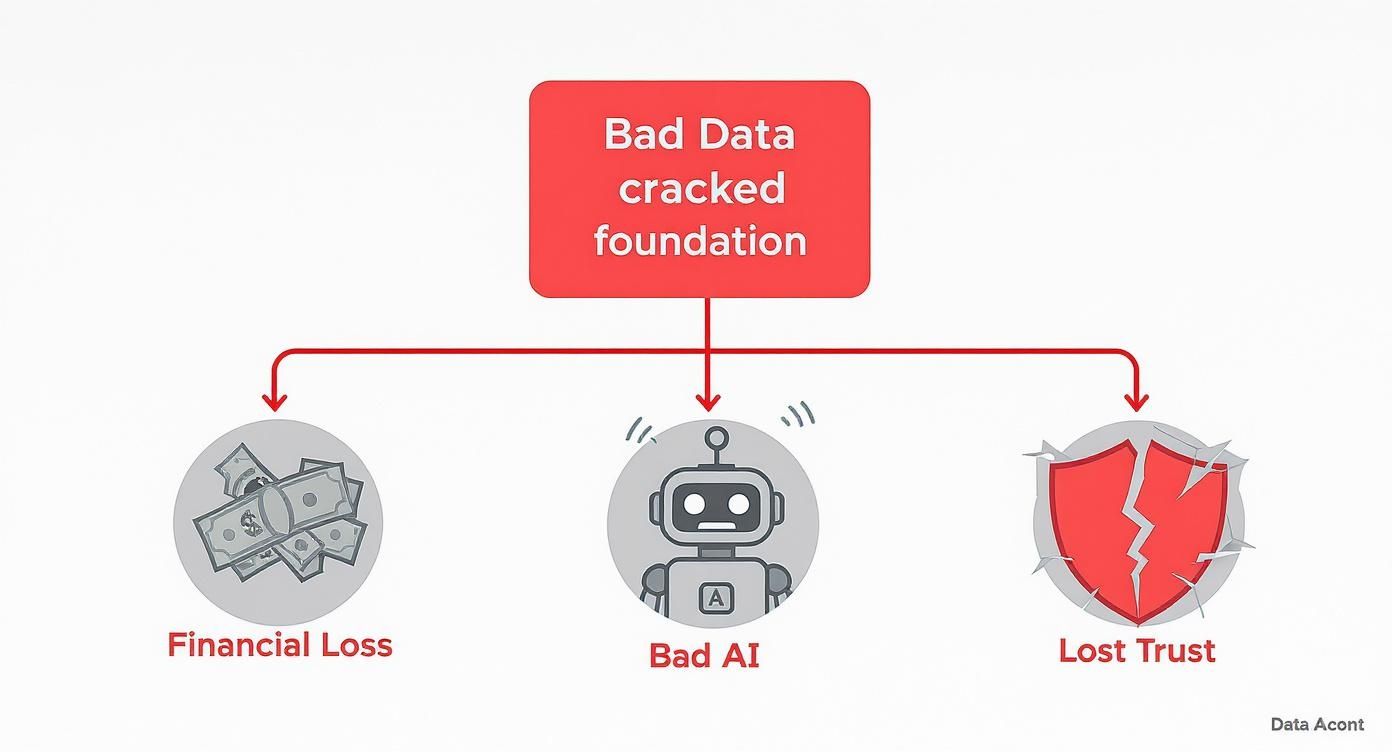
It’s clear that bad data isn't just a technical headache. It's a fundamental business risk with expensive and wide-ranging consequences.
3. Consistency
Consistency means that the same piece of information is represented the exact same way, no matter where you look. If your CRM lists a customer’s location as "New York," but your billing system has it down as "NY," you’ve got a consistency problem.
While it might seem trivial, these little discrepancies create chaos. A sales team might pull a report on customers in "NY" and completely miss everyone tagged as "New York," leading them to completely misjudge the size of their regional customer base.
4. Timeliness
Data has a shelf life. Timeliness is all about whether your data is available when you actually need it to make a decision. Even perfectly accurate and complete data is worthless if it shows up too late.
Take a churn prediction model, for example. If the user activity data feeding the model is delayed by a full 24 hours, it might flag a customer as "at-risk" a day after they've already canceled. The window of opportunity to step in with a retention offer has slammed shut, all because the data wasn't timely.
5. Uniqueness
Uniqueness is about ensuring you don't have duplicate records cluttering up your dataset. Duplicates are a classic data quality gremlin, known for inflating metrics and causing all sorts of operational confusion.
If a user signs up once with "john.doe@email.com" and a second time with "johndoe@email.com," they can end up as two separate entities in your system. This might mean they get spammed with duplicate marketing messages, but more importantly, it means you're overcounting your total number of unique users.
6. Validity
Finally, there’s validity. This dimension checks if your data is in the right format and follows the rules you’ve set. A "date" field should contain an actual date, not just a random string of text. An "email" field should look like a real email address.
A validity issue happens when a user types "N/A" into a phone number field that your system expects to contain only numbers. When a downstream process tries to handle that field as a number, it's going to break, potentially crashing a workflow or corrupting a report.
To tie this all together, here's a quick summary of the six dimensions, what they mean in practice, and the kind of damage they can do if ignored.
The Six Dimensions of Data Quality
| Dimension | What It Means | Key Question | Business Impact Example |
|---|---|---|---|
| Accuracy | The data correctly reflects the real-world object or event. | "Is this information correct?" | An incorrect address leads to a failed product shipment and a frustrated customer. |
| Completeness | All required data is present. | "Are we missing any information?" | Missing customer contact info prevents the sales team from following up on a lead. |
| Consistency | Data is the same across different systems. | "Does this information match elsewhere?" | Mismatched product names ("T-Shirt" vs "Tee") split inventory and skew sales reports. |
| Timeliness | The data is available when needed. | "Is this information recent enough to be useful?" | Stock level data that's 12 hours old causes the e-commerce site to sell out-of-stock items. |
| Uniqueness | Each record represents a single, unique entity. | "Is this a duplicate record?" | A customer exists twice in the CRM, leading to confusing service interactions and skewed analytics. |
| Validity | Data conforms to a required format or standard. | "Is the information in the correct format?" | A date entered as "Feb 2nd, 2024" instead of "2024-02-02" causes a data import to fail. |
Getting a handle on these six dimensions is the first, most crucial step toward building data you can truly rely on to make smart decisions.
Finding the Root Causes of Poor Data Quality
Data quality problems don't just happen. They're symptoms of deeper issues lurking in your company's systems and day-to-day operations. Constantly cleaning up bad data feels like patching a leaky pipe over and over without ever fixing the crack—it’s a temporary fix, not a real solution.
To stop the leaks for good, you have to play detective. It’s about tracing the symptoms back to their source so you can fix the underlying problem once and for all. When you dig in, you’ll find that almost all data quality issues boil down to one of three core areas: people, process, or technology.
People: The Human Element
Let's start with the most common culprit: us. Human error is behind a huge chunk of data quality issues. Even with the best intentions, manual data entry is a minefield of typos, misspellings, and simple mistakes.
Imagine a busy sales rep quickly typing a new contact into the CRM. They might enter "CA" for California in one record and "Calif." in another. On its own, it’s a tiny mistake. But multiply that by hundreds of reps over thousands of entries, and you've got a dataset riddled with inconsistencies, making accurate reporting a nightmare.
Here are some classic people-driven problems:
- Manual Entry Errors: The usual suspects—typos, transposed numbers, and formatting mistakes.
- Lack of Training: If your team doesn't understand why data standards matter or how to use a tool properly, errors are practically guaranteed.
- Subjective Interpretation: Different people see things differently. One support agent might log a ticket's priority as "High" while another, looking at a similar issue, calls it "Urgent." Without clear definitions, you get inconsistent data.
Process: When Your Workflows are Broken
If people introduce errors one by one, broken processes create them at scale. These issues pop up when you have flawed, inconsistent, or non-existent rules for how data should be handled from the moment it’s created to the moment it's used.
Think about a company where the marketing team uses the full state name ("California") in their database, but the sales team uses the two-letter code ("CA"). When someone tries to merge those two lists for a company-wide analysis, the result is chaos. You can't accurately segment customers by state because the data doesn't line up.
This kind of mess is a classic sign of poor data governance—the lack of a unified playbook that everyone agrees to follow. Without shared standards, each team operates in its own silo, unknowingly fueling the data quality crisis. Beyond initial collection, problems often get worse when you try to bring different data sources together. For a closer look at these challenges, explore how to solve common data integration problems.
Technology: When the Systems Fail You
Finally, your own tech stack can be the source of your data woes. Faulty system integrations, poorly designed databases, and botched data migration projects can corrupt your data without a single person making a mistake.
A common example is a flaky API connection between your CRM and marketing automation platform. If it's not set up right, it might fail to sync new leads, chop off important information, or overwrite good data with old data. The systems are technically talking to each other, but they're not speaking the same language, creating a constant stream of errors your team has to clean up.
Other technology-related culprits include:
- System Migrations: Moving data from an old system to a new one is incredibly risky. Data often gets lost, corrupted, or mapped to the wrong fields.
- Lack of Validation Rules: If your systems don't have built-in checks, they'll happily accept invalid data, like letting a user type "N/A" into a field that should only contain numbers.
- Poorly Constructed Data Pipelines: The pathways that ferry data between systems can be fragile. To learn how to build more resilient infrastructure, check out this guide on how to build data pipelines that protect data integrity from the start.
The Tangible Impact of Flawed Data
It's one thing to talk about data quality in the abstract, but the real wake-up call comes when you see the measurable consequences. Poor data isn't some theoretical risk you can ignore; it's an active drain on your resources, a saboteur of your strategy, and a genuine threat to your customer relationships. Flawed data creates a ripple effect, and those ripples are felt in every single department.
When your data is unreliable, it quietly poisons the well for everything that comes after. So, let's get specific and break down exactly how these issues translate into bottom-line pain. The financial cost alone is staggering. Gartner reports that organizations lose an average of 15 million annually due to poor data quality. Zooming out, IBM once estimated this problem costs U.S. businesses a mind-boggling ****3.1 trillion per year. You can dig deeper into the steep costs of data quality problems in recent industry analyses.

These aren't just numbers on a slide. They’re the direct result of specific failures that all start with a single, flawed data point.
Financial Losses and Wasted Resources
The most immediate and obvious hit is to your company's finances. Every piece of incorrect data represents a potential for wasted spend and lost revenue. Think of it as a slow, steady bleed that often goes unnoticed until it becomes a significant wound.
Let’s take a simple marketing campaign. Your team launches a targeted email blast to 10,000 "high-value" leads. The problem? Due to simple data entry errors and outdated records, 15% of the email addresses are invalid, and another 10% are duplicates.
Right off the bat, you've paid to message 2,500 non-existent or redundant contacts. The immediate cost is wasted software fees and completely skewed engagement metrics. But the real loss is the opportunity cost—the 1,500 real leads you could have reached if your budget wasn't being thrown at ghosts in the machine.
Operational Drag and Inefficiency
Beyond the direct financial hit, bad data is a massive productivity killer. Your highly skilled data scientists, analysts, and engineers end up moonlighting as "data janitors" instead of driving the business forward. They’re forced to manually clean, validate, and stitch together fragmented datasets before they can even begin their actual work.
Imagine your product team wants to analyze feature adoption to plan the next quarter's roadmap. But the usage data is a mess—some events are logged as "user_clicked_button" while others are recorded as "Button-Click-Event." The analyst now has to spend days just untangling this knot to get a clear picture. That's a week of strategic analysis down the drain, all lost to preventable data chaos.
Flawed Strategic Decision-Making
This might be the most dangerous consequence of all: the erosion of sound decision-making. When you can’t trust your data, you’re essentially flying blind. Leaders are forced to rely on gut feelings or anecdotal evidence, which is a terrifyingly risky way to run a business.
Bad data leads to flawed conclusions that can send your entire strategy careening in the wrong direction. A SaaS company might see skewed analytics suggesting that very few users are engaging with a key feature. Based on this "data," they decide to deprecate it, pouring engineering resources into ripping it out and building a replacement.
Only later do they discover a bug in their data pipeline was massively underreporting usage for that specific feature. It was actually popular and valuable. The company just wasted an entire quarter of development effort—and alienated a loyal segment of its user base—all because they made a confident decision based on faulty information.
Damaged Reputation and Customer Trust
Ultimately, the impact of poor data spills over to your customers, chipping away at the trust you’ve worked so hard to build. These internal errors manifest externally in ways that make your company look incompetent and unreliable.
Just think about these all-too-common scenarios:
- Incorrect Billing: Sending a customer an invoice for the wrong amount or for a service they already canceled.
- Failed Personalization: Addressing a marketing email to the wrong person ("Hi, [FirstName]!") or referencing an incorrect purchase history.
- Poor Customer Support: Agents lack a unified view of a customer's history, forcing the customer to repeat their issue over and over again to different reps.
Each of these experiences, born from data quality issues, creates friction and frustration. It slowly pushes even your most loyal users to look for a more dependable alternative. In the end, good data isn’t just about clean spreadsheets; it’s fundamental to delivering a professional and trustworthy customer experience.
A Practical Framework For Fixing Data Issues

Knowing what causes bad data is one thing, but that knowledge won't clean up your database on its own. It's time to move from diagnosis to action. This means adopting a systematic framework that not only fixes the data quality problems you have today but also stops new ones from creeping in.
Trying to tackle all your data problems at once can feel like an impossible task. But if you break the process down into manageable stages—detection, remediation, and prevention—you can start to gain real control. This approach turns the chaotic firefight of data quality into a structured, repeatable process.
Stage 1: Start With Smart Detection
You can't fix what you can't see. So, the first step in any data quality initiative is figuring out where the problems are hiding. This requires getting ahead of the curve instead of just waiting for a stakeholder to complain about a broken dashboard.
This is where data profiling comes in. Think of it as a health checkup for your datasets. Profiling involves examining your data to get a clear picture of its structure, content, and relationships. Tools scan your data and provide statistical summaries that highlight red flags like:
- Value Distributions: Are the values in a column falling within an expected range?
- Null Counts: How many fields are empty, and is that number trending up?
- Cardinality: How many unique values does a column contain?
This initial analysis gives you a solid baseline of your data's health and points you directly toward the most glaring issues.
Stage 2: Remediate and Repair Your Data
Once you’ve identified the problems, it's time for remediation—the hands-on work of cleaning and repairing your flawed data. This is often where teams get bogged down, spending countless hours correcting inaccuracies and filling in the gaps.
Effective remediation usually involves a few core activities:
- Data Cleansing: This is the act of correcting or removing inaccurate, corrupt, or duplicate records. A common example is running a script to find and merge duplicate customer profiles with slightly different email spellings.
- Standardization: This is all about bringing data into a consistent, common format. A simple case is converting all state abbreviations like "Calif." and "Ca." to the standard "CA."
- Enrichment: This practice improves your existing data by adding information from other sources. For instance, you could enrich customer profiles with firmographic data (like company size or industry) to build better market segments.
Fixing data is often a heavy lift. Monitoring of over 11 million data tables found that teams spend an average of 15 hours or more just to resolve a single significant data quality incident. That's a lot of lost time that could be spent on innovation.
Stage 3: Shift to Proactive Prevention
Remediation is crucial, but it's a reactive game. The real goal is to stop bad data from getting into your systems in the first place. This requires a shift in both culture and technology, embedding quality checks directly into your data's lifecycle from day one.
A proactive approach means building a strong defense at the source. This starts with clear data governance policies that define ownership, standards, and rules for your most important data assets. For deep, lasting improvements, many companies explore data modernization services to overhaul their infrastructure and address the root causes of poor data.
The most effective data quality strategies focus on preventing errors before they happen. It’s far cheaper and more efficient to stop bad data at the door than to clean it up later.
Automated monitoring and alerting are also key. Modern data observability platforms can continuously watch your data pipelines for anomalies—like a sudden drop in record volume or an unexpected schema change—and notify your team before these issues ever impact downstream applications. Integrating these systems requires a solid game plan; you can learn more about the necessary steps in our guide to data integration best practices.
By combining strong governance with automated monitoring, you can finally move from constantly putting out fires to building a resilient, high-quality data ecosystem.
The journey from reactive to proactive data management is a fundamental shift in mindset. While reactive measures are necessary for immediate fixes, proactive strategies are what build long-term trust and reliability in your data.
Proactive vs. Reactive Data Quality Strategies
| Approach | Proactive Strategy | Reactive Strategy |
|---|---|---|
| Timing | Prevents errors at the point of data entry or creation. | Corrects errors after they have been identified in the database. |
| Methods | Data governance, validation rules, automated monitoring, schema enforcement. | Data cleansing, manual corrections, deduplication scripts. |
| Cost | Lower long-term cost; prevents costly downstream impacts. | High long-term cost; involves repeated manual effort and can lead to bad business decisions. |
| Focus | Building a resilient data ecosystem and fostering a culture of quality. | Firefighting immediate problems and responding to stakeholder complaints. |
| Outcome | High, sustained data quality and increased trust across the organization. | Temporary fixes and a recurring cycle of data quality issues. |
Ultimately, a balanced approach is often the most practical starting point. You'll need reactive methods to clean up the existing mess, but the goal should always be to invest more time and resources into proactive measures that deliver lasting value.
Building a Lasting Culture of Data Quality
Tools and processes will get you part of the way there, but fixing data quality issues is only half the battle. If you want these fixes to stick, you have to treat data quality less like a technical problem and more like a cultural standard. Real, sustainable improvement happens when data excellence becomes a shared responsibility across the entire business, not just a task for the IT department.
Think of it like job site safety. You can hang up a few warning signs and hand out a rulebook, but a true safety culture only emerges when every single person on site feels responsible for spotting and reporting hazards. It's the same with data. A strong data quality culture empowers every team member to be a guardian of the company's data.
Fostering Shared Ownership and Accountability
The first step is getting rid of the "somebody else's problem" mindset. When everyone supposedly owns the data, it usually means no one actually does. This is where creating dedicated roles like data stewards is a game-changer. These don't have to be new hires; they can be people already embedded in the business—like a senior product manager or a lead sales analyst—who become the formally recognized owner for data in their specific domain.
Assigning this ownership naturally creates accountability. When a marketing manager is officially the steward for customer contact data, you can bet they’ll have a vested interest in keeping it accurate and complete. This simple structure turns an abstract, company-wide problem into a concrete, personal responsibility.
You also need to make it incredibly easy for people to flag problems. If a sales rep spots an outdated phone number in a customer record, they need a frictionless way to report it. A simple "Report Data Issue" button built right into your CRM or other internal tools can make all the difference. This approach turns every employee into a frontline sensor for data issues.
A strong data quality culture is built on the principle of shared responsibility. It democratizes the process, making it easy for anyone to contribute to data integrity, which ultimately strengthens the entire organization's decision-making capabilities.
Driving Adoption from the Top Down
For this cultural shift to actually take hold, it has to start at the top. When leadership consistently talks about why reliable data matters and connects it directly to business goals, everyone else listens. This commitment needs to be more than just talk; it means dedicating real resources to training, tools, and time.
This is where continuous data literacy training comes in. These sessions shouldn't be dry, technical lectures. Instead, they should focus on the real-world impact of good and bad data on each person's daily job. For a more structured approach, you can even adapt frameworks from quality assurance process improvement that work just as well for data as they do for software.
Finally, you have to celebrate the wins. When a team’s hard work leads to a tangible result—like a 15% reduction in bounced marketing emails or a noticeably cleaner sales pipeline—make sure everyone knows about it. This kind of positive reinforcement is powerful. It builds momentum and helps transform data quality from a chore into a celebrated asset that everyone sees as critical for growth.
Common Questions About Data Quality
Even after you've got a handle on the fundamentals, a few practical questions always seem to pop up. Here are some quick, straightforward answers to the things data and product teams ask most often.
What’s the Difference Between Data Quality and Data Observability?
It's a great question, and the distinction is simpler than you might think.
Think of it like this: **data quality is the **what, and **data observability is the **how.
- Data Quality is the state of your data. It's the goal line. Is your data fit for purpose? Is it accurate, complete, consistent, and ready to be used for making a critical business decision? That’s data quality.
- Data Observability is the set of practices and tools you use to understand the health of your data systems in real-time. It’s your monitoring system, your smoke alarm. It doesn’t just tell you a dashboard is broken; it helps you see why it broke—a pipeline failed upstream, an API schema changed unexpectedly, etc.
So, you set your data quality standards, and you use data observability to continuously monitor your systems to make sure you're hitting them.
How Do I Start Improving My Company's Data Quality?
The thought of a massive, company-wide data quality initiative is enough to give anyone analysis paralysis. The secret? Don't do that.
Instead, start small and aim for a quick, meaningful win.
- Find the Squeaky Wheel: Where does bad data cause the most headaches? Is it in your sales lead routing? Your product onboarding funnel? Pick one specific, high-pain area.
- Scope It Out: Look at the data that fuels that one process. Run some basic checks to see what the most frequent problems are. You'll likely find a lot of low-hanging fruit, like missing email addresses or inconsistent state abbreviations.
- Make One Targeted Fix: Don’t try to solve everything at once. Focus on one problem. Maybe you implement a validation rule on a key sign-up form field or run a script to standardize your existing customer contact list.
- Show Your Work: This is the most important part. Connect your fix to a real business outcome. "We cleaned up 5,000 contact records, which cut our email bounce rate by 10%." That kind of result gets attention and earns you the political capital to tackle bigger projects.
The goal isn't to boil the ocean. It's to start a ripple. Prove the value in one small area, and you’ll build the momentum you need for a much larger, more impactful data quality program.
At SigOS, we help teams transform qualitative feedback into revenue-driving insights by identifying the signal in the noise. Our platform analyzes customer interactions to pinpoint the data quality issues and feature requests that have the biggest financial impact, so you can stop guessing and start prioritizing what truly matters. Discover how to build a better product.
Keep Reading
More insights from our blog


Ready to find your hidden revenue leaks?
Start analyzing your customer feedback and discover insights that drive revenue.
Start Free Trial →