How to Determine Statistical Significance
Learn how to determine statistical significance with practical examples. This guide demystifies p-values and hypothesis testing for confident data analysis.

So, how do you actually figure out if your results are statistically significant? The key is calculating a p-value, which is just a number that tells you the probability that what you observed happened purely by random chance.
If that p-value dips below a specific threshold—the industry standard is usually 0.05—you can consider your finding statistically significant. This means it's probably a real effect and not just a statistical fluke.
What Is Statistical Significance Anyway?

Let's cut through the jargon. At its heart, statistical significance is a reality check for your data. It’s the tool that helps you decide if your findings, like a jump in conversions after a website redesign, are a genuine result of your changes or just random noise in the numbers.
Think of it as the difference between acting on a hunch and acting on solid evidence. It lets you say with confidence, "Yes, our new landing page design is actually working," instead of just guessing.
The Gatekeeper for Smart Decisions
Imagine you're A/B testing two email subject lines. Version A gets a 25% open rate, while Version B gets 27%. Is B the clear winner? Maybe, maybe not. That 2% difference could easily be random variation, especially if you're working with a smaller sample size.
This is where statistical significance acts as a gatekeeper. It tells you whether that 2% lift is meaningful enough to bet your next campaign on. Without it, you’re just flying blind and risk making some costly mistakes.
You might end up:
- Chasing Ghosts: Wasting time and money by acting on random fluctuations you thought were real trends.
- Missing Opportunities: Dismissing a genuine effect because it didn't seem dramatic enough at first glance.
- Losing Credibility: Making business decisions based on flimsy data that doesn't hold up to scrutiny.
Getting a handle on statistical significance is a game-changer. It empowers you to validate your insights and make much smarter choices, whether you're in marketing, product, or finance. Once you've validated these insights, you can dig even deeper into user patterns, which our guide on what is behavioral analytics explores in more detail.
To get a better grip on this, it helps to understand the key terms you'll run into. This table breaks down the essentials.
Core Concepts of Statistical Significance Explained
| Term | What It Is | Simple Analogy |
|---|---|---|
| P-value | The probability of seeing your results if there was no real effect. | Think of it as the "fluke factor." A low p-value (like 0.01) means it's very unlikely your result was a random fluke. |
| Alpha (α) | The threshold you set for significance, usually 0.05. If p < α, it's significant. | This is your "bar for belief." You've decided ahead of time that you'll only believe a result if it's less than 5% likely to be random. |
| Null Hypothesis | The default assumption that there is no effect or relationship. | The "nothing is happening" theory. For an A/B test, it would be "The new design has no effect on conversions." |
| Alternative Hypothesis | The idea you're testing—that there is an effect or relationship. | The "something is happening" theory. This would be "The new design increases conversions." |
Ultimately, your goal is to gather enough evidence to confidently reject the null hypothesis in favor of the alternative. These concepts are the building blocks that allow you to do that systematically.
The Foundation: A 1925 Idea
The tools we rely on today have a surprisingly long history. While the core ideas were brewing in the 18th century, the concept was truly formalized by statistician Ronald Fisher in his 1925 book, "Statistical Methods for Research Workers."
It was Fisher who proposed the now-standard 0.05 (or 5%) probability cutoff for deciding whether to reject the "null hypothesis"—the idea that nothing interesting happened. That simple yet powerful threshold has been the bedrock of scientific and business testing ever since.
Asking the Right Questions: Crafting Your Hypotheses
Before you can get any meaningful answers from your data, you have to ask the right question. That's really all a hypothesis is—a way to frame your test so it has a clear purpose. It’s what transforms a fuzzy business goal into a sharp, measurable query.
At the heart of any statistical test are two competing ideas: the null hypothesis (H₀) and the alternative hypothesis (H₁).
The null hypothesis is your baseline, the default assumption. It’s the skeptical take that says there’s no real effect or difference between the groups you're looking at. Just think of it as the "status quo" or the "nothing to see here" theory.
For example, a product team might set their null hypothesis as: "Our new onboarding flow has no effect on user retention rates after 30 days."
Defining What You're Trying to Prove
The alternative hypothesis, on the other hand, is the reason you're running the test in the first place. It’s the claim you hope your data will back up, arguing that there is a real, measurable effect. This is your educated guess about what’s going to happen.
Following our example, the alternative hypothesis would be: "The new onboarding flow increases user retention rates after 30 days." Together, these two statements create a perfectly clear, testable scenario.
From Business Goals to Testable Statements
Let's look at a classic marketing scenario. A growth team wants to get more leads from their homepage. A goal like "increase leads" is a great start, but it's not a testable hypothesis.
To get there, you have to get specific.
- Null Hypothesis (H₀): Changing the call-to-action (CTA) button color from blue to orange will have no effect on the homepage's form submission rate.
- Alternative Hypothesis (H₁): Changing the CTA button from blue to orange will increase the homepage's form submission rate.
This level of detail is what makes a test work. You've defined the exact metric (form submission rate) and the specific change, which sets clear boundaries. You can get even more granular by focusing on specific user groups, which is a key part of what our guide on what is cohort analysis covers.
The whole idea of testing a hypothesis isn't new; it has deep roots in statistical theory. Back in 1733, Abraham de Moivre introduced the concept of the normal distribution curve. This classic bell curve, later refined by legends like Gauss and Laplace, became the backbone of statistical inference. It gives us a way to model the natural variation in data and test if what we're seeing is genuinely significant or just random noise predicted by the null hypothesis. You can find more details on the history of statistics on Wikipedia.
Choosing the Right Statistical Test
Once your hypotheses are clearly defined, the next big hurdle is picking the right tool for the job. Selecting a statistical test can feel intimidating, like staring at a massive, complicated flowchart. But honestly, it usually just comes down to answering a couple of simple questions about what you're trying to do.
Think of it like being a mechanic. You wouldn’t grab a wrench to hammer in a nail, right? It’s the same with data. Using a t-test when the situation really calls for a Chi-Square test will give you a useless, or worse, misleading result. Getting this choice right is what makes your conclusions trustworthy.
Matching the Test to Your Data
First things first, you have to ask: What kind of data am I actually working with?
Most of the time, your data will fall into one of two buckets. Continuous data is anything you can measure with numbers, like revenue, time on page, or conversion rates. On the other hand, categorical data is all about labels or groups—think customer segments ('new' vs. 'returning') or poll responses ('yes' vs. 'no').
The next question is just as straightforward: How many groups am I comparing? Are you doing a simple A/B test with two versions of a landing page? Or are you looking at the performance across three different ad campaigns?
Answering those two questions almost always points you directly to one of three workhorse statistical tests.
- T-Test: This is your go-to when you're comparing the average of two groups using continuous data. A perfect example is using a t-test to see if there's a meaningful difference in average order value between customers who used a discount code and those who didn't.
- ANOVA (Analysis of Variance): Reach for an ANOVA when you're comparing the averages of three or more groups with continuous data. Imagine you tested three different pricing models; an ANOVA would tell you if there’s a significant difference in monthly recurring revenue among them.
- Chi-Square Test: This test is built for comparing categorical data. A classic use case is testing if there's a significant relationship between two categories, like customer segment and their preferred product feature. For instance, are enterprise customers more likely to request Feature X than SMB customers?
This decision tree gives you a great visual of the simple logic: just compare your p-value to your significance level to make a call.
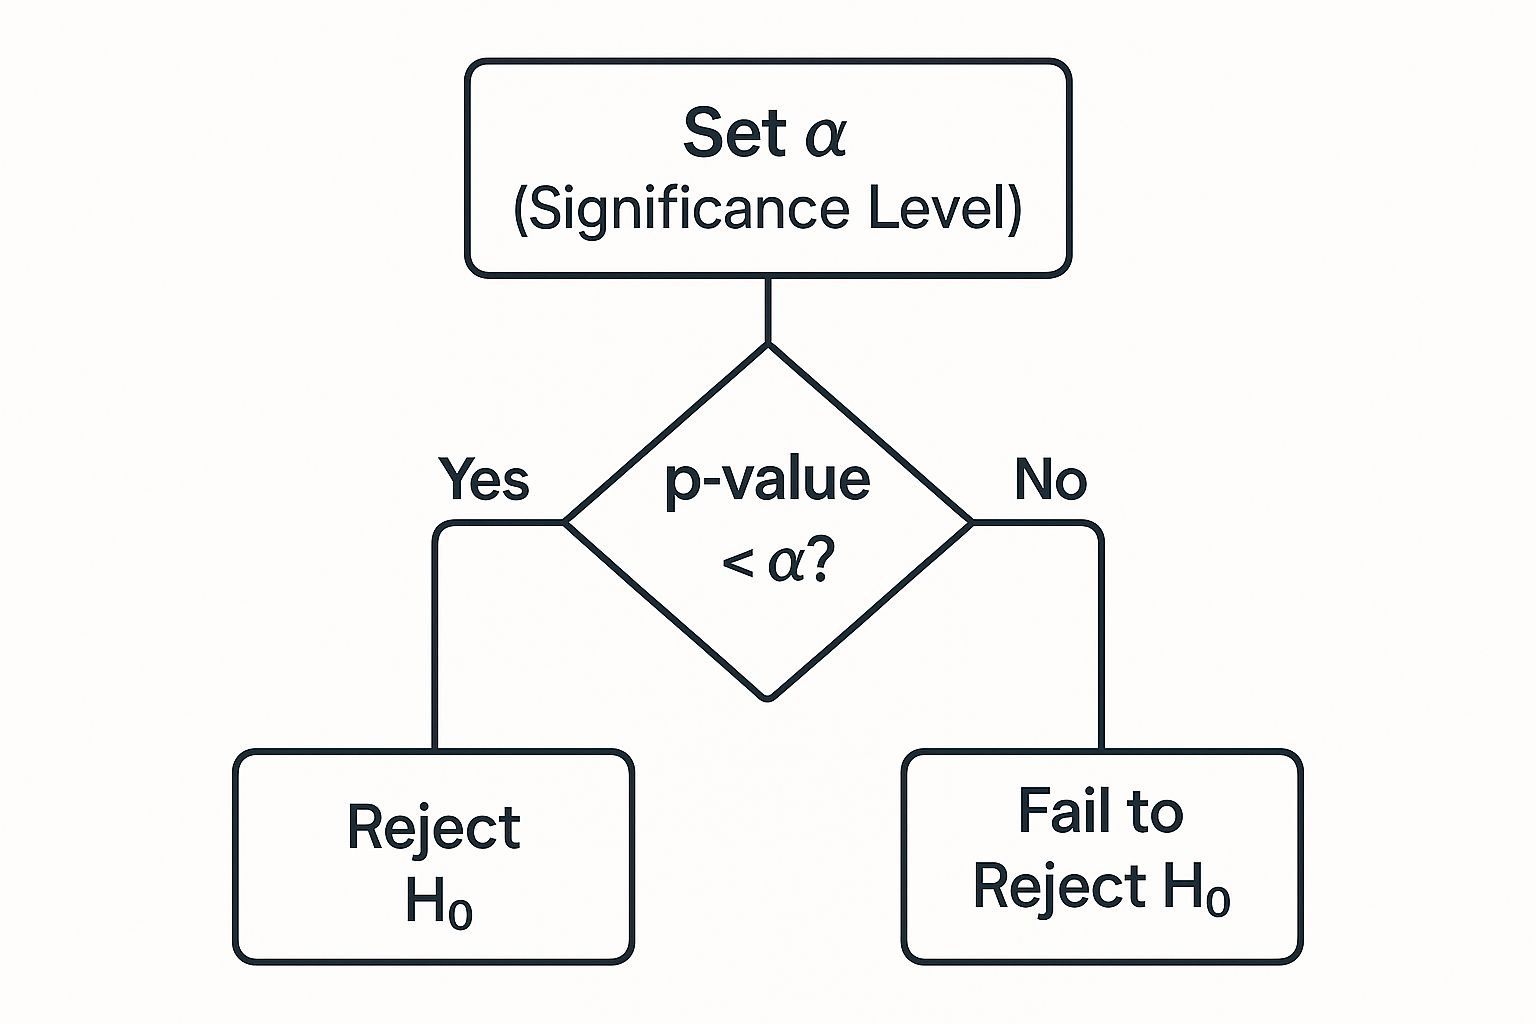
This graphic really boils down that final decision point you'll face after you’ve run the numbers.
A Quick Guide to Picking a Test
Choosing the right test can feel abstract, so I've put together a quick cheat sheet to help you connect your research question to the right statistical tool. This table covers the most common scenarios you'll run into.
Which Statistical Test Should You Use?
| Scenario | Type of Data | Common Test to Use |
|---|---|---|
| Comparing the average spending of two customer segments (e.g., A vs. B). | Continuous (average spending) | T-Test |
| Testing if there's a difference in click-through rates across three email subject lines. | Continuous (click-through rates) | ANOVA |
| Checking if there's a connection between user location (e.g., North America vs. Europe) and their plan type (e.g., Basic vs. Pro). | Categorical (location & plan) | Chi-Square Test |
While there are many other tests out there, these three are the bread and butter of business analytics. If you understand when to use them, you're already ahead of the game.
A Practical Scenario for Choosing a Test
Let's ground this with a real-world example. Imagine a SaaS company wants to improve user engagement. The product team has a couple of ideas and needs to pick the right tests to see if they actually work.
- Hypothesis 1: A new, streamlined user onboarding flow will increase the average number of key actions users complete in their first week.
- Data Type: Continuous (the average number of actions is a measurement).
- Groups: Two (the old flow vs. the new flow).
- Correct Test: A T-Test is perfect for this.
- Hypothesis 2: Users from different industries (Tech, Healthcare, Finance) have different primary use cases for the platform.
- Data Type: Categorical (both industry and use case are labels or groups).
- Groups: Three industry groups being compared.
- Correct Test: This calls for a Chi-Square Test.
Making these choices correctly is the foundation of generating reliable insights. For bigger companies, managing these tests across different teams and departments is a huge part of building a data-driven culture. If you're dealing with that kind of scale, you can learn more about managing this complexity in our guide to enterprise data analytics.
Getting to Grips with the P-Value

Once you've picked the right statistical test, all the number-crunching spits out one critical figure: the p-value. This little number is at the heart of everything we do in hypothesis testing, but it's also one of the most frequently misunderstood concepts out there. Nail this, and your decisions will be built on solid ground.
I like to think of the p-value as a "surprise meter." It’s designed to answer a very specific question: Assuming there’s actually no difference between my groups (i.e., the null hypothesis is true), what are the odds I’d see a result at least as extreme as the one I just got?
A tiny p-value means your results are highly surprising. They’re so unlikely to have happened by random chance that you have good reason to doubt the "no difference" assumption and reject the null hypothesis.
What’s a Good P-Value?
So, how small is small enough? By long-standing convention, the magic number is 0.05. This threshold, known as the alpha (α) level, means you're comfortable with a 5% chance of being wrong when you conclude there's a real effect (this is known as a Type I error).
Why 0.05? It’s mostly historical precedent, but it offers a practical middle ground—it protects you from jumping at shadows without being so strict that you miss genuine discoveries.
Here’s the simple breakdown:
- p ≤ 0.05: Your result is statistically significant. You can reject the null hypothesis. It’s a green light to conclude that what you observed is likely a real effect.
- p > 0.05: Your result is not statistically significant. You fail to reject the null hypothesis. This doesn't prove the null is true, it just means you don't have enough evidence to dismiss it.
The effect might be zero, or it might just be too small for your current study to detect. It's a crucial distinction.
A P-Value Example in the Wild
Let's go back to our A/B test. We're pitting a new green "Sign Up" button against our old blue one. The null hypothesis (H₀) is that color makes no difference to the sign-up rate.
You run the test and find the green button boosted conversions by 15%. You feed these results into a Chi-Square test, and out comes a p-value of 0.03.
Because 0.03 is less than 0.05, the result is statistically significant. You can confidently reject the null hypothesis. The data suggests the green button really does perform better, and the 15% lift you saw wasn't just a random fluke.
What if My P-Value Is on the Edge?
Now for the tricky part. What do you do with a p-value of, say, 0.06? It's so close to the 0.05 cutoff. Some people call this "marginally significant" or "trending towards significance."
My advice? Don’t get hung up on a rigid yes/no decision. See it as a yellow light—a signal to dig deeper.
- Look at the practical impact. Is the effect you observed meaningful for the business, even if it's not a statistical slam dunk? A small but positive lift might still be worth implementing.
- Check your sample size. Often, a p-value that's just over the line is a sign that you didn't collect enough data. A real effect might be hiding in there, but your test lacked the power to detect it. Running the experiment longer could be all it takes to push that p-value below 0.05.
At the end of the day, the p-value is a tool for measuring evidence against a default assumption. It's incredibly powerful, but it’s just one piece of a much larger puzzle.
Looking Beyond the P-Value

Getting a p-value below 0.05 can feel like the finish line. It's a huge milestone, and it tells you the result you’re seeing probably isn't a random accident. But for an experienced analyst, this is just the beginning of the story.
A statistically significant result doesn't automatically mean it's a practically meaningful one.
This is a lesson you learn quickly when you start working with massive datasets. With enough data, even the most microscopic, inconsequential differences can appear statistically significant. You might find that tweaking a button color from #FF5733 to #FF5732 gives you a "significant" lift in sign-ups. But does that tiny change actually matter enough to justify the engineering time to push it live? Probably not.
This is why you have to move past the simple "yes/no" of the p-value and ask the most important question in analytics: "So what?" The answer to that question comes from two key concepts that give your results much-needed context: effect size and confidence intervals.
How Big Is the Difference, Really?
This is where effect size comes in. It’s a straightforward, standardized way to measure the magnitude of the change you observed. While a p-value tells you if there’s an effect, the effect size tells you how big that effect is. It helps you see the practical impact without getting fooled by a large sample size.
Think about it this way: an A/B test shows a statistically significant lift in your conversion rate. The p-value confirms the increase is real. But the effect size is what tells you whether that was a 0.1% lift or a 10% lift. That context changes everything when you're making a business decision.
Understanding the Range of Uncertainty
Next up, you need to look at your confidence intervals. A confidence interval gives you a plausible range for the true effect in your entire user population, not just the sample you tested. It’s essentially the margin of error around your result.
A 95% confidence interval means you can be 95% sure that the true value for the entire population falls somewhere within that range. The width of that range is what tells you how much certainty you have.
- A narrow interval is a great sign. It means your estimate is pretty precise. A 5% lift with a confidence interval of [4.5%, 5.5%] is a finding you can take to the bank.
- A wide interval suggests a lot more uncertainty. A 5% lift with an interval of [1%, 9%] is still a positive result, but the true effect could be much smaller (or much larger) than the single number you measured.
By looking at the p-value, effect size, and confidence intervals together, you get the complete narrative. The p-value confirms the effect is real, the effect size tells you if it's big enough to care about, and the confidence interval shows you how precise your measurement is. This trifecta is the key to moving beyond basic test results and delivering genuinely valuable insights that shape strategy.
Common Questions I Get About Statistical Significance
Once you move past the textbook definitions and start working with real-world data, the questions get a lot trickier. The clean examples from class don't always apply, and you run into messy, gray areas. Let's walk through some of the most common questions that pop up when you're actually in the trenches, trying to make sense of your results.
One-Tailed vs. Two-Tailed Tests: What's the Real Difference?
The easiest way to think about this is to ask yourself: are you making a specific bet, or are you just curious if anything changed?
A one-tailed test is that specific bet. You're putting your money on the outcome going in only one direction. For example, you're testing a new feature and your hypothesis is that it will only increase user engagement. This test has more statistical power, but it comes with a big risk—if the feature accidentally decreases engagement, your test won't be designed to properly catch it.
A two-tailed test is your safety net. It's the standard choice for a reason. This test looks for a change in either direction—positive or negative. You'd use this to see if a new website headline performed differently than the old one, whether that difference was for better or worse.
A piece of advice from experience: Unless you have a very strong, pre-existing theory backed by prior research to justify a one-way prediction, just stick with a two-tailed test. It prevents you from being blindsided when a change you thought was a slam dunk actually hurts your metrics.
"My P-Value is 0.06... Now What?"
Ah, the dreaded 0.06. It’s so close to that magic 0.05 threshold, yet technically, you’re supposed to "fail to reject" the null hypothesis. It's frustrating, but don't just toss the experiment in the "failed" pile. A result like this is what many of us call "marginally significant" or "trending towards significance." It's not a dead end; it's a signal to dig a little deeper.
Before you make a final call, look at the whole picture:
- What's the effect size? A 10% increase in conversions with a p-value of 0.06 is a lot more compelling than a tiny 0.1% lift with the same p-value. The business impact might be there, even if the statistical certainty isn't quite locked in.
- Was my sample size too small? More often than not, a p-value hovering just above 0.05 suggests there probably is a real effect, but your test just didn't have enough power to detect it with confidence.
My first move here is usually to consider running the test a bit longer. Gathering more data is often all it takes to see that p-value dip below the 0.05 line and give you the confidence you need.
Can You Ever Actually Prove the Null Hypothesis?
This is a really important, and often misunderstood, concept. The short answer is no. You can never prove the null hypothesis is true.
Think about it this way: statistical tests are built to be skeptical. Their entire purpose is to see if you have enough evidence to reject the default assumption (the null).
If you run a test and get a high p-value, say 0.45, it doesn't mean you've proven there's no difference. It just means you "failed to reject" the null hypothesis. In plain English, your study didn't find sufficient evidence to say the null hypothesis is false. The true effect could actually be zero, or it could be a small effect that your experiment wasn't powerful enough to find.
At SigOS, we help you connect the dots between the numbers and the "why." Our AI-driven intelligence platform digs through customer feedback and behavioral data for you, surfacing the insights that have a real impact on your bottom line. Move beyond just p-values to see how your findings connect to revenue. Learn more about making smarter, data-driven decisions.


Ready to find your hidden revenue leaks?
Start analyzing your customer feedback and discover insights that drive revenue.
Start Free Trial →