how to do hypothesis testing: A Practical Guide
Learn how to do hypothesis testing with clear steps, examples, and interpretation to boost your data insights.

Hypothesis testing is really just a formal way of checking if your assumptions about a business metric are actually true. You start with a null hypothesis—basically, the default assumption that nothing has changed—and an alternative hypothesis, which is the new idea you're trying to prove. Then, you let the data decide which one is more likely to be correct. It’s how we move from gut feelings to data-driven decisions.
Translating Business Goals into Testable Hypotheses
Before you can even think about running a test, you have to get the question right. A goal like "improve user engagement" is way too fuzzy to be useful. The real work begins when you sharpen that broad objective into a specific, measurable statement. This is the absolute foundation of any good analysis; without it, you’ll end up with interesting numbers but no clear direction.
Everything revolves around two competing ideas: the null hypothesis (H₀) and the alternative hypothesis (H₁).
- Null Hypothesis (H₀): This is your baseline, the status quo. It always assumes there's no effect, no change, or no difference. For instance, "Changing the button color from blue to green has no effect on the sign-up rate."
- Alternative Hypothesis (H₁): This is your theory, the thing you believe is true and want to prove. It proposes that there is an effect or a difference. For example, "Changing the button color to green increases the sign-up rate."
This core concept has been around for centuries. One of the earliest examples comes from 1710, when a physician named John Arbuthnot studied 82 years of London birth records. He noticed more boys were born than girls every single year and used statistical reasoning to argue that this couldn't be just random chance—a very early, practical application of a null and alternative hypothesis.
From Business Questions to Formal Hypotheses
Let's make this real. Say your product team just shipped a redesigned onboarding flow and wants to know if it's actually reducing how many new users bail within their first week.
Here’s how you’d frame that:
- Business Question: Does our new onboarding flow reduce first-week churn?
- Null Hypothesis (H₀): The new onboarding flow has no effect on the first-week churn rate. The churn rate for users with the new flow is the same as the old flow.
- Alternative Hypothesis (H₁): The new onboarding flow reduces the first-week churn rate.
This structure forces you to be incredibly clear about what you're testing, which sets you up for a conclusive result. To get a handle on the entire process from start to finish, building a solid research plan is non-negotiable. Our guide on creating a sample research plan can walk you through how to outline every step. Doing this foundational work upfront ensures your test is perfectly aligned with your business goals from day one.
To help you get the hang of it, here are a few more common scenarios translated into formal hypotheses.
Hypothesis Formulation Examples
| Business Question | Null Hypothesis (H0) | Alternative Hypothesis (H1) |
|---|---|---|
| Does a new headline on the pricing page increase free trial sign-ups? | The new headline has no effect on the trial sign-up rate. | The new headline increases the trial sign-up rate. |
| Will a simplified checkout process reduce cart abandonment? | The simplified checkout process has no effect on the cart abandonment rate. | The simplified checkout process reduces the cart abandonment rate. |
| Does sending a push notification at 9 AM vs. 5 PM improve the open rate? | There is no difference in the open rate between notifications sent at 9 AM and 5 PM. | There is a difference in the open rate between notifications sent at 9 AM and 5 PM. |
Notice how each H₀ assumes the "no effect" scenario, while H₁ makes a specific, directional claim (increase, reduce) or a non-directional one (a difference exists). This is the disciplined thinking that separates guessing from testing.
Selecting the Right Statistical Test for Your Data
So, you've nailed down a crisp, testable hypothesis. What's next? You need to pick the right statistical tool for the job. This part is absolutely critical. Your entire analysis hinges on selecting a test that actually fits your data and the question you're asking.
Think of it this way: using the wrong test is like trying to measure a cup of flour with a tape measure. You'll get a number, sure, but it will be completely meaningless.
The good news is you don't need a Ph.D. in statistics to get this right. The decision really just boils down to understanding your data. Once you're comfortable with your hypothesis, knowing the basics of a few common tests and some statistical tools for data analysis like R or Python will make this step feel second nature.
This flowchart shows how a simple goal gets refined into the formal hypotheses that set you up for this decision.
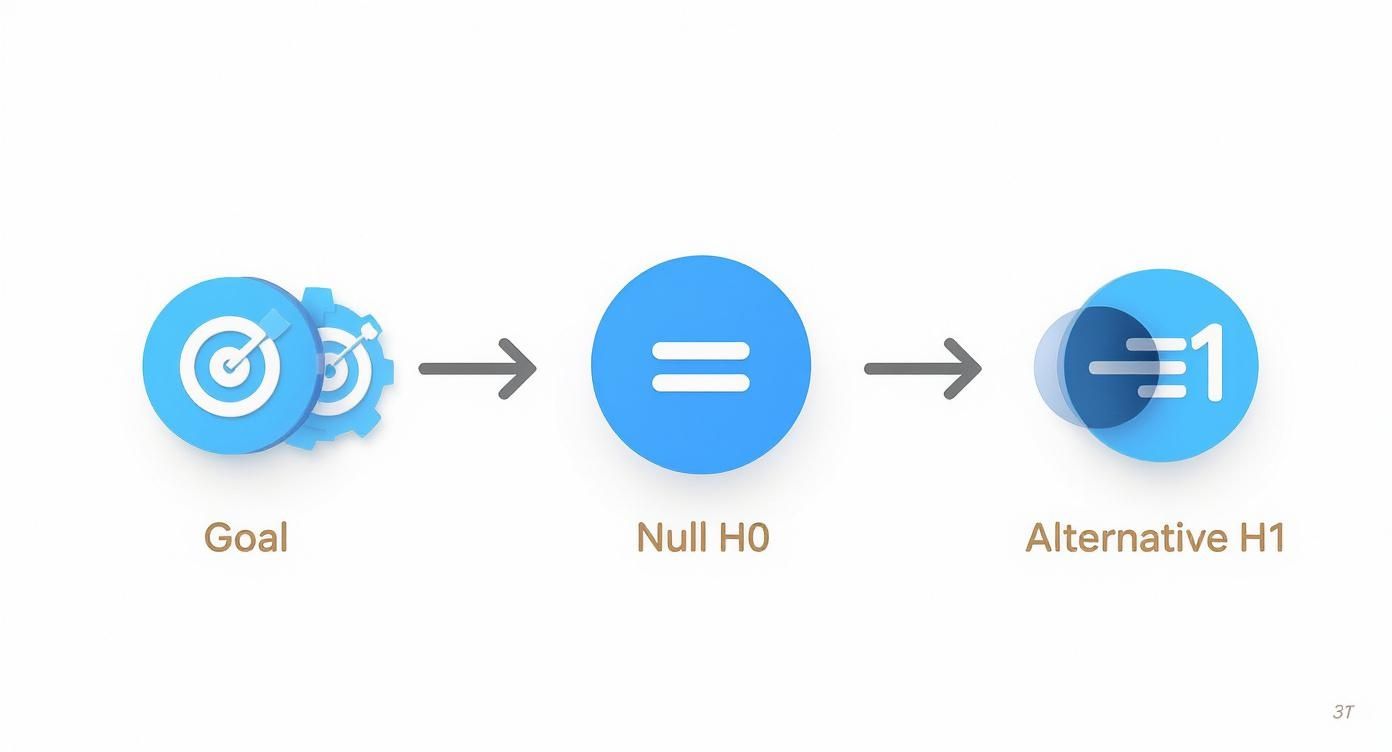
As you can see, every test starts with a clear goal, which we then formalize into a null hypothesis (H₀)—the "no effect" scenario—and an alternative hypothesis (H₁), which is what we're actually trying to prove.
Matching Data Types to Common Tests
The kind of data you're working with is the single biggest factor in choosing your test. In the world of product and growth, most of our metrics fall into one of two buckets: continuous or categorical.
- Continuous Data: This is any metric that can be a number on a scale. Think things like average session duration, time to complete onboarding, or monthly recurring revenue.
- Categorical Data: This is data that fits into distinct buckets or labels. The classic example is a conversion rate (converted vs. not converted), but it also includes user segments (free vs. paid) or feature adoption (used vs. not used).
Once you know which type of data you have, you can map it to one of the go-to statistical tests we use all the time in product analytics and A/B testing.
Let’s meet the workhorses of hypothesis testing.
The T-test
The T-test is your bread and butter when you're comparing the average (mean) of a continuous metric between two groups. It’s perfect for answering questions like:
- "Did our redesigned checkout flow actually reduce the average time to purchase?"
- "Is the average session duration higher for users who saw the new dashboard?"
The Chi-Squared Test (χ²)
When you're dealing with categorical data—like conversion rates—the Chi-Squared test is what you'll want to use. It helps you compare proportions between two or more groups to see if there's a real difference. It’s the standard for questions like:
- "Did changing our CTA button from blue to green lead to a statistically significant bump in sign-ups?"
ANOVA (Analysis of Variance)
What if you have three or more groups? For instance, you're testing a control against two different variations. This is where ANOVA comes in. It lets you compare the means of multiple groups with continuous data all at once.
You might be tempted to just run a bunch of T-tests between the groups, but that's a classic mistake. Doing that dramatically increases your chances of finding a false positive. ANOVA is the right tool for the job when you're running multivariate tests, like comparing the average revenue per user across three different pricing pages.
Getting Your Significance, Power, and Sample Size Right

Once you've nailed down your hypothesis and picked a statistical test, it's time to set the ground rules for the experiment. This is where three critical, interconnected concepts come into play: significance, power, and sample size.
Getting this trio right is what separates a trustworthy, conclusive test from one that’s just a waste of time and resources. Think of them as the control panel for your experiment. They help you balance the risks of making a bad call, so you don't roll out a feature that has zero real impact or, just as bad, kill a great idea because your test wasn't sensitive enough to spot its value.
Setting Your Significance Level (Alpha)
First up is the significance level, usually called alpha (α). This is your risk tolerance for a false positive—the chance you’ll reject the null hypothesis when it’s actually true.
In product terms, this means launching a new feature thinking it improved a metric when, in reality, the change was just random noise.
The industry standard is to set alpha at 0.05, which means you’re willing to live with a 5% chance of making this kind of mistake.
We dive deeper into this concept in our guide on what is statistical significance. Ultimately, this choice defines the critical p-value your test has to beat to be considered a success.
Understanding Statistical Power
While alpha guards against false positives, statistical power protects you from the opposite: a false negative. Power is the probability that your test will correctly detect a genuine effect if one actually exists. It's your test's ability to find the signal through all the noise.
Low power is a silent killer of promising experiments. Your team might have a brilliant idea that genuinely improves user retention, but if the test lacks power, the results will come back as "not significant," and the idea gets shelved. A power level of 80% is the typical target, meaning you have an 80% chance of detecting a real effect.
These ideas for managing errors didn't just appear out of nowhere. They were at the heart of historical debates between statistical giants like Ronald Fisher and Jerzy Neyman. Their work gave us the concepts of Type I and Type II errors and hammered home the importance of statistical power. The way we approach hypothesis testing today is a practical hybrid of their once-competing philosophies.
Determining the Right Sample Size
This all leads us to sample size. Significance and power aren't just abstract concepts; they are the core ingredients used to calculate the minimum number of users or data points you need for a reliable test. This calculation is called a power analysis.
Before you launch any A/B test, running a power analysis is non-negotiable. It forces you to think through four key inputs:
- Significance Level (α): Your chosen risk of a false positive (e.g., 0.05).
- Statistical Power (1-β): Your desired probability of detecting a real effect (e.g., 0.80).
- Baseline Conversion Rate: The current performance of your control group.
- Minimum Detectable Effect (MDE): The smallest improvement you actually care about detecting.
Plugging these values into a sample size calculator tells you exactly how many users need to go through your experiment. This one step can save you from running a test that was doomed from the start simply because it didn't have enough people to produce a reliable result.
Calculating and Interpreting Your Results
Alright, you've done the hard work of planning your test and collecting the data. Now for the exciting part—finding out what it all means. This is where you move from raw numbers to a clear verdict on your hypothesis.
At the heart of this process is the test statistic. Think of it as a single number that neatly summarizes how much your sample data differs from what you’d expect if your new feature or change had zero effect (the null hypothesis).
From that test statistic, we get the p-value, easily one of the most critical yet misunderstood concepts in statistics. Getting this right is what separates a smart product decision from a shot in the dark.

What the P-Value Really Tells You
Let's clear the air on a common misconception. The p-value is not the probability that your new idea is a winner. It's a little more specific than that.
I like to think of it as a "surprise-o-meter." If your p-value is tiny, say 0.01, it means there's only a 1% chance you'd see data like this if your change had no impact at all. That’s a huge surprise! It makes you seriously doubt your original assumption (the null hypothesis) and start believing your alternative hypothesis has merit.
When your calculated p-value is less than your significance level (your alpha, which is usually 0.05), you reject the null hypothesis. This is what we call a "statistically significant" result.
Going Beyond the P-Value
But hold on. A thumbs-up on statistical significance doesn't tell you the whole story. This is where so many teams go wrong. A result can be statistically real but practically worthless, which is why we need to look at effect size and confidence intervals.
- Effect Size: This tells you the magnitude of the change. The p-value might confirm your new headline drove more sign-ups, but the effect size answers by how much. Was it a massive 20% lift or a measly 0.5% bump?
- Confidence Intervals: This gives you a range of plausible values for the true effect. A 95% confidence interval of [2%, 8%] for a conversion lift means you can be 95% confident that the true, real-world improvement is somewhere between 2% and 8%.
These two metrics are your business decision co-pilots. A statistically significant result with a tiny effect size and a confidence interval barely above zero might not be worth the engineering resources to roll out.
Interpreting Test Outcomes
Pulling all three pieces—p-value, effect size, and confidence intervals—together gives you a complete picture for making a smart call. To make it even easier, here’s a quick cheat sheet for interpreting the most common scenarios you'll run into with your A/B tests.
Interpreting Test Outcomes
| Scenario | P-Value Result | Confidence Interval Insight | Actionable Decision |
|---|---|---|---|
| Clear Win | p < 0.05 | The entire range is positive and doesn't cross zero (e.g., [2.1%, 5.4%]). | Implement the change. You have strong evidence of a meaningful, positive impact. |
| Clear Loss | p < 0.05 | The entire range is negative and doesn't cross zero (e.g., [-4.5%, -1.2%]). | Do not implement. The change significantly harmed the metric. Revert and analyze why. |
| Inconclusive | p > 0.05 | The range includes zero (e.g., [-1.5%, 3.7%]). | Stick with the original. You don't have enough evidence to prove the change had any real effect. |
| Significant but Trivial | p < 0.05 | The range is positive but very close to zero (e.g., [0.1%, 0.4%]). | Decision depends on cost. The effect is real but small. Consider if the business impact justifies the implementation cost. |
This holistic view is the hallmark of a data-mature team. It shifts the conversation from a simple "did it work?" to a much more powerful "how well did it work, and is it truly worth it?"
Reporting Findings and Avoiding Common Pitfalls
You’ve crunched the numbers and your analysis is done. But your job isn't over yet—in fact, the most critical part is just beginning. How you communicate your findings is every bit as important as the rigor of your test. A confusing report can kill a brilliant insight, leading the team to make the wrong call.
Your goal is to tell a clear, honest story with the data that drives a decisive action.
A great report is a narrative, not a data dump. Start by grounding your audience—remind them of the original hypothesis. What was the business question we set out to answer? From there, briefly touch on your methodology: what test you ran, the sample size, and the significance level you agreed on beforehand.
Then, get to the good stuff. Present the key results, focusing on the metrics everyone cares about. Don't just show a p-value in isolation. To give the full picture, you need to pair it with the effect size and confidence intervals. This trio answers the three questions every stakeholder has:
- P-value: Is this effect real, or could it be random chance?
- Effect Size: Okay, it's real. But how big is the impact?
- Confidence Interval: And how certain are we about the size of that impact?
The final step is to translate the stats into plain English. What does this mean for the business? Make a clear recommendation. "Roll out the new feature to all users" or "Stick with the current design." Leave no room for ambiguity. If you want to make your reports even more compelling, take a look at our guide on the best practices for data visualization.
Common Traps to Watch Out For
Getting hypothesis testing right means knowing where the landmines are. A few common mistakes can completely derail your work, so let's walk through how to sidestep them.
One of the most tempting and dangerous is p-hacking. This is what happens when you keep slicing, dicing, and re-analyzing the data until a statistically significant result magically appears. It's the data equivalent of torture—if you torment it long enough, it will confess to anything. This is a surefire way to chase ghosts and celebrate false positives.
Another classic mistake is confusing statistical significance with practical significance. With a massive sample size, you might find a statistically significant lift of 0.1%. That result is technically "real," but is it meaningful? Probably not. An effect that small likely doesn't provide enough business value to justify the engineering effort to ship it. Always ask yourself: is the change big enough to matter?
Finally, watch out for the multiple comparisons problem. This sneaks up when you run many tests at once—say, testing 20 different headlines for a landing page. If your significance level is 5%, you have a pretty good chance of at least one of those tests showing a "significant" result purely by luck. When you absolutely must run multiple tests, you need to use a statistical correction, like the Bonferroni correction, to adjust your p-value threshold. It keeps you honest and ensures your findings are truly significant.
Frequently Asked Questions About Hypothesis Testing
As teams start folding hypothesis testing into their day-to-day, a few practical questions always pop up. These are the real-world details that can turn a simple test into a source of endless debate. Let's tackle some of the most common ones I hear.
Before diving in, if you're looking for a solid refresher on the fundamentals, a great guide on what is hypothesis testing in statistics can help build that foundational knowledge. Understanding the "why" makes the "how" so much clearer.
What’s the Difference Between a One-Tailed and Two-Tailed Test?
This is probably the first question people ask when setting up A/B tests. The choice between them really just depends on the question you're asking.
- A two-tailed test is your go-to, the standard choice for most product experiments. It’s designed to spot an effect in either direction—good or bad. Essentially, you're asking, "Did this new feature change user engagement at all?"
- A one-tailed test is more specific. It only looks for an effect in one particular direction. You'd use this if you were asking, "Did this change strictly increase our conversion rate?"
My Advice: Honestly, just stick with two-tailed tests. Unless you have an ironclad, business-critical reason to believe a change could only move the needle in one direction (which is rare), a two-tailed test is safer. It protects you from being blindsided by an unexpected negative outcome, which is often more important to catch than a positive one.
My P-Value Is 0.06. What Should I Do?
Ah, the classic "almost significant" result. It’s so tempting to round down and declare victory, but that's a dangerous path.
A p-value of 0.06 means you haven’t crossed the standard 0.05 threshold for statistical significance. Period. The correct, and only, interpretation is that you don’t have enough evidence to reject the null hypothesis. That means the difference you’re seeing is very likely just random noise.
Don’t move the goalposts after the game has started. Your best bet is to accept the result and stick with the original version. If the potential gain from the change is massive, your only real option is to consider re-running the test with a much larger sample to give it more statistical power.
How Do I Handle Hypothesis Testing with a Small Sample Size?
Small sample sizes are a fact of life, especially for startups or new product lines. The biggest problem they cause is low statistical power, meaning your test will struggle to detect a real effect even when it's there.
If your data is reasonably close to a normal distribution, a T-test might still be appropriate. But if the data is skewed or unusual, you should probably look at a non-parametric alternative like the Mann-Whitney U test, which doesn't make the same assumptions about the data's shape.
The most important thing? Be brutally honest about the limitations. Treat any findings from a tiny sample as directional hints, not gospel. Clearly state that your confidence in the result is low because the data is sparse.
At SigOS, we help you move beyond just testing and into true product intelligence. Our AI-driven platform analyzes customer feedback and behavioral data to pinpoint the issues costing you money and the features that will drive real growth, so you can build hypotheses that truly matter. Learn more at sigos.io.
Keep Reading
More insights from our blog


Ready to find your hidden revenue leaks?
Start analyzing your customer feedback and discover insights that drive revenue.
Start Free Trial →