Identifying Risk Factors That Drive Churn and Revenue
Learn a proven methodology for identifying risk factors tied to churn, expansion, and revenue. Actionable steps for SaaS product and growth teams.

More data doesn't automatically produce better risk identification. In SaaS, it often produces a more convincing version of the wrong answer. A churn model can combine product usage, support conversations, billing events, and account notes, yet still overreact to vocal customers, confuse correlated behaviors with causes, and miss accounts that never generate enough activity to appear in the dataset.
The practical problem isn't data volume. It's signal coverage, definition quality, and validation. Epidemiology learned this lesson through longitudinal observation and multivariable analysis. The Framingham Heart Study, which began in 1950, helped establish the modern practice of identifying measurable risk factors before outcomes occurred. A 1961 publication introduced the term “risk factors,” initially phrased as “factors of risk,” according to the National Library of Medicine's historical account. SaaS teams need the same discipline: identify candidate signals, test them together, account for bias, and connect the result to an intervention.
Why Most Risk Factor Identification Fails in SaaS
The popular advice is to collect more customer data and let machine learning find the pattern. That advice skips the hardest part. A model can only detect risk that the organization has recorded consistently, defined clearly, and connected to an outcome.
Support tickets are a familiar example. A customer with many tickets may be at risk, but ticket volume can also indicate a highly engaged account that is actively trying to adopt the product. A quiet customer may look healthy because there are no complaints, when the explanation is that the team has stopped investing time in the product. Usage logs create similar traps. A decline in sessions might signal disengagement, or it might reflect successful workflow consolidation into a smaller number of high-value actions.

Fragmentation creates false confidence
Most SaaS organizations store different parts of the customer story in different systems. Zendesk contains support history, Intercom contains conversations, Linear and Jira contain product work, a warehouse contains event data, and the billing platform records commercial behavior. These systems rarely share a stable account identifier, a common time model, or consistent definitions for terms such as “active user,” “adoption,” “resolved issue,” or “churn.”
That fragmentation creates a dangerous analytical illusion. A team may have thousands of observations in one system but no way to determine whether they represent the same account, the same lifecycle stage, or the same underlying event. Missing data isn't neutral either. Support data is biased toward customers who complain, survey data is biased toward customers who respond, and product data is biased toward actions the instrumentation captures.
Practical rule: Treat every missing field as a question about coverage, not as evidence that nothing happened.
Detection isn't the same as actionability
A statistically detectable signal still might not tell a team what to do. “Low engagement” is too broad for a customer success playbook. “The account stopped inviting new users, abandoned a key workflow, and has unresolved implementation questions” is more useful because it points toward an intervention.
This distinction matters beyond SaaS. The World Health Organization's overview of noncommunicable diseases shows why prioritization matters at scale. WHO estimates that noncommunicable diseases caused at least 43 million deaths in 2021, representing 75% of all non-pandemic-related deaths worldwide, and that 18 million of those deaths occurred before age 70. The same source identifies high blood pressure as the leading metabolic risk factor, attributed to 25% of global NCD deaths. A measurable factor matters because it can focus limited intervention capacity.
SaaS teams need an equivalent prioritization standard. Don't ask only whether a behavior correlates with churn. Ask whether the signal is sufficiently covered, independently informative, timely, and connected to an owner who can act. Most failed programs answer the first question and ignore the rest.
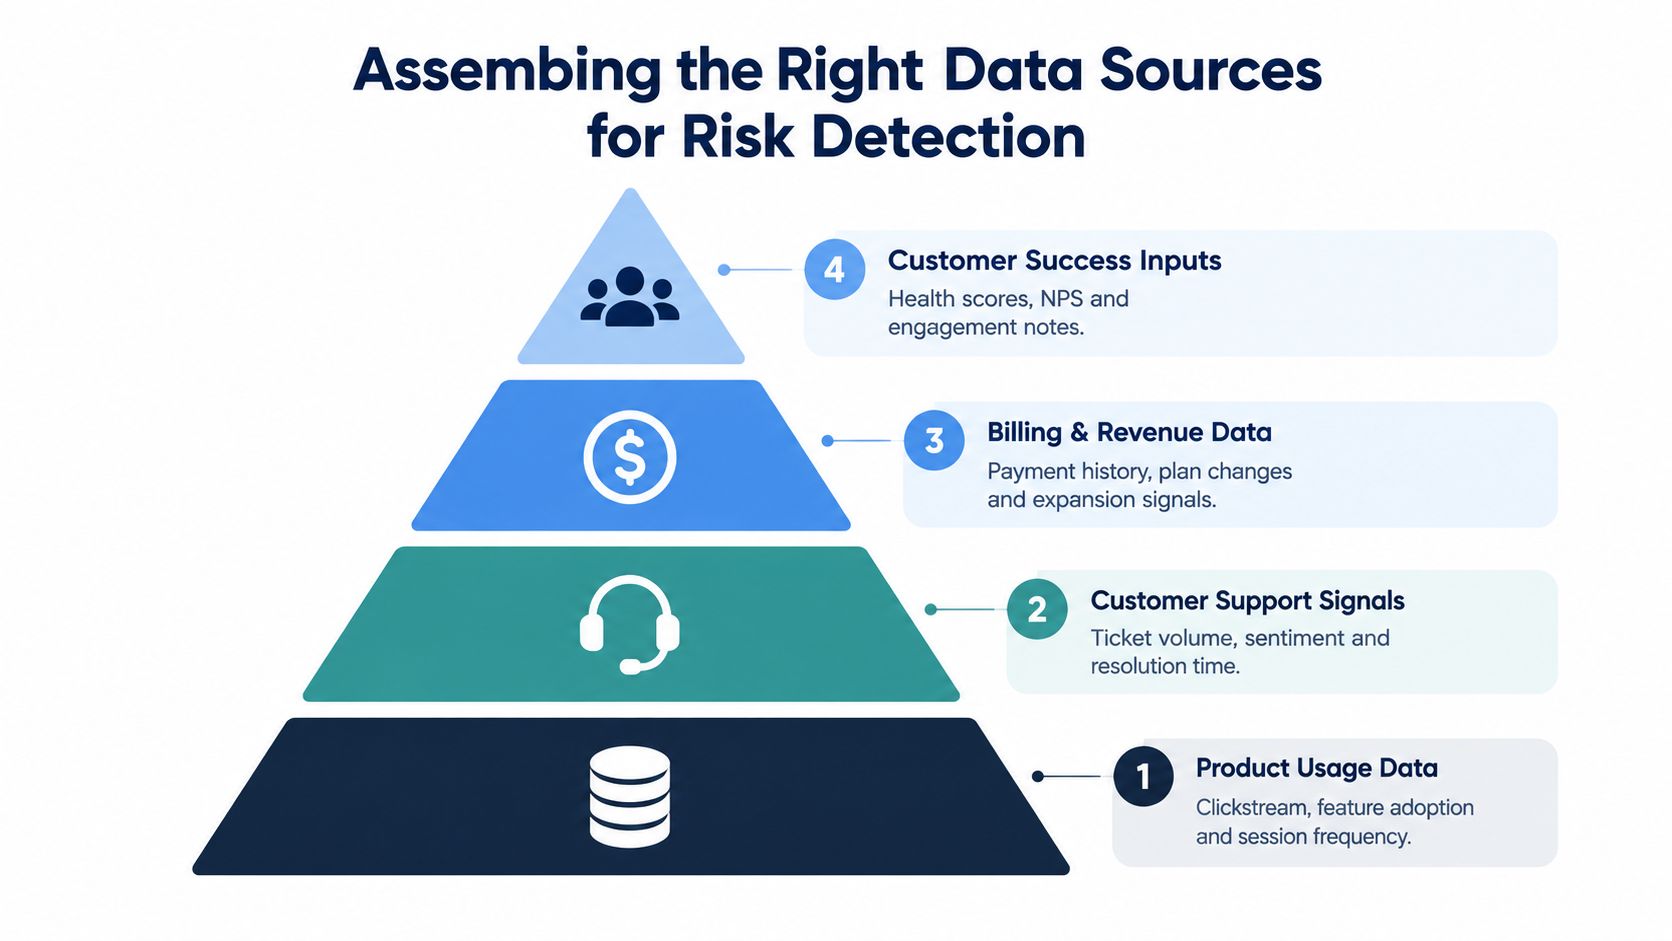
Assembling the Right Data Sources for Risk Detection
Before selecting a model, audit the data foundation as if you were investigating an incident. List every source that describes customer behavior, then document what each system captures, when it was last updated, how records are joined, and which customers are absent.
The core sources usually include product usage, support, billing, customer success, and commercial conversations. None is complete by itself. Product events show behavior but not always intent. Support records reveal friction but overrepresent customers who speak up. Billing shows commercial consequences but often arrives after the underlying risk has developed.
Build a coverage map before building a pipeline
Create a customer-lifecycle matrix with rows for acquisition, onboarding, activation, adoption, renewal, and expansion. Add columns for each source and mark whether the source is present, delayed, partial, or unavailable at that stage.
Use the map to expose blind spots:
- Support coverage: Check whether Zendesk and Intercom records preserve account IDs, conversation timestamps, language, tags, escalation state, and resolution history.
- Product coverage: Confirm that event names, user IDs, workspace IDs, and feature definitions remain stable after releases. A renamed event can look like a sudden behavior change.
- Commercial coverage: Join billing events to plan, contract, renewal, payment status, seats, and expansion history. A customer may reduce usage because procurement has already frozen the account.
- Human context: Normalize notes from customer success, sales calls, NPS surveys, and implementation reviews. Free text can be valuable, but it needs timestamps and a clear account association.
A unified dataset doesn't require every source to be perfect. It requires the team to know where each source is reliable and where it isn't. Multi-source data integration patterns for operational teams are useful when designing the joins and ownership rules behind that dataset.
Standardize definitions and missingness
Define the unit of analysis first. An account-level renewal model shouldn't mix workspace events, individual-user actions, and contract outcomes without a deliberate aggregation strategy. Choose a time window, preserve event order, and prevent future information from leaking into the prediction period.
Then create explicit fields for missingness. “No NPS response” isn't the same as “low NPS,” and “no support ticket” isn't the same as “no support problem.” A missing sales call transcript may reflect a process gap, a customer segment, or a recording limitation.
A global burden review identified weak surveillance, unreliable convenience samples, and major gaps in risk-factor reporting, including the absence of genotype information from nearly half of the studies it examined. The PLOS Neglected Tropical Diseases review offers a useful parallel for SaaS: incomplete coverage can distort prioritization even when the available records look large.
The resulting checklist is simple:
- Coverage: Which customers, lifecycle stages, and behaviors are represented?
- Freshness: How quickly does each source reflect a real-world change?
- Consistency: Do identifiers and definitions survive system changes?
- Bias: Which customers are more likely to generate or answer records?
- Governance: Who owns corrections, access, retention, and definition changes?
Adding another source before answering these questions usually increases complexity faster than insight.
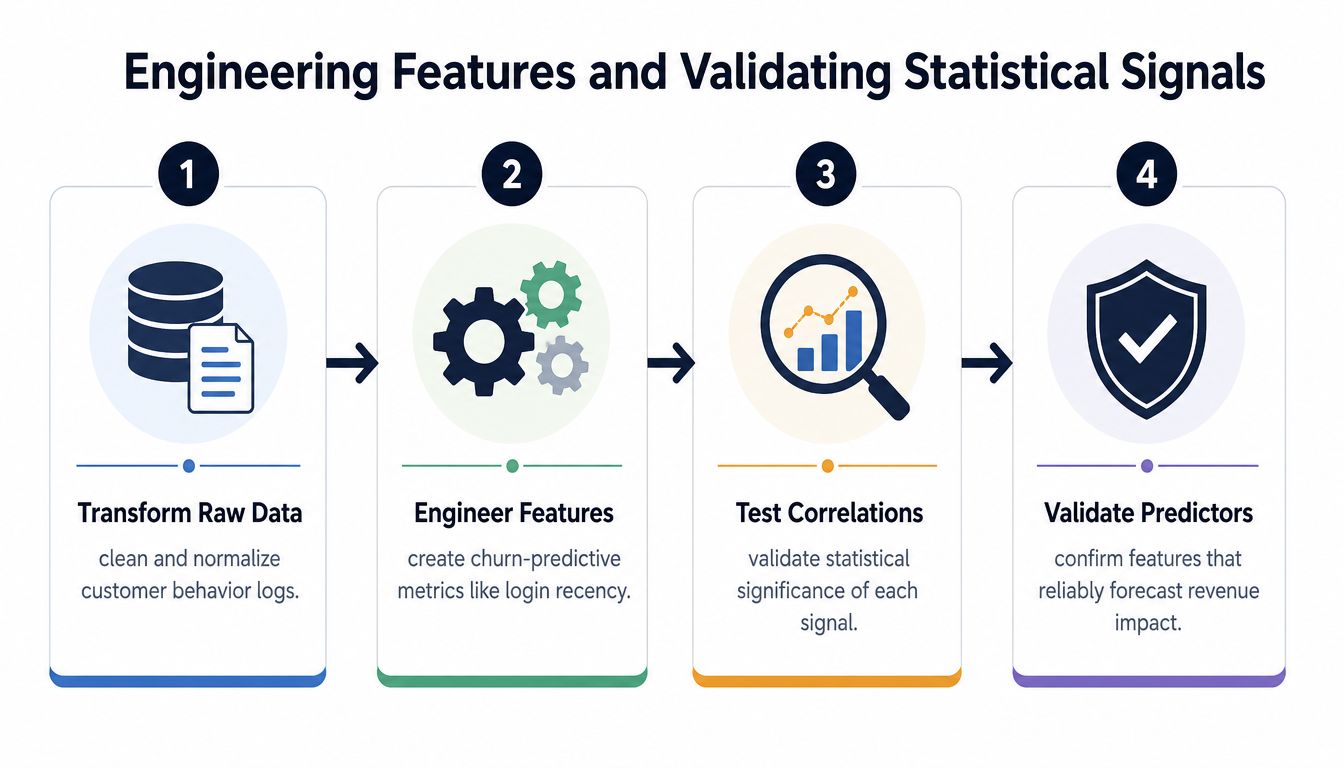
Engineering Features and Validating Statistical Signals
Raw events aren't risk factors. They become useful only after you translate them into behaviorally meaningful measures tied to a defined outcome.
A login count is a weak feature by itself. Engagement velocity, which captures the direction and pace of activity, can be more informative. Feature adoption depth can distinguish a customer who briefly tried a feature from one whose workflow depends on it. Time between key actions can reveal a stalled journey. Support sentiment becomes more useful when measured as a trend across conversations rather than as a single label.
Turn behavior into time-aware features
Start with features that preserve sequence and change. For each account, calculate recency, frequency, breadth, and direction across a consistent observation window. Useful candidates include:
- Engagement velocity: Whether meaningful activity is increasing, stable, or declining.
- Adoption depth: Whether users repeatedly complete a workflow or only visit a feature.
- Action intervals: Whether the time between setup, invitation, activation, and repeat use is widening.
- Support trajectory: Whether sentiment, escalation, unresolved issues, or resolution time is worsening.
- Commercial movement: Whether plan changes, payment events, seat changes, or renewal milestones coincide with behavioral shifts.
Avoid features that encode the outcome. A post-cancellation support tag may predict churn perfectly, but it doesn't help identify risk before cancellation. Likewise, a customer health score can be useful, but only if the team knows how it was constructed and whether it includes information unavailable at prediction time.
Separate association from independent contribution
A rigorous workflow starts with univariate screening. Test each candidate variable against the outcome to understand its crude association, direction, missingness, and sample coverage. This stage is for discovery, not final selection.
Next, enter plausible variables together in a multivariable model. Epidemiology guidance recommends this approach because correlated variables can make an unadjusted estimate look stronger than it is. The public health methodology paper on multivariate risk-factor analysis describes the need to estimate adjusted effects and avoid variables that duplicate or proxy a primary characteristic.
For SaaS, that means testing whether “number of active users” still matters after accounting for account size, plan, lifecycle stage, and meaningful feature usage. It also means questioning whether ticket volume adds information after sentiment, unresolved duration, and implementation stage are included. If two features describe the same underlying condition, retaining both can inflate apparent performance without giving the intervention team another lever.
Use model validation techniques for reliable predictive analysis to structure holdout testing, calibration checks, and leakage review. Validation should examine not only whether the model ranks risky accounts, but whether its risk estimates remain useful across segments, acquisition cohorts, and lifecycle stages.
A final warning concerns causal interpretation. A strong association can reflect selection bias, reverse causality, or a shared exposure. A simulation study of infectious-disease case data concluded that traditional regression methods aren't generally valid for identifying risk factors in every data-generating setting. The lesson transfers directly to SaaS: choose a design that matches how the records were generated, rather than assuming a familiar model makes the conclusion trustworthy.
Building and Benchmarking Predictive Risk Models
A predictive model earns its place by improving a decision, not by producing an impressive score. Define that decision first: which accounts need customer success intervention, which product issue warrants engineering attention, or which expansion opportunity deserves commercial follow-up. Then specify the prediction horizon, outcome, eligible population, and action owner. Without those boundaries, teams often optimize a model for a target nobody can operationalize.
Begin with a transparent baseline. Logistic regression, survival models, or a rules-based score can show whether the available features contain useful information before introducing a more complex approach. Tree-based models can capture nonlinear behavior, but they make leakage checks, calibration, and explanation harder. Complexity is justified only when it improves decisions in realistic validation, not when it raises an offline score on a convenient sample.
Clinical risk modeling offers a useful expectation-setting reference. A postpartum cardiovascular-risk model based on established factors achieved a C-statistic of 0.703, while pregnancy-specific predictors raised it to 0.726, according to the model development and validation study. SaaS teams should not treat those values as targets. The practical lesson is that even well-studied domains can produce moderate discrimination, and additional domain variables may provide incremental rather than dramatic improvement.
Use benchmarks without turning them into promises
| Model Maturity | Typical C-Statistic | Expected Lift from Domain Features | Revalidation Frequency |
|---|---|---|---|
| Baseline rules or simple model | Qualitatively limited | Often unclear until data quality improves | After material definition or workflow changes |
| Validated cross-functional model | Around the moderate range | Incremental lift is plausible | On a scheduled review cycle and after major product changes |
| Mature model with stable coverage | Must be measured on current holdouts | Domain features should earn their place through out-of-sample testing | Continuously monitored, with formal review when drift appears |
These rows are operating guidance, not universal benchmarks. Measure the current population before setting a performance target. A model with moderate discrimination can still protect revenue when the team can act on its highest-ranked accounts. A more accurate model can fail if alerts arrive late, cover only well-instrumented customers, or lack an owner.
Infrastructure choices also affect model reliability. A curated comparison of top data integration tools with AI can help teams assess connectors, transformation, governance, and monitoring. For predictive churn work, the predictive churn modeling guide provides a relevant reference point. The platform matters less than preserving event lineage and making failed or delayed ingestion visible.
Test the data-generating process
Traditional regression is not automatically valid for every SaaS dataset. Sampling design, selection effects, repeated observations, and time-dependent behavior can create a convincing relationship that fails in production. A churn model trained only on customers who submitted tickets may learn support-seeking behavior rather than product risk.
Use temporal splits when the production question concerns future prediction. Check calibration by segment, review false positives with customer-facing teams, and test performance for customers with sparse activity or limited communication coverage. A single aggregate score can hide failure in exactly the accounts the business needs to understand.
Risk factors drift as the product and customer base change. A redesign changes event meaning, pricing changes commercial behavior, and a new onboarding path changes the definition of healthy adoption. Revalidate after major product changes, while monitoring feature distributions, outcome rates, calibration, and intervention results between formal reviews.
Production readiness requires a model that is measurable, explainable enough to act on, monitored for drift, and connected to a response. A leaderboard score alone does not establish readiness.
Operationalizing Risk Factors Into Revenue Protection
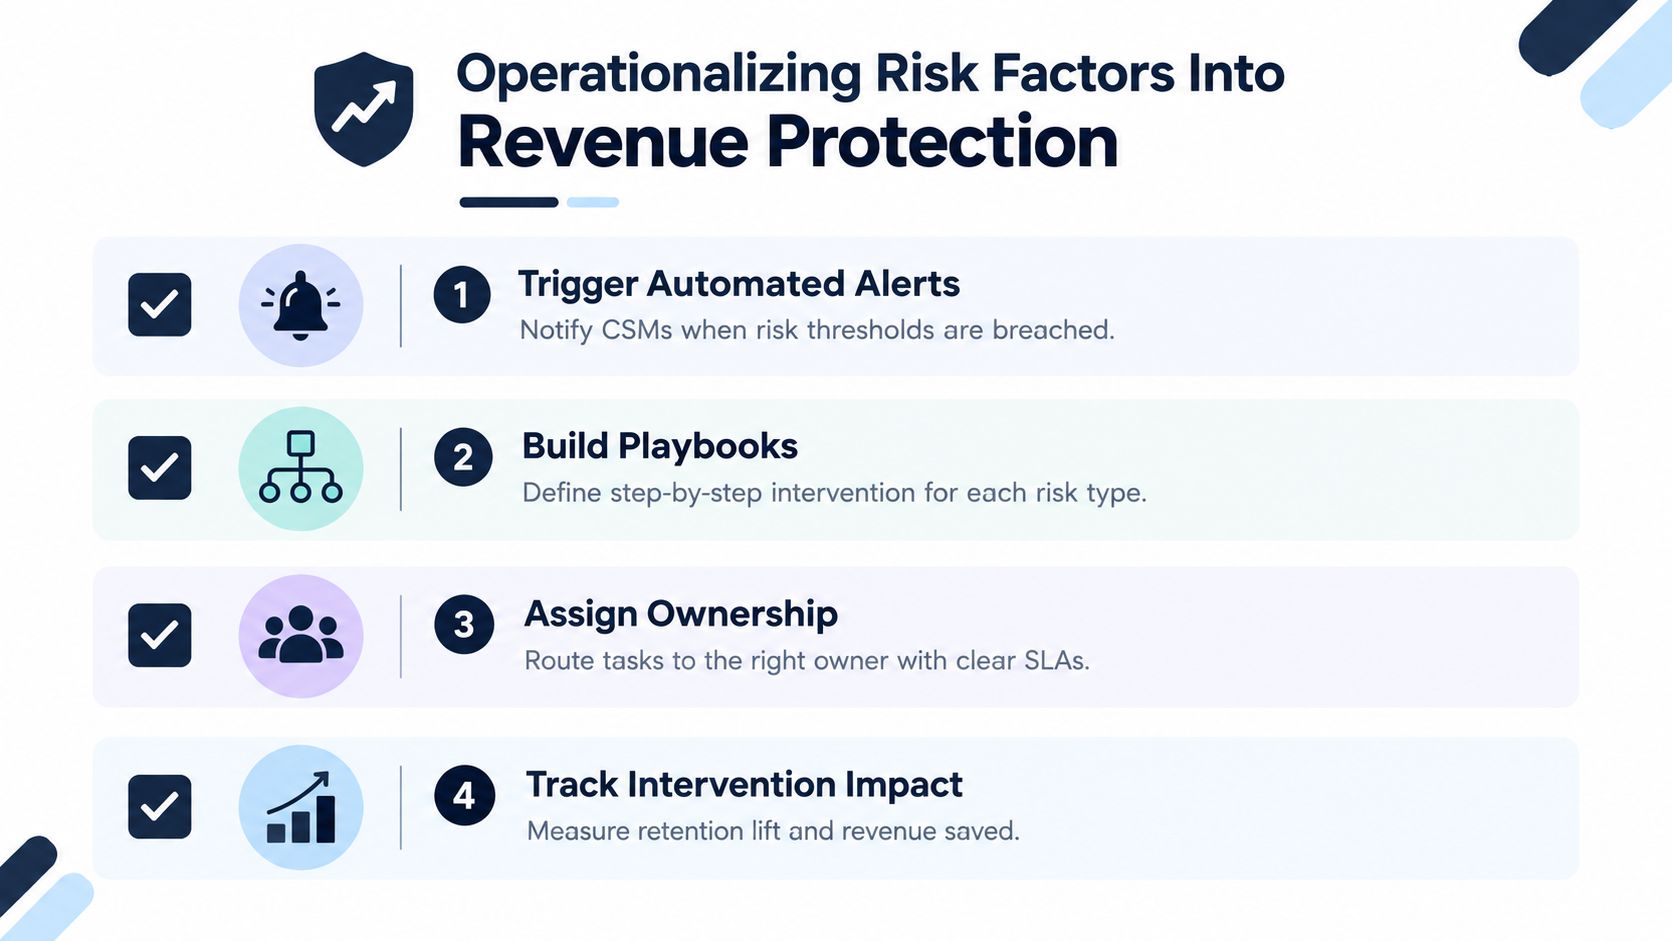
A risk signal has no commercial value until it changes what someone does. The operational design should begin with the alert recipient, not the dashboard. A customer success manager needs an account, a reason, evidence, urgency, and a recommended next step. An engineer needs a reproducible issue, affected accounts, revenue exposure, and a product owner.
Translate signals into intervention rules
Build a playbook for each validated risk pattern. For example, a stalled invitation pattern might trigger an onboarding review, while worsening support sentiment with unresolved implementation questions might route to a senior support owner. The intervention should address the signal, not merely acknowledge the score.
Use thresholds carefully. A single unusual event shouldn't create alert fatigue. Combine persistence, change, account context, and commercial importance. Route high-confidence patterns into systems where work already happens:
- Zendesk and Intercom: Add structured risk context to tickets and conversations.
- Linear and Jira: Create product issues with affected workflows, evidence, and revenue impact.
- GitHub: Attach customer-impact context to engineering work without exposing unnecessary customer data.
- CRM workflows: Assign ownership, due dates, and escalation paths for account interventions.
Prioritize by impact and learn from the response
Risk ranking should combine likelihood, urgency, and business impact. Don't let a high-volume low-value issue outrank a less frequent problem affecting strategically important accounts. Product and revenue teams need a shared explanation of why an issue matters, which customers experience it, and what outcome the intervention should change.
Operational technology can help. SigOS analyzes support tickets, sales calls, and usage data to identify patterns associated with churn, adoption, and revenue impact, then provides risk scores and product-intelligence signals for investigation. It can connect with tools including Zendesk, Intercom, Linear, Jira, and GitHub, making it one option for teams that want to move from fragmented feedback toward routed product and revenue workflows.
Technical debt deserves the same treatment as any other risk factor. When teams evaluate whether a recurring issue comes from an isolated defect or accumulated system complexity, technology leaders' technical debt insights provide useful context for connecting engineering risk with control and operational consequences.
Close the loop by recording whether the intervention happened, who owned it, what changed, and whether the account outcome improved. That feedback should inform threshold tuning and model review. Also teach teams about underrecognized factors. Educational-disparity research found that only 48.1% of respondents recognized low physical activity as a risk factor, while recognition was lower for several dietary factors, including 23.7% for low whole-grain intake and 9.3% for not breastfeeding, according to the review of risk-factor awareness. The SaaS parallel is direct: teams may see a signal in the data but fail to act because they don't understand its practical significance.
Lessons From Teams That Got Risk Identification Right
The strongest teams don't begin with a model. They begin with a disputed business outcome and a small set of competing explanations.
One SaaS team believed renewal risk came from low login frequency. Investigation showed that some low-login accounts had consolidated their work into a reliable core workflow. The more useful signal was a feature adoption gap during onboarding. The team changed the feature definition, separated exploration from repeat use, and gave customer success a workflow-specific intervention rather than a generic engagement alert.
Another team saw a rise in support tickets and assumed those accounts were deteriorating. A joint review of support language, resolution patterns, and expansion history produced a different interpretation. Some accounts were asking advanced configuration questions because they were preparing to broaden use. Ticket volume alone was misleading. The direction and subject of the conversations mattered.
A third team had a model that performed acceptably until a major product change altered the event taxonomy. Activity appeared to collapse because the old events stopped recording, not because customers disengaged. The team rebuilt the feature pipeline, marked the break in the data, and withheld automated alerts until the new baseline was validated.
These scenarios expose recurring failure modes:
- Vocal-customer bias: Teams overfit to customers who submit the most tickets or attend the most calls.
- Stale definitions: A feature name, plan structure, or lifecycle stage changes without a corresponding data-contract update.
- Proxy inflation: Several variables describe the same underlying behavior, making the model look stronger without improving intervention.
- Unowned alerts: A risk score reaches a dashboard, but nobody has authority or time to respond.
- No outcome review: Teams count alerts instead of measuring whether interventions changed retention, adoption, or revenue.
The durable principles are straightforward. Standardize the customer record before adding features. Treat univariate analysis as screening, not proof. Validate variables together, test assumptions against the data-generating process, monitor temporal drift, and teach teams what the signals mean.
Identifying risk factors works when analytics, product, success, support, and revenue teams share definitions and take responsibility for the response. Without that operating model, advanced scoring becomes analytics theater.
SigOS helps SaaS teams connect support tickets, sales calls, and usage data to identify product signals associated with churn, adoption, and revenue impact. Visit SigOS to see how your team can turn fragmented customer evidence into prioritized, actionable risk workflows.
Keep Reading
More insights from our blog

Ready to find your hidden revenue leaks?
Start analyzing your customer feedback and discover insights that drive revenue.
Start Free Trial →