Monitor User Activities: A Guide to Product Intelligence
Learn how to monitor user activities to drive product intelligence. This guide covers data sources, analytics, KPIs for churn/expansion, privacy, and more.
Your team probably has this problem right now. Sales brings urgent requests from a strategic account. Support escalates a noisy bug thread. Product analytics shows feature usage, but not why behavior changed. Customer Success says an account feels risky, yet nobody can prove which product behaviors matter.
That's where teams start making expensive guesses.
To monitor user activities well, you need more than security logs and more than dashboard snapshots. You need a system that connects behavior, feedback, and account context to business outcomes. The point isn't to watch everything. The point is to know which behaviors signal churn risk, which signal expansion, and which issues are costing revenue today.
Beyond Guesswork Why You Need to Monitor User Activities
Most product teams aren't short on data. They're short on trusted evidence.
You can have app analytics in Mixpanel or Amplitude, support data in Zendesk, call notes in Gong, and CRM details in Salesforce, then still end up prioritizing based on the loudest customer or the most recent escalation. That happens because each source tells only part of the story. Usage alone misses sentiment. Tickets alone miss silent frustration. Revenue data alone lags behind behavior.
What changes when you monitor behavior continuously
User activity monitoring used to sit mostly inside security teams. That's changing. The User Activity Monitoring market is projected to reach USD 7.65 billion by 2031, with a 16.23% CAGR, reflecting a shift toward continuous verification of user actions in hybrid environments, according to Mordor Intelligence's user activity monitoring market report.
For product intelligence, that same shift matters for a different reason. Continuous monitoring gives teams an objective timeline of what users do:
- Which workflows stall
- Which features get explored once and abandoned
- Which accounts reduce depth of use before they ever say they're unhappy
- Which users hit a limit, invite teammates, or revisit pricing pages before expansion
That's a better prioritization model than “five customers asked for it.”
Practical rule: If a behavior can't be tied to retention, adoption, support load, or expansion, it probably shouldn't drive roadmap priority on its own.
Why anecdotal prioritization breaks down
Anecdotes distort roadmap decisions in predictable ways. Enterprise customers get overrepresented because they have vocal account teams. New feature launches get overanalyzed because they're fresh. Internal stakeholders overweight the accounts they spoke with this week.
Behavioral monitoring corrects for that. It shows frequency, sequence, and change over time. It also forces a harder question: is this issue broadly painful, or just memorable?
A strong monitoring program doesn't replace product judgment. It sharpens it. The best teams use it to answer practical questions fast:
- Are users failing in onboarding, or just taking a nonlinear path?
- Did usage decline because of poor fit, a broken flow, or a support-heavy incident?
- Which accounts are still active on the surface but gradually reducing meaningful adoption?
- Which requests come from accounts likely to expand if friction gets removed?
Revenue impact is the real use case
Security teams monitor for risk to systems. Product teams should monitor for risk to revenue.
That means moving from passive reporting to behavior-based prioritization. Once you can see changes in feature depth, repeated failure states, support intensity, and account-level engagement together, roadmap work gets less political. You stop reacting to noise and start acting on evidence.
The Strategic Foundation Your Data and Goals
A monitoring program fails early when teams start with tooling instead of intent. “Collect everything” sounds safe, but it creates a swamp of half-defined events, duplicate identities, and dashboards nobody trusts.
Start with the business question. Then define the minimum data required to answer it.

Pick goals that change decisions
Good goals are specific enough to force trade-offs. “Improve product understanding” is too vague. Better examples:
- Reduce churn risk for accounts showing declining feature depth
- Find expansion opportunities when usage approaches plan limits or spreads across teams
- Improve onboarding by identifying steps where new users stall or ask for help
- Prioritize bug fixes based on which behaviors correlate with account risk or blocked adoption
Those goals determine what you monitor. If churn is the focus, raw page views won't help much by themselves. You need behavior that reflects sustained value, friction, and support burden.
Build your source map before instrumenting
At the event level, strong UAM captures the basics: who, where, when, and what for each interaction. That structure is foundational for alerting and forensic analysis, as described in NordLayer's overview of user activity monitoring.
For product intelligence, I'd expand that into a source map. Don't think in terms of one analytics tool. Think in terms of evidence categories.
| Data Source | Example Data Points | Primary Use Case |
|---|---|---|
| Product usage events | login, feature used, workflow completed, error encountered | Adoption, churn signals, expansion patterns |
| Backend and API logs | job runs, API calls, sync failures, permission errors | Reliability analysis, hidden friction, failed automation |
| Support systems | ticket topics, sentiment, escalation tags, reopen patterns | Friction intensity, unresolved pain, account risk |
| Customer conversations | sales call themes, onboarding notes, renewal concerns | Context for intent, buying signals, objection patterns |
| CRM and billing | account tier, renewal date, seat count, contract status | Revenue weighting and prioritization |
| Experiment and release data | rollout cohorts, feature flags, release dates | Causal analysis of behavior changes |
Collect less, but collect with purpose
A practical data plan usually needs three layers:
- Behavioral events from product and backend systems
- Qualitative signals from support and customer-facing teams
- Business context from CRM, billing, and account metadata
That mix matters because behavior without context is easy to misread. A drop in usage can mean dissatisfaction. It can also mean task completion became more efficient. A spike in tickets can signal product pain, or it can signal successful expansion into a new team with more questions.
Monitor user activities with a clear decision attached to each source. If you can't explain who will act on the data, why you need it, and what decision it influences, don't collect it yet.
Define ownership early
This part gets missed. Someone has to own event definitions, identity resolution, taxonomy changes, and data quality review. In most SaaS companies, that's shared across product ops, data, and engineering. Without explicit ownership, your monitoring layer fragments fast.
The healthiest setup is boring. A change log for event schema. A naming review before release. A clear policy for deprecating old events. A short list of business questions everyone agrees matter.
That discipline is what keeps monitoring useful six months later.
Technical Implementation Tracking and Instrumentation Patterns
Instrumentation is where strategy usually collides with reality.
A team agrees on churn signals, opens a sprint, adds tracking in three different ways, and ends up with Clicked Button, button_click, and ctaTapped all describing roughly the same action. From there, confidence drops. Analysts stop trusting definitions. PMs export CSVs to “double check.” Customer Success stops using the dashboards entirely.
Client-side versus server-side tracking
Both models matter. Neither is enough alone.
Client-side tracking with tools like Segment, Amplitude SDKs, Mixpanel, or PostHog is useful for interface-level behavior. You can capture page views, clicks, modal opens, form submissions, and local interaction timing with high detail. It's fast for product teams and often easier to ship.
But client-side tracking has weaknesses:
- It can be blocked by browser restrictions or privacy tooling
- It can drift if frontend logic changes and nobody updates event definitions
- It often lacks business finality, such as whether a workflow completed on the backend
Server-side tracking gives you stronger truth for account changes, successful transactions, permission updates, imports, exports, and workflow completion. It's harder to spoof and more resilient when browsers behave unpredictably.
The practical pattern is simple. Use client-side events for experience detail. Use server-side events for business-critical state changes. If you're designing your taxonomy from scratch, this guide to track app usage is a useful reference for deciding which behaviors belong in each layer.
Event naming needs a schema, not creativity
Messy naming is one of the fastest ways to ruin a monitoring program.
Use a convention that reflects actor + object + action or domain + action, then keep it consistent. Examples:
workspace_createdreport_exportedintegration_connectedinvoice_download_failedseat_limit_reached
Bad names are vague, overloaded, or UI-specific. clicked_save_button is usually too narrow. Buttons change. The user intent often doesn't.
A strong event should answer four things cleanly:
| Question | Example |
|---|---|
| What happened | dashboard_shared |
| Who did it | user ID, account ID, role |
| Where did it happen | app area, device type, workspace |
| What context matters | plan tier, feature flag, workflow state |
Instrument for analysis, not just collection
Teams often track too many low-value interactions and too few meaningful transitions.
Focus first on moments that represent progress, friction, or intent:
- Progress markers like project created, integration activated, first report generated
- Friction markers like repeated validation errors, failed imports, abandoned setup flows
- Intent markers like admin invites, settings exploration, limit encounters, pricing page revisits
Clean data doesn't happen because you chose a good analytics vendor. It happens because engineering, product, and data teams agree on what an event means before it ships.
Don't let identity break your model
The hardest implementation issue usually isn't event volume. It's identity stitching.
Users sign in on different devices. Accounts merge. Trial users become paid admins. Email addresses change. If your identity model is weak, your churn analysis becomes unreliable because behavior fragments across multiple records.
At minimum, define how you'll reconcile:
- anonymous visitor to known user
- user to account
- user role changes over time
- parent account and sub-workspace relationships
Without that layer, you're not monitoring user activities. You're collecting disconnected clicks.
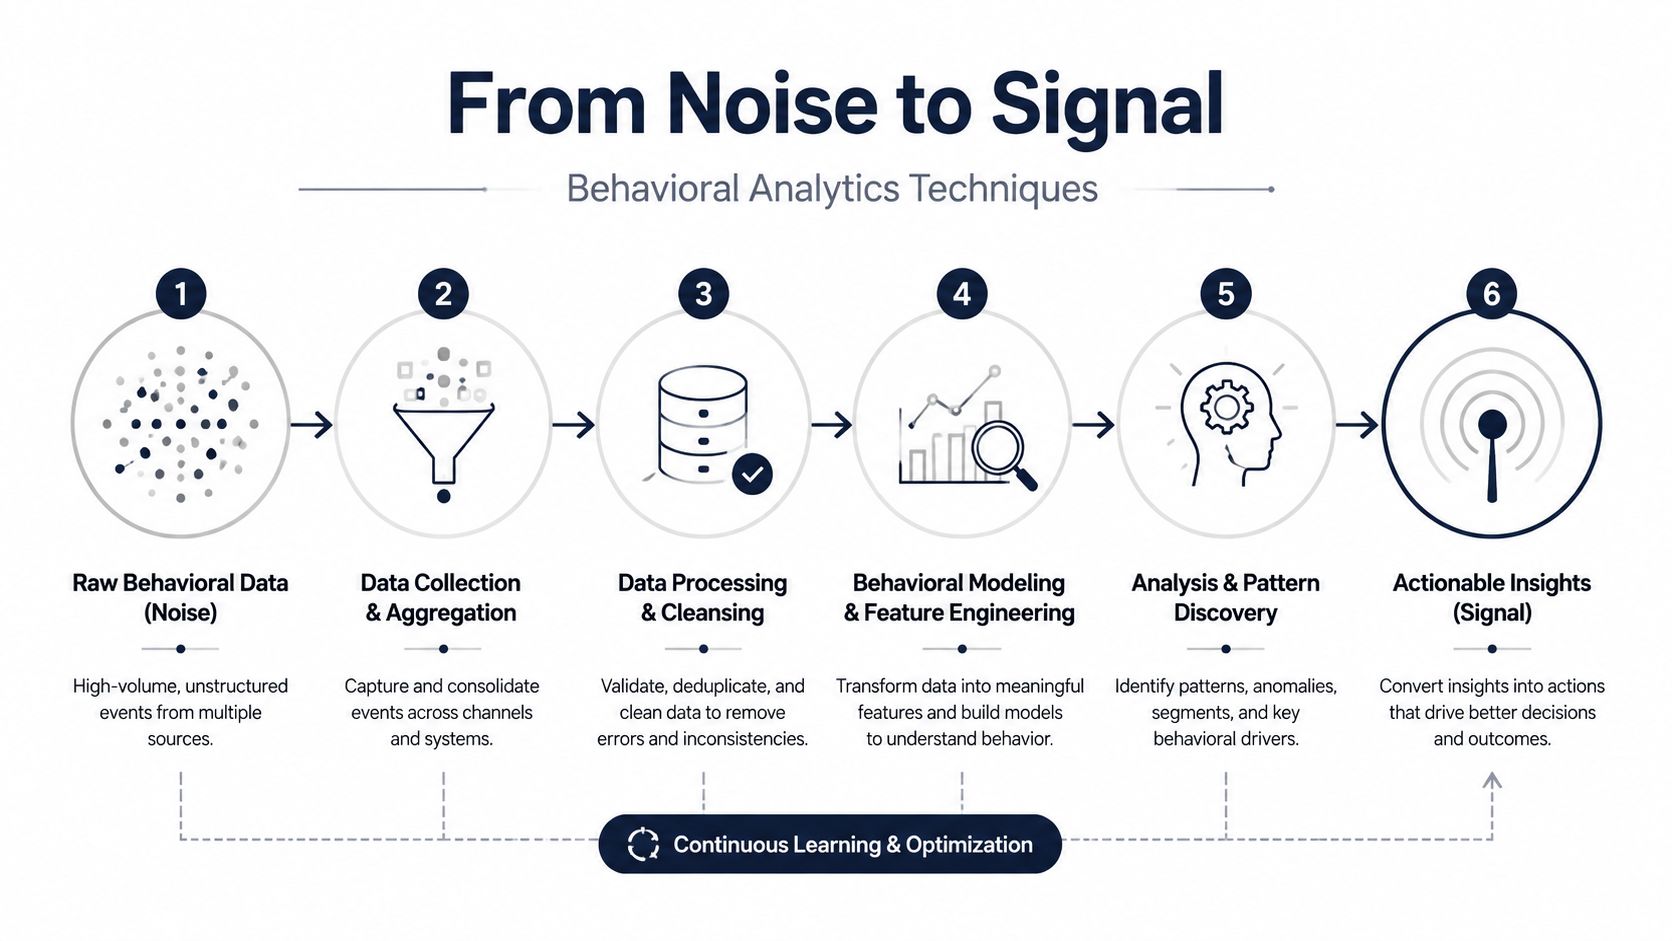
From Noise to Signal Behavioral Analytics Techniques
Raw event streams don't produce insight on their own. They produce confusion faster and at larger scale.
Building a dashboard is within the reach of many groups. Fewer teams can separate incidental activity from behavior that predicts retention, support burden, or expansion. That gap is usually a methodology problem, not a tooling problem.
Start with data hygiene before modeling
Many analytics efforts fail in these instances. Seventy percent of analytics projects fail due to poor data quality, while teams that systematically process data, mine patterns with clustering, and tie insights to ROI can achieve 64% higher adoption and reduce churn by up to 25%, according to Inzata's analysis of BI project failure and success patterns.
In practice, that means cleaning your inputs before you chase advanced models.
Focus on:
- Schema validation so event properties stay usable across releases
- Deduplication for retried events and duplicate webhook deliveries
- Timestamp normalization so sequence analysis isn't broken by timezone drift
- Session logic that groups actions into meaningful windows instead of treating every event as isolated
If you also work with exported research, customer transcripts, or implementation documents, an AI tool for professional data extraction can help pull structured evidence from messy PDFs before those inputs enter your analysis layer.
Behavioral methods that actually help
There's a difference between descriptive reporting and behavioral analytics.
Descriptive reporting tells you what happened. Behavioral analytics helps explain how users moved through the product and which patterns repeat before an outcome. A few methods are consistently useful:
Session and sequence analysis
Define sessions in a way that reflects product reality. For a collaboration tool, a session might be short and frequent. For a reporting platform, sessions may be less frequent but longer and task-driven.
Once sessions are defined, look at sequences:
- setup started → integration connected → report generated
- pricing viewed → admin invited → seat limit reached
- import attempted → import failed → support ticket opened
These chains tell you much more than isolated event counts.
Behavioral clustering
Unsupervised clustering is useful when your personas aren't obvious. Methods such as DBSCAN can group users by actual behavior patterns instead of title, segment, or declared use case.
That often surfaces important cohorts:
- accounts with broad logins but shallow feature depth
- users who depend heavily on one workflow and churn when it breaks
- admins who behave like evaluators rather than long-term operators
If you want examples of how teams apply these methods in product work, this overview of use behavior analytics is worth reading.
The strongest signals are often small behavioral shifts that repeat across accounts before anyone files a cancellation notice.
Add qualitative evidence to avoid false certainty
A model can tell you that a cohort reduced feature exploration. It can't always tell you why. That's where support and customer conversation data matter.
If multiple accounts show the same sequence, such as repeated workflow failure followed by a support escalation and then reduced usage depth, you're no longer looking at an isolated issue. You're looking at a pattern worth prioritizing.
This is also where a tool such as SigOS can fit. It combines support tickets, chats, calls, and usage metrics to surface patterns tied to churn, expansion, and revenue impact. That kind of joined analysis is often what turns a suspicious signal into an actionable one.
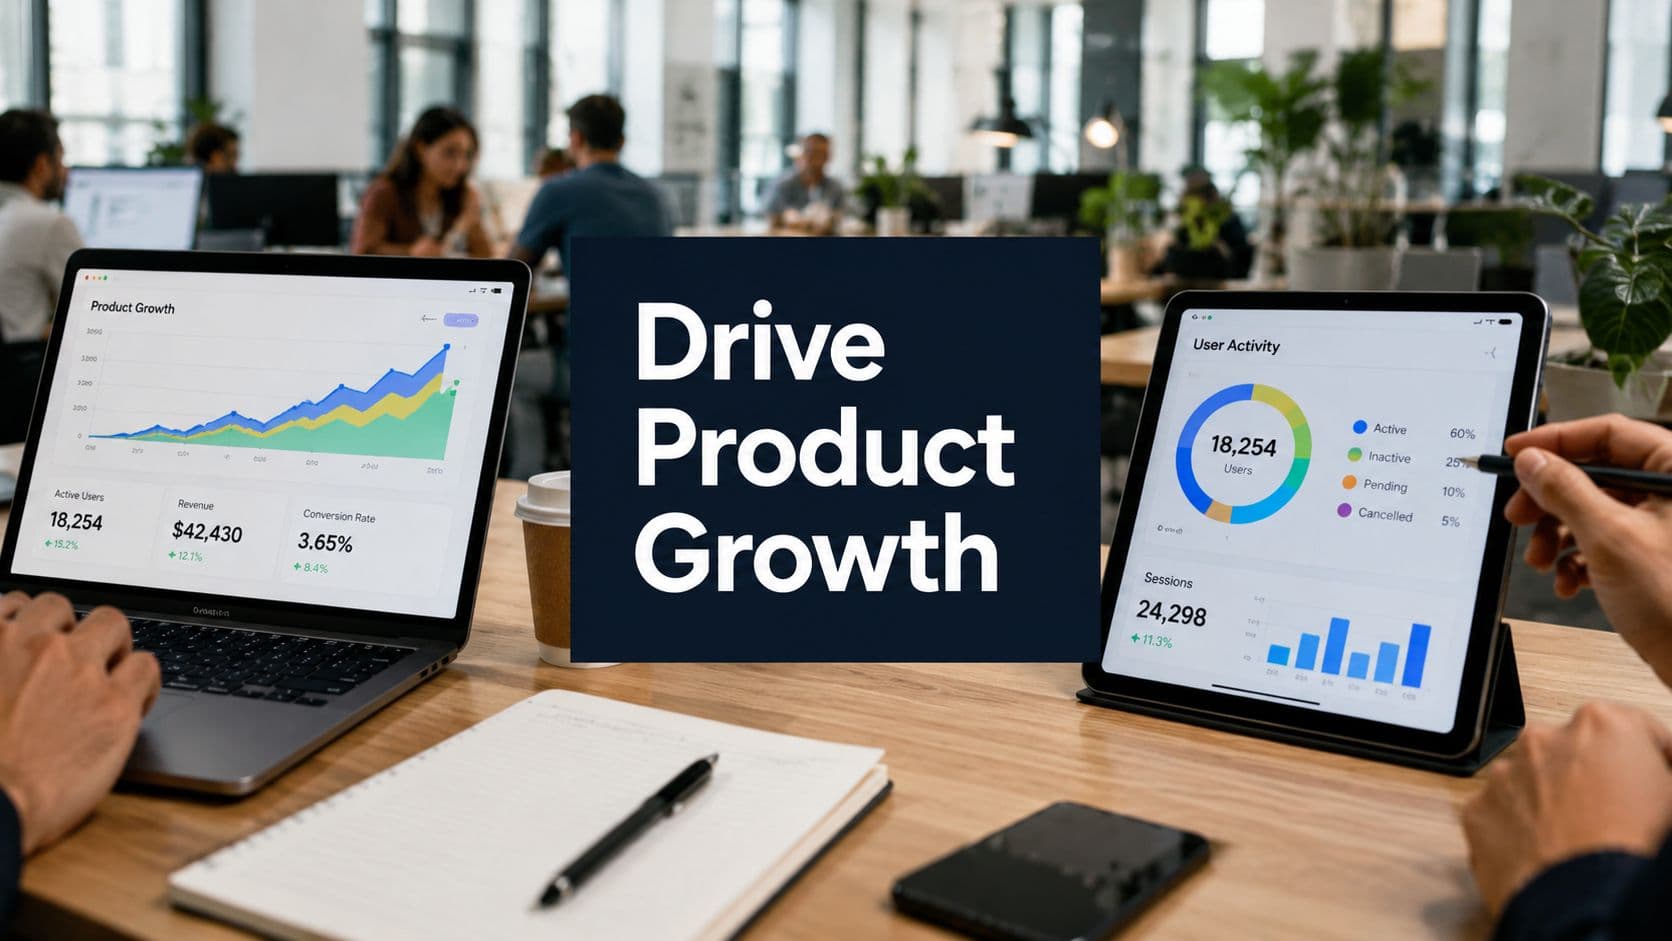
Connecting Behavior to Business KPIs for Churn and Expansion
Most product dashboards are crowded with activity metrics that don't change anyone's behavior. Daily active users, raw logins, and top screens can be useful context, but they rarely tell a revenue team what to do next.
The useful KPI is the one that helps someone intervene before the outcome is final.
Churn signals should be leading, not historical
Basic monitoring tracks access. Advanced monitoring catches micro-behaviors that precede churn. Forrester data from 2025 says 65% of SaaS companies underutilize this for growth, correlating to 22% higher churn, as cited in this CDSE resource on insider threat indicators in UAM.
For product and growth teams, that means building KPIs from behavior combinations, not single metrics.
A practical health score usually blends several inputs:
- product depth, such as repeated use of core workflows
- consistency, such as whether usage is spreading or shrinking across a team
- friction, such as errors, failed jobs, or unresolved support threads
- intent signals, such as admin engagement or configuration changes
A healthy account doesn't just log in. It completes value-bearing actions consistently.
Expansion indicators need account context
Expansion behavior looks different from activation behavior. New users explore. Expansion-ready accounts show signs of saturation or broader operational dependence.
Good expansion KPIs often include:
- admins inviting more users
- repeated use of advanced workflows
- account activity near plan boundaries
- interest in billing, settings, security, or integration areas
- customer conversations that align with deeper usage
A pricing page visit alone is weak. A pricing page visit paired with team invites and heavy use of premium workflows is more meaningful.
Don't ask whether usage is up or down. Ask whether the behaviors tied to durable value are getting stronger or weaker inside the accounts that matter most.
Weight KPIs by revenue consequence
Not every churn signal deserves the same response. A temporary drop from a small self-serve account and the same drop from a strategic renewal account shouldn't carry equal urgency.
That's why behavioral KPIs need account-level weighting:
- contract value
- renewal timing
- strategic fit
- product tier
- support burden
- open opportunity status
When teams want to formalize this, I usually recommend a simple model first: behavior score, friction score, and revenue weight. Then refine. If you need a practical framework for that model design, this predictive churn model guide is a helpful starting point.
The key is restraint. Don't build a giant score nobody can explain. Build a score your CS lead, PM, and revenue ops manager can all challenge and understand.
Operationalizing Insights Alerting and Workflow Integration
A monitoring program becomes valuable when it changes daily behavior across teams.
I've seen this break in the same place repeatedly. The analytics team builds a thoughtful dashboard. Product reviews it once a week. Customer Success asks for a CSV before renewals. Engineering only hears about issues after an executive escalation. The data exists, but no workflow is attached to it.

Put alerts where teams already work
Good alerting is selective. If every drop in usage triggers a Slack message, people stop reading them. Alerts need account context, behavioral context, and a clear owner.
A few examples work well:
- Customer Success alert when a high-value account shows declining use of a core workflow after a support escalation
- Product alert when a newly released feature generates repeated failure behavior across multiple accounts
- Sales alert when an account shows stronger admin engagement, team invites, and plan-limit pressure
- Engineering alert when a backend failure pattern maps to blocked adoption in active accounts
Continuous monitoring discipline is essential. Teams that want a broader operating model often benefit from the Pratt Solutions continuous monitoring guide, especially for thinking through how alerts become operational practice instead of passive reporting.
Build response playbooks, not just notifications
An alert without a next step is noise.
For each major alert type, define:
- Who owns first response
- What threshold makes it actionable
- Which system gets updated
- What follow-up closes the loop
Example playbooks are usually straightforward:
- churn-risk alert creates a task for the account owner with the behavior summary
- repeated workflow failure opens a Jira or Linear issue with affected accounts attached
- expansion signal pushes context into Salesforce for the AE or AM
- onboarding friction creates a review item for product ops or lifecycle marketing
That's how you monitor user activities in a way that influences retention and growth.
Here's a useful walkthrough of how teams think about this operational layer:
Keep humans in the loop
Automation helps with speed. It doesn't replace judgment.
A health score dip might come from a planned seasonal slowdown. A surge in support tickets might reflect successful rollout into a new business unit. Someone still has to review the signal in context.
The strongest operating model combines automation with review rituals:
- weekly product-risk review
- CS inspection for at-risk renewals
- revenue meeting for expansion-qualified behavior
- monthly audit of alert quality and false positives
That's where monitoring becomes a management system, not just a data stream.
Building Trust Through Ethical Monitoring and Privacy
A lot of teams still act like privacy is the tax you pay for better insight. That's the wrong frame.
If your monitoring program makes users, employees, or customers feel watched without clarity, the program is already damaged. Trust isn't a soft concern. It affects adoption, consent, internal alignment, and how far you can safely scale your data practices.

Privacy-first design is part of product quality
The guidance gap is real. Forty percent of SaaS firms faced privacy fines in 2025, up 25% year over year, according to Logz.io's discussion of user activity monitoring and privacy concerns.
For product intelligence teams, that should change how monitoring gets designed:
- Collect purposefully so teams don't store raw data they never use
- Mask or redact sensitive inputs before analysis whenever possible
- Limit access to behavioral data with role-based controls
- Explain monitoring clearly in user-facing and internal policies
- Separate product intelligence from surveillance habits that don't serve customer value
If your team needs implementation ideas for redaction and anonymization, these effective data masking strategies for developers are a practical place to start.
Transparency beats vague reassurance
Users don't trust broad promises. They trust specifics.
Tell them what you collect, why you collect it, how long you retain it, and how it improves their experience. If you analyze behavior to detect churn risk, say that in plain language. If you avoid retaining raw personal content for model training, state it clearly. If certain actions are excluded or masked, explain that too.
Ethical monitoring isn't the opposite of useful monitoring. It's what makes a monitoring program durable.
The best programs monitor less than they could
This is the discipline many teams resist. Modern tools can collect far more than most companies should use. More visibility doesn't automatically create more value.
Responsible programs focus on behavioral patterns that support clear outcomes:
- better onboarding
- faster issue resolution
- earlier churn detection
- more relevant product decisions
- stronger compliance posture
That restraint becomes a competitive advantage. Customers and internal teams are more likely to trust a system built around purpose, minimization, and clarity than one built around exhaustive capture.
If your team wants to connect support signals, usage behavior, and revenue impact in one workflow, SigOS is built for that operating model. It helps product, growth, and customer teams identify patterns tied to churn and expansion, then route those insights into day-to-day tools so prioritization is based on evidence instead of noise.
Keep Reading
More insights from our blog


Ready to find your hidden revenue leaks?
Start analyzing your customer feedback and discover insights that drive revenue.
Start Free Trial →