A Guide to Use Behavior Analytics and Reduce Churn
Discover how to use behavior analytics to prioritize product decisions, reduce churn, and drive revenue. A practical guide for product and growth teams.

If you want to use behavior analytics to its full potential, you have to stop relying on gut feelings. The real goal is to turn raw user data into a clear, revenue-driven product roadmap. It's about connecting what people do inside your product to real business outcomes, like churn or expansion, so that every decision you make is backed by hard evidence.
Stop Guessing: Let Behavior Analytics Guide Your Roadmap

Does your product roadmap feel like a reaction to whoever shouts the loudest? It's a common trap. Teams often end up prioritizing features or bug fixes based on a single, high-profile customer complaint or anecdotal feedback. While that input has its place, this approach often misses the forest for the trees, building a product that caters to a vocal few instead of the silent majority.
The real challenge is translating all that subjective feedback—from support tickets, sales calls, and customer emails—into an objective, data-backed strategy. This is where you can use behavior analytics to build a serious competitive advantage. Instead of guessing, you can start putting real numbers behind the impact of user actions.
From To-Do List to Strategic Asset
A modern product strategy is built on statistical validation, not just intuition. You need to connect the dots between what users say they want and what they actually do inside your app. Making this shift is fundamental for sustainable growth.
So, where do you start? Begin by asking the right questions:
- What are our customer health signals? Which specific in-app actions correlate with long-term retention and customer happiness?
- Where are the friction points? At what step in a key workflow are users getting stuck or dropping off entirely?
- What’s the true revenue impact? How much is that one nagging bug or missing feature actually costing the business in lost deals or churned customers?
Answering these questions turns your backlog from a simple to-do list into a powerful strategic asset. Every task can be prioritized by its calculated impact on the bottom line, not just its perceived importance. You can dig deeper into this topic by reading our guide on what is behavioral analytics.
The global behavior analytics market is projected to grow from around USD 5.5 billion in 2024 to USD 13.4 billion by 2029. This isn't just a trend; it's a fundamental shift. Behavior analytics has moved from a niche tool to a core component of the modern product stack.
Creating Your Unified Data Foundation

Before you can pull any meaningful insights, you need a solid foundation. This means building a single, reliable source of truth that pulls together every single customer touchpoint—from in-app clicks to support chats. It's about moving past isolated metrics and seeing the complete customer story.
Think about it: a dip in product usage might just look like a user losing interest. But what if you could see that same user filed a support ticket yesterday complaining about a bug? Suddenly, you have context. You have a story. That's the power of a unified data view.
Define a Meaningful Event Taxonomy
First things first, you need to create a rock-solid event taxonomy. This is just a fancy way of saying you need a standardized naming system for all the user actions you track. Forget vanity metrics like page views; we're talking about actions that signal real intent and show users are getting value.
A clean, well-thought-out taxonomy lets you ask much smarter questions. For instance, instead of just tracking "clicks," you'd track specific, meaningful events like:
**Project_Created**: This shows a user is diving into your core feature set.**Integration_Connected_Success**: A huge milestone that often points to better long-term retention.**Report_Exported**: This tells you the user is getting tangible, real-world value out of your platform.
This clarity is everything. It cuts through the noise and keeps your team focused on the behaviors that actually move the needle. As you build this out, remember to prioritize responsible data practices, such as ensuring GDPR Compliant AI Integration.
Merge Quantitative and Qualitative Data
The real magic happens when you bring together what users do (the quantitative data) with what they say (the qualitative feedback). This isn't optional—it's essential for getting a complete picture. You have to connect the dots between structured usage data from your product and the unstructured feedback coming from support, sales calls, and surveys.
True visibility comes from connecting the dots. A user who repeatedly triggers a specific error event in your analytics and then submits a frustrated support ticket in Zendesk presents a clear, high-priority problem to solve.
The table below breaks down the essential data sources you'll want to bring together. Each one offers a unique piece of the puzzle.
Essential Data Sources for Behavioral Analysis
A breakdown of key data streams, the insights they provide, and common integration points for a unified view.
| Data Source | Type of Insight | Example Tools & Integrations |
|---|---|---|
| Product Analytics | User engagement, feature adoption, friction points | Mixpanel, Amplitude, Segment |
| Support Tickets | User frustration, bugs, feature requests | Zendesk, Intercom, Help Scout |
| CRM Data | Account health, contract value, user roles | Salesforce, HubSpot |
| Sales & CS Calls | Customer goals, objections, sentiment | Gong, Chorus.ai |
| Surveys & Feedback | NPS, CSAT, direct user feedback | Typeform, SurveyMonkey, Delighted |
By weaving these disparate sources into a single narrative, you create a far richer understanding of the customer experience.
This integrated approach is quickly becoming the norm. Industry research shows that over 25–30% of behavior analytics projects are now tied to broader customer experience initiatives, not just security. This shift proves that companies are justifying these investments by showing real, measurable improvements in retention and expansion—all driven by a deeper understanding of user behavior. Read more on this research about market trends.
With this foundation in place, you're ready to start spotting the subtle patterns that come before a customer churns or expands. You can finally shift from being reactive to proactively driving growth.
Finding the Signals That Actually Predict Churn and Growth
Now that your data streams are flowing into one place, it's time for the fun part: sifting through all that noise to find the signals that really matter. This is where you graduate from simply collecting data to generating powerful insights. The whole point is to pinpoint specific, repeatable user actions that are tightly linked to a customer either churning or expanding their account.
This isn't about guesswork. It's about creating behavioral cohorts—groups of users segmented by what they do, not just who they are. So, instead of looking at a generic segment like "users from the US," you start analyzing much more meaningful groups, like "users who connected an integration in their first week" or "users who hit that frustrating API error more than three times."
Building Cohorts Based on Action
To get real value from your analytics, your cohorts need to be built around meaningful interactions. Forget vanity metrics. The goal is to create segments based on actions that show a user is either getting immense value or hitting a serious wall.
Here are a few examples of powerful cohorts I’ve seen work wonders:
- Power Users of a Key Feature: Grouping everyone who uses a core feature multiple times a week helps you reverse-engineer the habits of your best customers.
- Users Hitting a Specific Bug: Isolating users who keep triggering a known error gives you a hard number on that bug's real-world business impact.
- Onboarding Drop-offs: Segmenting users who start a critical setup flow but never finish shines a spotlight on friction in your new user experience.
Creating these focused, action-based groups allows for much sharper analysis. For a deeper dive into this method, we’ve put together a guide on cohort retention analysis that shows you exactly how to track these groups over time. This approach is worlds more effective than trying to analyze your entire user base as one giant, faceless blob.
Running Correlation Analysis to Find the Predictors
With your cohorts defined, the next step is to see how their behavior correlates with crucial business outcomes like churn, renewal, or expansion. This is how you finally connect the dots between what users do and what they're worth to your business. You're essentially asking one critical question: "Are people in this cohort more or less likely to churn than the average user?"
For example, you might run the numbers and discover that customers who invite at least two teammates in their first 30 days have a staggering 90% renewal rate. That’s a massive growth signal. On the flip side, you could find that users who file more than one support ticket about a specific billing issue are four times more likely to churn in the next quarter. That’s a huge red flag.
The real magic happens when you start combining different data types. A drop-off in product usage is one thing. But when you correlate that with negative comments in a recent support ticket? Now you have a clear, actionable signal of an account at risk.
Modern AI-powered tools can automate a lot of this discovery, bringing statistically significant correlations to the surface that a human analyst might easily miss. To really understand the context behind customer feedback, especially from qualitative sources, you can layer in techniques like sentiment analysis for social media to get a better read on the emotion.
By systematically identifying these leading indicators, you stop looking in the rearview mirror. Your analytics become a predictive engine that helps your teams step in before it's too late.
How to Operationalize Insights Across Your Teams
You've done the hard work and found a behavioral signal that actually predicts churn. That's a huge win. But if that insight just sits on a dashboard somewhere, it’s worthless. The real magic happens when you close the loop between data and action, turning what you've learned into automated workflows that your teams can actually use.
Let's be honest: any data that requires someone to manually check a report every single day is doomed to be ignored. Instead, the signals you've discovered should become active triggers. This means plugging your analytics platform directly into the tools your customer success, product, and engineering teams are already living in. When you get this right, your analytics tool stops being a passive reporting system and becomes an active, intelligent part of your company's nervous system.
This whole process is about starting broad and getting razor-sharp. You begin with large groups of users and methodically drill down to find the specific actions that truly predict their future behavior.
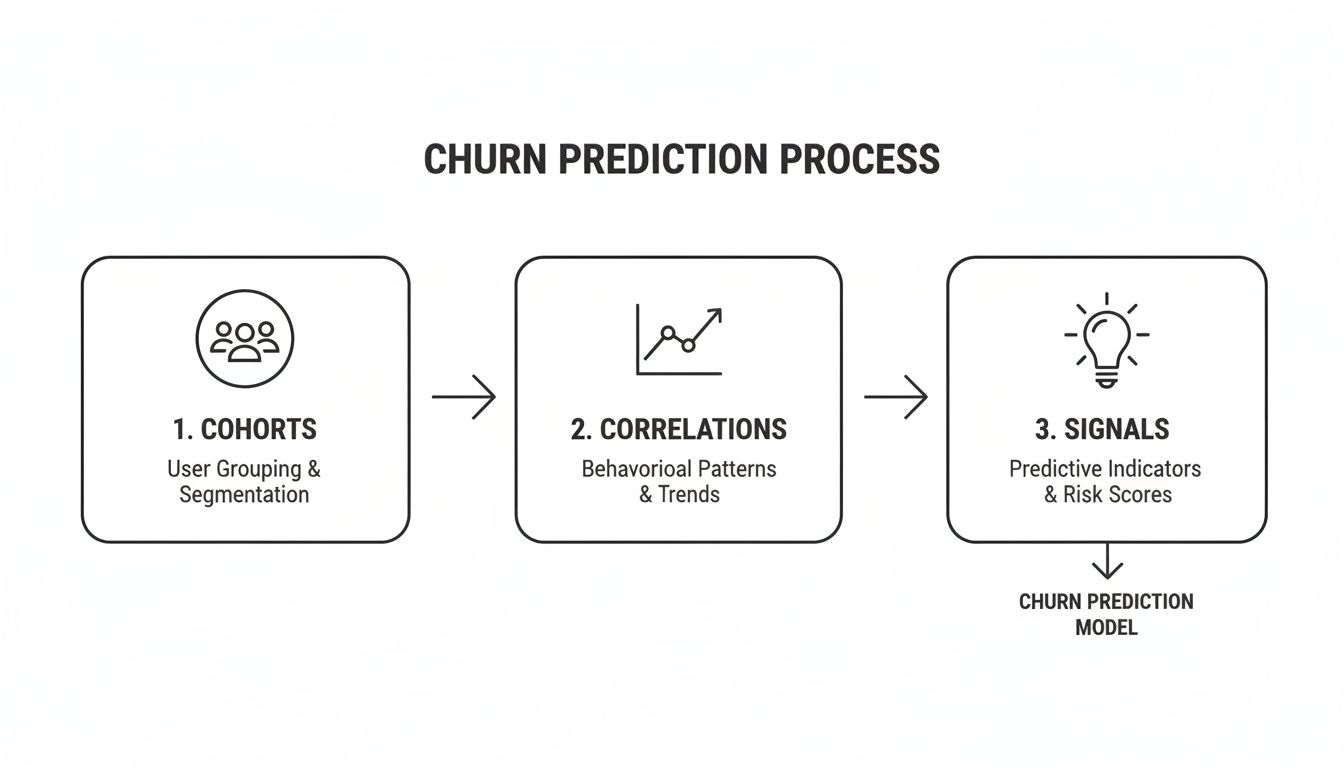
This workflow shows exactly how you move from segmenting users into behavioral cohorts to running the correlation analysis that finally surfaces those high-value signals for churn or expansion.
Create Automated Cross-Functional Workflows
The goal here is to turn those predictive signals into proactive interventions. You're essentially building a system that automatically sends the right information to the right person at exactly the right time.
Think about what this looks like in the real world:
- For your Customer Success team: An AI model flags a high-value account that's showing classic pre-churn behaviors. An alert instantly creates a high-priority task in their CSM's Intercom or Zendesk queue, complete with the specific data that triggered it. Now, the CSM can reach out before the customer is even thinking about canceling.
- For your Product & Engineering teams: You run the numbers and discover a specific bug is costing you $15,000 in MRR from churned customers and support tickets. Instead of a product manager having to manually write up a ticket, the system automatically opens an issue in Jira, Linear, or GitHub, pre-populated with the user cohort impacted and the revenue at stake.
This completely changes how teams prioritize. Suddenly, engineering sees a bug not as a line of code but as a direct revenue leak. Customer success shifts from reactive fire-fighting to proactive, data-informed relationship building.
From Data Points to Daily Actions
By embedding these triggers directly into the tools your teams use all day, you remove all the friction. You make the data-driven path the path of least resistance. The end game is to make these insights so accessible and actionable that your teams can't imagine working any other way.
Here’s how you can get started today:
- Pick your battles. Start with one or two of the most powerful churn or expansion signals you've found.
- Map out the ideal response. Who needs to know about this signal, and what's the perfect action for them to take?
- Connect the dots. Use native integrations or a tool like Zapier to link your analytics platform (like our own, SigOS) to their systems (Zendesk, Jira, Slack, etc.).
- Go live and watch. Flip the switch on the workflow and measure its impact. Are you seeing better retention? Are bugs getting fixed faster?
This operational layer is what separates companies that just have data from those that truly profit from it. It drives smarter decisions, better resource allocation, and a customer experience that feels responsive and personal.
Measuring the Revenue Impact of Product Decisions
Alright, let's talk about the final, and arguably most important, piece of the puzzle: connecting your product decisions directly to dollars and cents. This is where the rubber meets the road. It’s how you prove that all this data work isn't just an academic exercise—it's actually making the business money.
When you can confidently show how your work impacts the bottom line, you fundamentally change the perception of the product team. You’re no longer a cost center; you're a documented revenue engine.
This isn’t about guesswork or making loose assumptions. The goal is to move from saying, "I think our latest feature helped retention," to proving, "The accounts that adopted this feature showed an 8% increase in expansion MRR over the last quarter." That's a powerful shift.
Tying Product Work to Financial Metrics
To get there, you need a clear "before and after" picture. Before you ship anything—a bug fix, a new feature, a UI tweak—you have to establish a baseline for your key financial metrics. This is your control group.
Here are the big three metrics to tie your work back to:
- Churn Rate: You just shipped a fix for a bug that your analysis flagged as a major churn predictor. Now, you watch that specific cohort of users who were affected. Over the next 90 days, did their churn rate drop significantly compared to the company average? That's your proof.
- Expansion MRR: Let’s say you built a new integration that your power users were screaming for. The next step is to track their accounts closely. Are they upgrading their plans or buying add-ons at a higher rate than similar accounts without the integration? That lift in revenue is directly attributable to your team's work.
- Customer Lifetime Value (LTV): This one's more of a long-term play, but it’s incredibly important. Every time you reduce churn and drive expansion, you're directly boosting the LTV of your customer base. We've got a whole guide on how to calculate the lifetime value of a customer in SaaS if you want to go deeper.
When you can put a dollar figure on your team’s output, you change the entire conversation with leadership. It stops being, "We need more resources to build things," and becomes, "This initiative is projected to yield a $500K return, and here's the data to back it up."
The Cost of Inaction and Unlocking Opportunity
Another incredibly effective tactic is to frame the impact in terms of what you stand to lose or gain. This language creates urgency and brings a ton of clarity to prioritization meetings.
Once you have your behavior analytics wired up, you can calculate two powerful numbers:
- Cost of Inaction: This is perfect for those nagging bugs or friction points that never seem to make it to the top of the list. Look at all the users who run into a specific issue. How many of them churned? How many downgraded? What’s the total revenue lost from that group? Suddenly, you have a hard number. That "low-priority" API bug might be actively costing you $20,000/month in churned accounts.
- Revenue Opportunity: This is your go-to for feature requests. Tally up the total contract value of every single account that has asked for a specific feature. That number represents the immediate expansion MRR you could unlock or the at-risk revenue you could save just by building it.
This kind of financial modeling gives your roadmap a solid, objective foundation. It empowers your team to make a data-backed case for resources, speaking the language that everyone in the business, especially the C-suite, understands best: the bottom line.
Here's the rewritten section, designed to sound like it was written by an experienced human expert.
It’s Not Just About the Tool—It’s About the Culture
Look, installing a new analytics platform is the easy part. The real work—and where the magic happens—is building a culture where people are genuinely curious about user behavior. This is about shifting your company’s entire mindset so that data isn’t just a report someone pulls, but the very heartbeat of how you operate.
It starts by changing the conversations. Imagine your next product meeting. Instead of kicking off with opinions and gut feelings, you start by looking at a behavioral cohort of users who are about to churn and what that means for this quarter's revenue. Suddenly, you're not debating what to prioritize; you're looking at hard data that shows exactly which bug is costing you the most money or which little-known feature is quietly driving expansion.
Make Data Part of Everyone's Day
For this to take hold, you have to get the data out of the analyst’s silo and into the hands of the people on the front lines. This means making sure everyone knows how to read the signals that matter for their job.
- Your Customer Success team should be able to spot the early warning signs of churn right in their dashboards, letting them jump in before a customer is ready to walk away.
- Your Product and Growth teams need a direct line of sight into support ticket trends, creating a tight feedback loop that funnels real user pain points straight into the product roadmap.
The goal is to make data the common language everyone speaks. When a support agent can attach a dollar amount to a user's frustration, and a product manager can see that financial impact in real-time, you’ve won. That’s when you know you're truly a data-driven company.
Don't try to boil the ocean. Start with one high-impact problem. Find the first time a behavioral signal helps you save a major account, and then celebrate that win. Those early victories are what build the momentum you need to make data-informed decisions the new standard.
Frequently Asked Questions
When you're first digging into behavior analytics, it’s normal to have a few questions. The theory sounds great, but how does it actually play out in the real world? We've heard these a few times, so let's clear them up.
How Is This Different From Standard Product Analytics?
This is a big one. You're probably already using tools like Google Analytics or Mixpanel, which are great at showing you what users are doing. They'll give you clear numbers on page views, click-through rates, and which features people are adopting. You get a solid, high-level picture of user activity.
Behavior analytics, on the other hand, is all about the why. It’s designed to connect the dots between seemingly separate events to build a complete narrative. Imagine tying a frustrating user session directly to the support ticket they filed ten minutes later, or linking a drop-off in usage to a recent sales call where they mentioned a missing feature. It’s about understanding the context and intent that drives behavior.
Think of it this way: Standard analytics gives you the map of your user's journey. Behavior analytics hands you their travel diary, complete with scribbled notes on what they loved, what drove them crazy, and why they decided to go home early.
How Much Technical Skill Is Needed to Start?
I get this question a lot, and the good news is, you don't need to be a data scientist anymore. The barrier to entry has come way down.
While getting your event taxonomy set up correctly does take some initial thought (and maybe a chat with an engineer), the day-to-day work is now built for product managers, customer success leads, and founders. Modern platforms are designed with user-friendly interfaces, so you're not stuck writing complex SQL queries to find answers.
Plus, many of the newer tools use AI to do the heavy lifting for you. They can automatically flag unusual patterns, surface key correlations, and point out what’s actually important, shifting your job from technical wizardry to strategic thinking.
At SigOS, we turn complex behavioral data into clear, revenue-driven actions for your team. Discover how our AI-driven platform can help you prioritize your roadmap with confidence.
Keep Reading
More insights from our blog


Ready to find your hidden revenue leaks?
Start analyzing your customer feedback and discover insights that drive revenue.
Start Free Trial →