Predictive Churn Modeling to Boost Retention
Discover how predictive churn modeling helps you identify at-risk customers. Learn proven strategies to build effective models and boost customer retention.

Predictive churn modeling is all about using data to get a jump on customer cancellations. Think of it as a crystal ball for your business—it helps you see which customers are thinking about leaving so you can step in before they're gone for good. It’s how you turn a potential loss into a retention win.
The Proactive Power of Predictive Churn Modeling

Most companies are stuck in a reactive loop. They only find out a customer is unhappy when the cancellation email hits their inbox, and by that point, the damage is done. Predictive modeling completely flips that script. Instead of digging through data to figure out why people left last quarter, you can start forecasting who’s likely to leave next.
This isn't just a playground for data scientists. It's a real-world tool for marketers, customer success teams, and anyone responsible for the bottom line. It provides answers to the tough questions that keep a business healthy and growing.
Shifting from Reaction to Prevention
Imagine a doctor who could spot health risks long before any symptoms show up. That’s exactly what a predictive churn model does for your customer base. It digs through mountains of data—things like how often someone logs in, what features they use, and the tone of their support tickets—to find the quiet clues of dissatisfaction that a human would miss.
A customer might be logging in a little less often, or maybe they’ve stopped using a key feature they once loved. Individually, these are just small data points. But a good model pieces them all together to calculate a churn score for every single customer, giving you a clear picture of their risk level.
Why Predicting Churn Is a Business Imperative
We’ve all heard it: keeping a customer is way cheaper than finding a new one. That simple fact makes churn a direct hit to your profitability. By getting ahead of it with predictive modeling, you unlock some serious advantages:
- Targeted Retention Efforts: You can roll out the red carpet for at-risk customers with personalized outreach, special offers, or extra support.
- Improved Customer Experience: The model’s insights often point to the exact friction points in your product or service that are driving people away, giving you a roadmap for improvement.
- Accurate Revenue Forecasting: When you have a solid idea of potential churn, your financial projections become much more reliable.
This isn’t just theory; it’s happening in every industry. In telecom, for example, companies analyze massive datasets to see what behaviors lead to churn. They build models that flag subscribers based on their usage, plan details, and satisfaction scores, which allows them to launch highly targeted retention campaigns. You can actually explore this telco customer data on Kaggle to get a feel for the kind of data they use.
Gathering Your Data for Churn Prediction

Let's get one thing straight: a predictive churn model is only as good as the data you feed it. You can have the most sophisticated algorithm in the world, but if you're working with garbage data, you'll get garbage predictions. It's that simple.
Think of it as trying to solve a puzzle with half the pieces missing and the other half from a different box. You won’t see the full picture. The single biggest reason churn models fail is because the foundational data is incomplete, inaccurate, or just plain wrong. Building an effective model starts with collecting clean, well-structured data that truly reflects the customer journey.
The Core Data Categories
Before you write a single line of code, your first job is to hunt down and gather the most critical data points. These typically fall into four main groups, each offering a different lens through which to view your customers. Nail these, and you're on the right track.
- User Attributes: Who are your customers? This is your basic demographic and firmographic info—things like their subscription plan, company size, what role they have, and when they signed up. This data is essential for segmenting your user base and finding patterns within specific groups.
- Transactional Data: This is all about the money. We're talking purchase history, average order values, contract sizes, and how often they pay. Is their financial commitment growing, or has it started to shrink? Transactional data tells that story.
- Behavioral and Usage Data: This is where the magic really happens. How are people actually using your product? You need to track things like login frequency, which features they've adopted (and which they ignore), how long their sessions last, and the specific actions they take. A sudden nosedive in product usage is one of the most reliable red flags for churn.
- Customer Interaction and Feedback Data: This is the qualitative stuff—the "why" behind the numbers. Every support ticket, Net Promoter Score (NPS) survey, chat log, and direct piece of feedback is a goldmine. These interactions give you a direct line into customer happiness and, more importantly, customer frustration.
When you bring these datasets together, you can start connecting the dots. Your model might discover that users on a specific plan who haven't touched a key feature in 30 days and have two or more open support tickets are 85% more likely to cancel. That's an insight you can act on.
Turning Raw Data into Predictive Fuel
Now, let’s be realistic. This data doesn't just show up in a neat little package. It’s usually scattered across different systems—your CRM, your billing platform, your product analytics tools—and none of them speak the same language. The real work is pulling it all together into one cohesive view.
To build an effective churn model, you need to consolidate various data streams into a single, comprehensive customer profile. The table below outlines the most crucial data types, provides clear examples, and explains why each one is indispensable.
Key Data Types for Predictive Churn Modeling
| Data Category | Examples | Why It's Important |
|---|---|---|
| User Attributes | Subscription plan, company size, user role, industry, signup date | Helps segment customers and identify which groups are most at risk. |
| Transactional Data | Purchase history, contract value, payment frequency, upgrades/downgrades | Reveals a customer's financial commitment and flags changes in spending. |
| Behavioral & Usage Data | Login frequency, session duration, feature adoption, last seen date | Provides direct evidence of product engagement or disengagement. |
| Interaction & Feedback | Support tickets, NPS/CSAT scores, chat logs, survey responses | Offers direct insight into customer sentiment and specific pain points. |
Having a clear map of your data sources and their significance is the first step toward building a model that can deliver reliable, actionable predictions.
This unification process is typically handled by data pipelines. These are automated workflows that pull information from all your disparate sources, standardize it into a consistent format, and then load it into a central data warehouse where your model can access it. For a deeper dive, our guide on how to build data pipelines is a great resource for getting your data infrastructure in order.
Choosing the Right Predictive Modeling Approach
Once your data is clean and ready to go, it's time to pick the engine that will actually make the predictions. This is where we get into machine learning models, but you don't need a Ph.D. in data science to grasp the key ideas. Think of it like choosing the right tool for a job: you wouldn't use a sledgehammer to hang a picture frame.
Different models are built for different kinds of problems and data. Each one has its own strengths and weaknesses, and the real trick is understanding these trade-offs. This way, you can have a meaningful conversation with your data team and land on the best approach for your specific customers.
Foundational Models: Logistic Regression
Let's start with a classic: Logistic Regression. It’s one of the most dependable and straightforward models out there. Don't let the name fool you; it’s a classification model, meaning its job is to answer a simple yes/no question, like "Will this customer churn?"
Imagine it as a very logical calculator. It looks at all your customer data points—how often they log in, how many support tickets they've filed, their subscription level—and assigns a weight to each one based on how important it's been in the past. From there, it spits out a single churn probability score between 0 and 1. It’s fast, easy to understand, and tells you exactly which factors are pushing the needle the most.
- Best For: Getting a solid baseline. If you need a quick, clear starting point to see the main drivers of churn, this is your model.
- Limitation: It works best when the relationships in your data are fairly simple and linear. It can sometimes miss the more complex, subtle patterns in customer behavior.
Advanced Models: Random Forests
When you need a bit more muscle, you can turn to something like Random Forests. This model works less like a single calculator and more like a committee of experts. Instead of building one predictive model, it builds hundreds (or even thousands) of individual "decision trees," with each tree trained on a slightly different, random slice of your data.
Each tree in the "forest" gets to cast a vote on whether a customer is likely to churn. The final prediction is simply the majority vote. This group-think approach makes the model incredibly accurate and stable, as the errors or biases of any one tree get canceled out by the rest of the group. It's fantastic for handling all sorts of data and uncovering those tricky, non-linear relationships that Logistic Regression might overlook.
Complex Models: Support Vector Machines
Sometimes, the line between a happy customer and one about to churn is incredibly blurry and hard to define. This is where Support Vector Machines (SVMs) really shine. The core job of an SVM is to find the single best dividing line, or "hyperplane," that separates churners from non-churners as cleanly as possible.
Picture a scatter plot with red dots (churners) and blue dots (loyal customers). An SVM doesn't just draw any line to separate them; it finds the line that creates the biggest possible gap, or margin, between the two groups. This makes the classification much more robust.
This knack for finding complex, non-obvious boundaries is why SVMs are so powerful. For B2B companies, where a customer relationship has dozens of moving parts, an SVM can analyze all those features to flag at-risk accounts with remarkable accuracy. As some research on SVM effectiveness shows, they often outperform more traditional methods in these complex scenarios.
Ultimately, the right model for you is a balancing act. You have to weigh the need for raw accuracy against the importance of being able to explain the results and implement the model quickly.
Putting Your Churn Prediction Model Into Action
Building a robust churn prediction model feels like a milestone. But if its insights stay buried in a database, you’re missing the point. The real win comes when predictions drive everyday decisions.
To get there, you’ll follow a four-phase cycle: prepare your data, train and validate the model, deploy it into live workflows, then monitor and retrain. This isn’t a one-off project—it’s a continuous loop of refinement.
Phase 1 Data Preparation And Feature Engineering
Every solid model starts with clean data. Like a chef carefully washing and chopping fresh vegetables, you need to scrub CRM entries, usage logs, and billing records until they’re error-free and consistent.
Next, you step into feature engineering—turning raw inputs into powerful signals. For example, a simple “last login date” becomes days since last login, which often tells a richer story about customer engagement.
- Handling Missing Data: Fill voids with averages or use statistical methods to estimate values.
- Creating New Features: Merge data points—such as the ratio of support tickets to active days—to highlight risk factors.
- Standardizing Variables: Scale features uniformly so no single metric overpowers the model.
This groundwork ensures your predictive churn modeling learns from genuine patterns, not from random noise.
Phase 2 Model Training And Validation
With your polished dataset ready, it’s time to teach the model how churn happens. Your chosen algorithm digests historical data and spots the behaviors that lead customers to leave.
But training alone can be deceptive. You’ll split your data so 80% goes into training and 20% sits aside for testing. Treat that holdout set like a final exam—with no peeking at the answers.
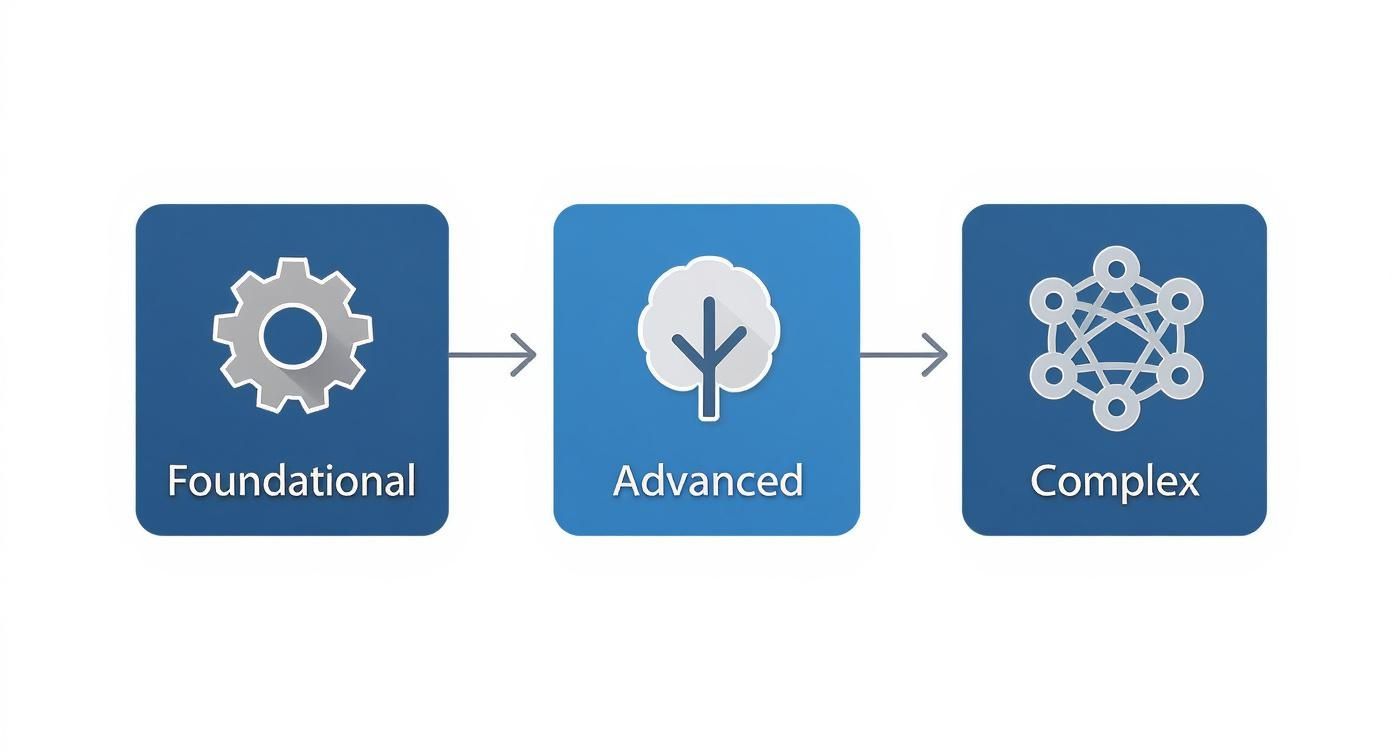
This visual maps how you can evolve from basic to advanced models, capturing ever more nuanced customer behaviors.
Phase 3 Deployment And Integration
Once your model nails its validation tests, you push it into production. The goal? Deliver churn scores right where your teams already work.
- CRM Integration: Surface a customer’s churn risk on their profile so account managers see it instantly.
- Automated Workflows: High-risk alerts can trigger follow-up calls or targeted email campaigns.
- Customer Success Platforms: Blend churn predictions into health scores for a more complete view of account stability.
By embedding churn insights into daily tools, you turn data science into tangible action.
Phase 4 Monitoring And Retraining
Customer habits shift, markets change, and new features roll out. Your model must keep pace. That’s why ongoing monitoring is critical.
Track key metrics—accuracy, precision, recall—to spot “model drift.” When performance dips, it’s time to retrain on fresh data. Many teams schedule this every quarter or twice a year to keep predictions sharp and reliable.
This continuous cycle—prepare, train, deploy, monitor—ensures your churn model remains a dynamic asset for boosting retention.
Turning Churn Predictions Into Retention Wins

Spotting a customer with a 92% churn probability feels like striking gold—until you realize it’s only the starting line. Without a plan to respond, that insight sits idle. True value emerges when data science hands off a clear signal to your marketing and customer success teams.
Think of each customer’s churn score as a temperature check on your relationship. Too hot, and you risk a sudden departure; too cool, and you might be missing growth chances. The trick is matching the right remedy to the right case so you don’t waste your team’s time or erode profit by over-discounting.
Segmenting For Maximum Impact
Not every at-risk user deserves the same playbook. By plotting churn probability against Customer Lifetime Value (CLV), you create a four-quadrant matrix that highlights where to focus:
- High-Value, High-Risk (Champions at Risk): A major account slipping away calls for white-glove service and executive check-ins.
- Low-Value, High-Risk (At-Risk Users): These users need scalable nudges—think automated emails or in-app prompts.
- High-Value, Low-Risk (Loyal Champions): They’re happy now; offer early feature previews or referral bonuses to deepen engagement.
- Low-Value, Low-Risk (Stable Users): Keep them satisfied with regular updates, but don’t divert scarce resources.
Designing Targeted Retention Plays
Once segments are defined, it’s a matter of matching tactics to customers’ needs and predicted behaviors. The table below—Retention Strategies Based on Churn Risk and Customer Value—lays out examples for each quadrant, showing how to balance effort, cost, and expected payoff.
Retention Strategies Based on Churn Risk and Customer Value
| Customer Segment | Example Retention Tactic | Goal |
|---|---|---|
| High-Value, High-Risk | Dedicated account manager calls, bespoke training sessions, or VIP executive check-ins | Rebuild trust, solve deep issues, and underscore long-term ROI |
| Low-Value, High-Risk | Automated drip emails with time-sensitive offers, in-app tips highlighting key features | Boost product adoption at scale with minimal manual outreach |
| High-Value, Low-Risk | Invitations to beta programs, exclusive webinars, or co-marketing case studies | Cement loyalty, spark referrals, and uncover upsell opportunities |
| Low-Value, Low-Risk | Standard satisfaction surveys, periodic product news, and self-service resources | Maintain baseline engagement without overcommitting team bandwidth |
These examples illustrate how you can deploy resources wisely, ensuring every retention campaign aligns with customer value and churn likelihood.
Effective churn prevention doesn’t stop at sending the right message. It’s about closing the loop between your analysts, product managers, and success teams. As you roll out these tactics, track the core customer retention metrics to see which plays truly move the needle—and iterate from there.
Common Pitfalls in Churn Modeling to Avoid
Even the sharpest teams can see their churn modeling projects go off the rails. It happens. But most of the time, the stumbles are predictable and completely avoidable, from messy data to flawed assumptions. Knowing what these common hurdles are is the first step to building a model that gives you real value, not just a bunch of misleading numbers.
The most classic mistake? "Garbage in, garbage out." It's a cliché for a reason. Your model is only as smart as the data you feed it. If your customer data is a mess—full of errors, missing fields, or wild inconsistencies—your predictions won't be worth much. It's a foundational problem that poisons the well before you even start.
Overlooking the Danger of Overfitting
One of the sneakiest technical traps you can fall into is overfitting. This is when your model gets a little too good at explaining your past data. Instead of learning the genuine patterns that signal churn, it starts memorizing the noise and random quirks in your training set.
The result is a model that looks fantastic on paper, maybe even hitting 99% accuracy during testing, but then completely bombs when it sees fresh, real-world customer data. It's useless for actually predicting the future.
A good churn model is like a seasoned detective who recognizes broad patterns of behavior, not a student who just crammed for one specific test. The goal is to generalize, not memorize.
Neglecting Business Context and Buy-In
Building a technically sound model is only half the battle. I've seen countless projects fail because of a simple disconnect between the data science team and the rest of the business. You can have the most accurate model in the world, but if the insights don't make sense to the people who need to act on them, it's just going to sit on a shelf.
This is why bringing your sales, marketing, and customer success teams into the process from day one is non-negotiable. They have the on-the-ground knowledge that can make or break your model's relevance. Without their input and buy-in, even the most urgent churn alerts will just be ignored.
Finally, don't confuse correlation with causation. Your model might show that customers using a certain feature are less likely to leave. But is the feature making them loyal, or are your most loyal customers the ones who tend to use that feature? It’s a critical distinction. Differentiating a real driver from a random coincidence is key, and it often comes down to a solid grasp of statistics. You can learn more by reading our guide on how to determine statistical significance to make sure your insights hold up.
Common Churn Modeling Questions, Answered
When you start digging into predictive churn modeling, a few practical questions always pop up. Let's tackle three of the most common ones I hear from teams just getting started.
How Often Should We Retrain Our Churn Model?
This is a big one. You need to keep your model fresh so it doesn't get out of sync with how your customers are actually behaving. For most businesses, a quarterly retraining schedule is a great sweet spot. It's frequent enough to adapt to market shifts without causing constant fire drills for your data team.
However, if you're in a really fast-moving space—think mobile gaming or a B2C subscription app—you might want to ramp that up to monthly. When customer habits change on a dime, your model needs to keep up. This regular refresh is your best defense against model drift, which is just a fancy way of saying your model's predictions have become stale and unreliable.
A few good rules of thumb for your retraining cadence:
- Quarterly: The standard for most SaaS and subscription businesses.
- Monthly: Ideal for high-volume, dynamic environments.
- On-Demand: Always retrain after a major product launch or pricing change that fundamentally alters user behavior.
Think of retraining like tuning a guitar. You have to do it periodically to make sure you're still playing the right notes, otherwise, everything starts to sound off.
What's a "Good" Accuracy Score for a Churn Model?
Everyone wants a number to aim for, but "good" really depends on your business. That said, if you're hitting 70–80% accuracy, you’re in a pretty solid position. That's a reliable baseline for most churn models.
But don't get fixated on that single accuracy number. A model that's 85% accurate but flags all the wrong customers isn't very helpful. This is where you need to look at the balance between precision and recall.
- Precision tells you: "Of all the customers we predicted would churn, how many actually did?" High precision means your retention team isn't wasting time on false alarms.
- Recall asks: "Of all the customers who actually churned, how many did we successfully predict?" High recall means you aren't letting too many at-risk customers slip through the cracks.
The goal is to find the right trade-off for your team. You also want to keep an eye on your AUC (Area Under the Curve) score, which gives you a good sense of the model's overall predictive power.
Can a Small Business Realistically Use Churn Modeling?
Absolutely. You don't need a massive dataset to get started. Think about a neighborhood coffee shop owner who notices a regular hasn't been in for a couple of weeks. That's a simple, human version of churn prediction.
Even with just 200 customer records, you can start to spot meaningful patterns. The key is to focus on the data you do have. By combining simple usage data (like last login date) with a bit of customer feedback, you can build a surprisingly effective model.
Here’s how to make it work on a smaller scale:
- Zero in on high-impact signals. Things like subscription downgrades or support ticket spikes are powerful clues.
- Use accessible tools. You don't need an enterprise-level platform. Open-source libraries like Scikit-learn or low-cost AutoML services are perfect for this.
- Start simple and build up. Your first model won't be perfect, but it will give you a foundation to build on as your data grows.
You don't need to boil the ocean. Even small, early insights can help you create targeted campaigns that keep your first crucial customers from walking away.
By setting a smart retraining schedule, focusing on the right performance metrics, and starting with the data you have, you can build a churn prediction system that delivers real value, no matter the size of your company.
Try SigOS at https://sigos.io
Keep Reading
More insights from our blog


Ready to find your hidden revenue leaks?
Start analyzing your customer feedback and discover insights that drive revenue.
Start Free Trial →