Mastering saas customer lifetime value calculation: A Practical Guide to Growth
Discover saas customer lifetime value calculation with practical formulas, cohort insights, and predictive models to reduce churn and grow revenue.

Calculating SaaS customer lifetime value is about more than just crunching historical numbers. It’s a vital discipline that helps you predict the total revenue you can realistically expect from a single customer over their entire journey with your company. Think of it less as a report card and more as a crystal ball for your business's future health.
Why Accurate CLTV Is The Engine For SaaS Growth

Let's get one thing straight: customer lifetime value (CLTV) isn't just another vanity metric for your dashboard. It's the central nervous system of a well-run SaaS business. It connects the dots between your product, marketing, and customer success efforts, translating them directly into financial outcomes.
A solid CLTV calculation gives you the answer to one of the most important questions you can ask: How much can I actually afford to spend to get a new customer? This shifts the entire company’s focus from chasing short-term revenue to building valuable, long-term relationships.
Getting this number right provides a clear roadmap for profitability. Getting it wrong? That can lead to fatal miscalculations, like burning cash on unprofitable acquisition channels or building features for the wrong customer segment.
The Critical LTV to CAC Ratio
The real power of CLTV is unleashed when you put it side-by-side with your Customer Acquisition Cost (CAC). The LTV to CAC ratio is the ultimate litmus test for a sustainable SaaS model.
For years, the industry benchmark has been a healthy 3:1 ratio. This is the gold standard. It means for every dollar you spend to bring a customer in the door, you're getting three dollars back over their lifetime. A ratio hovering around 1:1 is a serious red flag—you're basically treading water. Anything higher than 3:1 is a green light to step on the gas. If you want to dig deeper into this essential benchmark, Design with Value offers some great insights.
Key Takeaway: An accurate CLTV calculation isn't an academic exercise. It directly informs how much you can spend on sales and marketing, identifies your most profitable customer segments, and validates your entire business model.
Driving Decisions Across Your Organization
When you truly master your CLTV, you empower every team to make smarter, data-backed decisions. It becomes a unifying metric that gets everyone—from engineers to marketers—rowing in the same direction: building a valuable, long-lasting customer base.
Here’s how it plays out in the real world:
- Product Teams: They can stop guessing and start prioritizing feature requests from high-CLTV segments. This ensures precious development resources are spent on initiatives that actually drive long-term value.
- Growth Teams: Knowing the lifetime value of customers from different channels lets them double down on what works. They can confidently allocate budget to high-performing campaigns and optimize for maximum ROI, not just cheap leads.
- Customer Success: It informs how you structure your support. You can design tiered models that give high-value accounts the white-glove treatment they deserve, proactively preventing churn and spotting expansion opportunities.
Ultimately, CLTV is the clearest indicator of your company's health and scalability. This guide will walk you through everything from the basic formulas to advanced predictive models, giving you the tools to turn this metric into your most valuable strategic asset.
Calculating CLTV With The Foundational Formulas
Before we get into the more complex models, let's start with the foundational formulas. These are the workhorses of CLTV calculation and for good reason—they’re quick, rely on data you should already have, and give you a surprisingly accurate snapshot of your business's health.
Think of these formulas as the bedrock for understanding what a customer is really worth. This number is critical. It directly informs how much you can responsibly spend to acquire a new customer in the first place.
The most straightforward way to get a baseline CLTV is with a simple, elegant formula that combines two key SaaS metrics: Average Revenue Per Account (ARPA) and your Customer Churn Rate.
CLTV = Average Revenue Per Account (ARPA) / Customer Churn Rate
This calculation gives you the total expected revenue from a customer before they, well, churn. It’s the perfect place to start because the data is usually easy to pull from your billing or finance platform.
Breaking Down The Simple CLTV Formula
Let's make this real. Imagine you're running a SaaS tool for project management.
First, you need your Average Revenue Per Account (ARPA). This is just the average monthly recurring revenue (MRR) you bring in from each of your active customers. To get it, just divide your total MRR by your total customer count.
- Example ARPA: If you have 50,000 in MRR from 500 customers, your ARPA is ****100. Simple.
Next up is your Customer Churn Rate. This is the percentage of customers who cancel their subscription in a given period, usually a month. Churn is the silent killer of SaaS growth, so keeping a close eye on it is non-negotiable. For a much deeper look into the mechanics of this metric, a comprehensive SaaS Churn Analysis is well worth your time.
- Example Churn: If 20 of your 500 customers cancel this month, your monthly churn rate is 4%.
Now, we just plug those numbers into the formula:
**CLTV = ****100 (ARPA) / 0.04 (Churn Rate) = **2,500
What does this tell you? It tells you that, on average, a new customer is worth $2,500 in total revenue over their entire time with you. This single number is incredibly powerful for shaping your customer acquisition strategy.
Leveling Up To A Profitability-Focused Formula
That first formula is great for a quick look at revenue, but it has a blind spot: it ignores your costs. A more sophisticated—and frankly, more useful—CLTV calculation brings Gross Margin into the picture.
CLTV = (ARPA x Gross Margin) / Customer Churn Rate
Adding this one component completely changes the game. It shifts the focus from just revenue to actual profitability, which gives you a far more honest assessment of a customer's true value.
Expert Tip: Never skip the Gross Margin calculation. A high-revenue customer isn't valuable if your costs to serve them are equally high. Focusing on profitable CLTV prevents you from scaling an unprofitable business model.
Let's go back to our project management tool.
Your Gross Margin is simply the percentage of revenue you have left after paying your Cost of Goods Sold (COGS). In SaaS, COGS typically includes things like hosting, customer support team salaries, and third-party software fees tied to service delivery.
- Example Gross Margin: Let's say your COGS (support, hosting, etc.) amounts to 10,000 on your ****50,000 MRR. Your Gross Profit is $40,000, which means your Gross Margin is a healthy 80%.
Now, let's run the numbers with our updated formula:
**CLTV = (**100 ARPA x 0.80 Gross Margin) / 0.04 Churn Rate **CLTV = **80 / 0.04 = $2,000
See the difference? While a customer generates 2,500 in lifetime revenue, they only contribute ****2,000 in lifetime gross profit. This is the figure you should be comparing against your Customer Acquisition Cost (CAC) to ensure you're building a sustainable business, not just a high-revenue one.
To make this easier, here’s a quick-reference table for the core components we’ve just discussed.
CLTV Formula Components At A Glance
| Metric | What It Measures | Formula And How To Find It |
|---|---|---|
| ARPA | The average monthly revenue per account. | Total MRR / Total Number of Customers. Your billing system (e.g., Stripe, Chargebee) has this data. |
| Churn Rate | The percentage of customers who cancel their subscription in a period. | (Customers Lost / Customers at Start of Period) x 100. Also found in your billing or subscription management platform. |
| Gross Margin | The profitability of your revenue after direct service costs. | ((Total Revenue - COGS) / Total Revenue) x 100. Your accounting software is the source of truth here. |
This table should serve as a handy cheat sheet as you begin to pull the data needed to calculate your own foundational CLTV.
Moving Beyond Averages With Cohort Analysis
While the basic formula gives you a vital, big-picture number, relying on a single, company-wide CLTV can be dangerously misleading. That one average figure often hides crucial trends and variations bubbling just beneath the surface. To really get a handle on the health and trajectory of your business, you have to go a level deeper with cohort analysis.
This technique is all about grouping customers based on a shared characteristic—most often, their sign-up date. For instance, everyone who joined in January becomes the "January Cohort," February sign-ups form the "February Cohort," and so on. By tracking how each of these specific groups behaves over time, you can uncover powerful insights that a simple average would completely miss.
The foundational formula we've discussed is built on two core components, as you can see here.
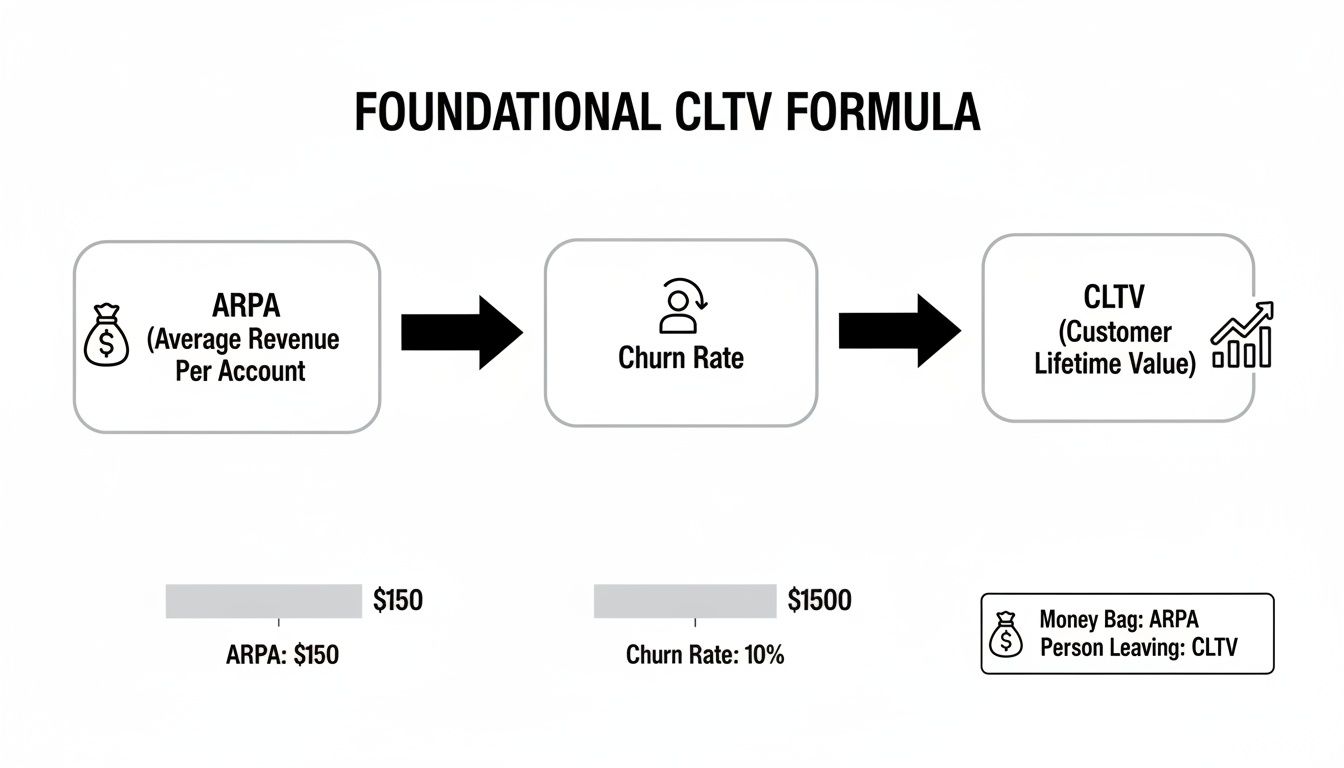
While ARPA and Churn are the building blocks, cohort analysis lets you see how these metrics actually shift and evolve for different customer segments over their entire lifecycle. It's the difference between a snapshot and the full motion picture.
Why Cohort Analysis Is a Game-Changer
Trusting a single CLTV number is like trying to navigate a city with a map that only shows the average elevation. You have no idea which parts are mountains and which are valleys. Cohort analysis gives you that detailed topographical map for your customer base.
It helps you finally answer the critical questions that a blended average just can't:
- Product Impact: Did that major feature we pushed in Q3 actually improve retention for the customers who signed up right after the launch?
- Marketing Efficiency: Are customers from our content marketing efforts sticking around longer and paying more than those we acquired through paid search?
- Onboarding Success: We revamped our onboarding flow in May. Are customers who signed up after that change showing better long-term value than earlier cohorts?
This granular view transforms your SaaS customer lifetime value calculation from a static report card into a dynamic feedback loop for your entire business. You can finally draw a straight line between your product, marketing, and success initiatives and the financial outcomes they produce.
Key Insight: Cohort analysis reveals the story behind your CLTV. It shows you whether your business is getting better at creating and retaining valuable customers over time—a far more important health indicator than any single, static number.
A Real-World Scenario Comparing Cohorts
Let's say your blended, company-wide CLTV is $3,000. On the surface, things might look fine. Stable, even. But when you dig into the cohorts, you might find a completely different story unfolding.
Imagine you decide to compare two groups: the Q1 Cohort (customers who signed up between January and March) and the Q3 Cohort (those who joined between July and September). In the months between, your team launched a highly-requested integration suite designed to make the product much stickier.
Here’s what your analysis could uncover:
| Metric | Q1 Cohort (Pre-Integration) | Q3 Cohort (Post-Integration) |
|---|---|---|
| Average ARPA (at Month 6) | $120 | $145 (users adopting integrations upgrade) |
| Cumulative Churn (at Month 6) | 25% | 15% (the integrated product is harder to leave) |
| Calculated CLTV | $2,880 | $5,800 |
Suddenly, the picture is crystal clear. The Q3 Cohort is on track to be twice as valuable as the Q1 Cohort. This isn't just an interesting data point; it's actionable intelligence. It proves the new integration was a massive win, justifying more investment in that area. It also hands your marketing team a powerful new story to tell prospective customers.
For any team looking to build this kind of analysis from the ground up, the perfect next step is understanding the nuts and bolts of a great cohort retention analysis.
This is the real power of moving beyond averages. You connect your strategic decisions directly to financial outcomes, giving you the confidence to double down on what works and fix what doesn't.
Using Behavioral Data for a Smarter, Predictive CLTV
While the classic CLTV formulas give you a sharp picture of the past, they’re a bit like driving while looking only in the rearview mirror. You can see where you’ve been, but not where you're headed. This is where we shift from historical reporting to forward-looking strategy.
Predictive CLTV models use a customer's real-time actions to forecast their future value. It turns your saas customer lifetime value calculation from a reactive metric into a proactive tool for growth. Instead of relying on averages, this approach zooms in on the subtle behavioral signals that separate a customer who’s about to churn from one who’s ready to upgrade.
Turning User Actions into Accurate Forecasts
The big idea here is that what a customer does is a far better predictor of future value than when they signed up. Certain actions are powerful leading indicators of high retention or, conversely, a looming churn risk. Tracking these signals allows you to build a much more dynamic and accurate picture of what each customer is truly worth.
This method goes way beyond simple metrics like ARPA and churn. It weaves in a richer, more nuanced set of data to build its forecast.
Some of the most telling behavioral signals include:
- Feature Adoption: Are customers using your "sticky" features—the ones that create dependency and deliver the most value? Or are they just scratching the surface? Low adoption of core functionality is a classic red flag.
- Support Ticket Patterns: A sudden spike in bug reports can signal frustration. On the other hand, a customer asking sophisticated questions about advanced workflows is likely deeply engaged and could be a prime candidate for an upsell.
- Product Usage Depth: How often do they log in? How long are their sessions? Are they collaborating with teammates inside your app? These patterns reveal just how embedded your product is in their day-to-day work.
- Expansion Indicators: Are they bumping up against usage limits, inviting new users, or exploring features locked behind a higher tier? These are buying signals, plain and simple.
By feeding this behavioral data into a predictive model, you can assign a unique future value score to every single customer, letting you focus your efforts where they’ll have the biggest impact.
How to Quantify What Used to Be Unquantifiable
One of the most powerful things about this approach is its ability to translate qualitative feedback into hard, revenue-focused numbers. For years, insights from support tickets, chat logs, and sales calls were treated as anecdotal evidence. That’s no longer the case.
For a product manager, this is a game-changer. A product-intelligence platform like SigOS can analyze thousands of customer interactions, using AI to pinpoint the exact issues that are costing you money. It might reveal that a specific bug mentioned in 15% of support tickets is almost exclusively affecting your high-CLTV enterprise customers. Suddenly, that bug isn’t just an annoyance—it’s a high-priority churn risk that needs to be fixed now.
This process turns fuzzy feedback into a precise input for your CLTV model. You stop guessing which problems matter most and start quantifying their direct impact on the bottom line. You can learn more about the mechanics behind this in our guide on what is behavioral analytics.
This shift is critical, especially when you realize how many companies are flying blind. A recent study revealed that only 42% of companies can even measure CLTV accurately, leaving the majority making key decisions in the dark. Advanced methods offer a clear advantage, turning behavioral patterns into remarkably precise forecasts. Discover more insights about these retention statistics on Custify.com.
Making Proactive Intervention Your New Standard
Ultimately, the goal of predictive CLTV is to empower your teams to act before it’s too late. When your model flags a high-value account whose engagement has dropped off a cliff, your customer success team can reach out immediately—not next month, but today—to understand what’s wrong and get them back on track.
It’s the difference between reacting to the past and shaping the future.
| Strategy | Reactive (Historical CLTV) | Proactive (Predictive CLTV) |
|---|---|---|
| Churn Management | You analyze why a valuable customer churned last quarter. | You get an alert that a valuable customer's feature usage has dropped 30% this week. |
| Upsell Timing | You send a generic upgrade email to all users on a specific plan. | You target a customer for an upsell after they invite three new team members. |
| Feature Prioritization | You prioritize a feature based on the total number of requests. | You prioritize a feature requested by a segment with a predicted 250% higher CLTV. |
This proactive stance completely changes how you manage customer relationships. You stop waiting for bad things to happen and start actively creating positive outcomes, all guided by the real-time truth of your behavioral data.
Watch Out: Common CLTV Calculation Traps
An inaccurate SaaS customer lifetime value calculation isn't just a harmless mistake—it can be more damaging than having no calculation at all. When you're making big decisions based on flawed data, you're on a fast track to misallocating your budget, chasing the wrong customers, and completely misreading the health of your business.
The biggest blunders happen when teams treat all customers and all revenue as one big, happy family. This masks the real story. A seemingly healthy, blended CLTV can easily hide a leaky bucket in one segment or a dangerous over-reliance on a handful of whale accounts.
Let's walk through the most common pitfalls I see teams fall into and, more importantly, how you can sidestep them.
Pitfall #1: Ignoring Gross Margin
This is one of the most frequent—and dangerous—mistakes. It's easy to get excited about revenue, but it doesn't tell the whole story.
A customer generating 5,000 in lifetime revenue looks great on the surface. But what if your Cost of Goods Sold (COGS)—things like hosting, data processing, and dedicated support—eats up ****4,500 of that? Suddenly, their actual value to your business is only $500.
Forgetting to factor in gross margin blows up your CLTV, which can trick you into drastically overspending to acquire new customers. You might find yourself scaling a business that's fundamentally unprofitable.
How to Fix It: Always, always use profit in your formula. Calculate your gross margin ((Revenue - COGS) / Revenue) and apply it to your Average Revenue Per Account (ARPA) before you do anything else. This simple step shifts the entire conversation from vanity revenue to bottom-line profit, which is what actually keeps the lights on.
Pitfall #2: Relying on a Blended Churn Rate
Using a single, company-wide churn rate is a recipe for disaster. This "blended" metric is a master of disguise, often hiding serious problems right under your nose. For instance, a 3% blended monthly churn might seem acceptable.
But when you dig in, you might find that your self-serve SMB customers are churning at an alarming 8% per month. The only reason your overall number looks okay is that your high-value enterprise accounts have a rock-solid 0.5% churn. The low enterprise churn is masking a massive product-market fit problem with your smaller customers.
Key Takeaway: A blended churn rate tells you what's happening on average, but it completely fails to explain why. This blind spot makes it impossible to take targeted, effective action to fix retention problems.
How to Fix It: Segment, segment, segment. At the very least, you need to calculate churn for each of your major customer segments (e.g., SMB vs. Enterprise, or by pricing tier). This instantly shines a light on where your retention efforts are working and where they’re falling flat, paving the way for a much smarter response.
Pitfall #3: Mixing Monthly and Annual Subscriptions
Lumping your monthly and annual subscribers together will completely warp your CLTV calculation. These are two fundamentally different types of customers.
Annual customers are inherently more valuable. They pay upfront (hello, cash flow!) and almost always have a much lower churn rate. A customer who pays 1,200 for an annual plan is not the same as one paying ****100 a month, even if the yearly revenue looks identical on paper. Why? The annual customer is locked in, while the monthly one has twelve chances to leave you in that same period.
How to Fix It: Treat them as separate cohorts. It’s that simple. Calculate CLTV for your monthly subscription customers and then do a completely separate calculation for your annual customers. You'll end up with two very different—and far more accurate—numbers. This insight is pure gold for your marketing and sales teams, as it powerfully quantifies the real value of pushing for annual commitments.
By sidestepping these common traps, you can transform your CLTV from a simple vanity metric into a powerful diagnostic tool. A clean, segmented, and profit-focused CLTV is the only reliable foundation for making smart calls on where to invest your time and money for real, sustainable growth.
Turning CLTV Insights Into Action

Running a precise SaaS customer lifetime value calculation is just step one. The real magic happens when you start putting those numbers to work, turning a simple metric into a powerful tool for making smarter, more profitable decisions across the entire company.
This is where growth and marketing teams can really shine. With solid CLTV data, you can finally move beyond just chasing low-cost leads and start focusing on the channels that bring in genuinely valuable customers.
Imagine you discover that customers from your content marketing efforts have a 35% higher CLTV than those from paid search. That's not just an interesting fact; it’s a clear signal to shift your budget and double down on what’s proven to work for the long haul.
Sharpening Your Product and Success Strategies
For product managers, CLTV segmented by customer type is like a treasure map for your roadmap. It links feature requests directly to revenue. If you know your enterprise clients have a CLTV that's five times higher than your SMB segment, prioritizing those advanced security features they keep asking for becomes a no-brainer.
Customer success teams can also use CLTV to build smarter service models. When you know which accounts are your most valuable, you can create tiered support structures that deliver proactive, white-glove service where it counts the most. A great starting point is improving your customer success onboarding process, as this initial experience heavily influences long-term value.
By tiering service levels based on CLTV, success teams can focus their most valuable resource—time—on the customers who have the biggest impact on the bottom line, proactively preventing churn and identifying expansion opportunities.
This strategic approach protects your most important revenue streams. By embedding customer retention best practices guided by CLTV, you build a powerful engine for sustainable growth.
Common Questions About SaaS CLTV
Even after you've got the formulas down, some practical questions always pop up when you're in the trenches calculating customer lifetime value. Here are the answers to the ones I hear most often.
What’s a Good LTV to CAC Ratio?
The classic benchmark for a healthy SaaS business is a 3:1 ratio. Put simply, for every dollar you put into acquiring a customer, you should be getting three dollars back over their lifetime.
If you're hovering around 1:1, you’re basically running on a hamster wheel—spending as much as you're making. On the flip side, if you're hitting 4:1 or even higher, that's a great sign you've found a profitable growth engine and can probably afford to spend more aggressively to scale up.
How Often Should I Recalculate CLTV?
This isn't a "set it and forget it" metric. For most SaaS companies, especially those moving quickly, you should be revisiting your CLTV calculations quarterly.
This cadence is frequent enough to see how your recent product launches, pricing adjustments, or new marketing campaigns are affecting customer value. If a quarterly review isn't feasible, you absolutely must do it at least once a year.
Does CLTV Need to Include Upsells and Expansion?
Yes, one hundred percent. A true CLTV calculation has to include every dollar a customer brings in, which means factoring in all upgrades, add-ons, and cross-sells.
If you ignore expansion revenue, you're getting a skewed, incomplete picture of your customers' real worth. This is especially true for product-led growth companies, where the initial "land" is often small and the real value comes from the "expand" motion later on.
My Two Cents: Think of the "V" in CLTV as the total value of the entire relationship. It’s not just the first deal. It’s the initial subscription plus all the growth that follows, giving you the full story of what a customer is worth.
How Do I Handle Free Trials or Freemium Users?
This one's simple: free users don't have a CLTV because they aren't generating revenue yet. You only start calculating their lifetime value once they pull out their credit card and convert to a paid plan.
Until then, they live on the other side of the equation as part of your Customer Acquisition Cost (CAC). The metric you need to obsess over here is your free-to-paid conversion rate, because that’s what feeds your pipeline of future high-value customers.
Ready to stop guessing which customer feedback impacts revenue? SigOS uses AI to analyze support tickets, sales calls, and usage data, pinpointing the exact issues that drive churn and the features that unlock high-value deals. Prioritize your roadmap with confidence. See how SigOS connects product intelligence to your bottom line.


Ready to find your hidden revenue leaks?
Start analyzing your customer feedback and discover insights that drive revenue.
Start Free Trial →