Mastering SaaS Lifetime Value Calculation for Sustainable Growth
Unlock sustainable growth with our guide to SaaS lifetime value calculation. Learn proven methods, predictive models, and how to avoid common pitfalls.

Calculating the lifetime value (LTV) of a SaaS customer means figuring out the total revenue you can reasonably expect from them over the entire time they're with you. At its most basic, you can get a quick estimate by dividing the Average Revenue Per Account (ARPA) by your Customer Churn Rate. This gives you a starting point, a simple but powerful snapshot of what a customer is worth.
But that's just the beginning.
Why Getting LTV Right Is Everything for SaaS Growth
In a subscription business, LTV isn't just another number to track on a dashboard. For anyone in leadership, product, or marketing, it’s your financial North Star. Metrics like Monthly Recurring Revenue (MRR) tell you how you’re doing right now, but LTV tells you if you’re built to last. It answers the one question that matters most: are the customers we're bringing in worth more than what we spent to get them?
Without a firm handle on LTV, you’re essentially flying blind. An accurate calculation dictates how much you can really afford to spend on acquiring new customers, which marketing channels are actually paying off, and what product features will truly move the needle.

From Metric to Strategy
A precise saas lifetime value calculation isn't just about accounting; it's a strategic weapon. It shows you exactly who your most valuable customers are, so you can stop guessing and start focusing retention efforts where they’ll have the biggest payoff.
Imagine discovering that customers who come from organic search have a 30% higher LTV than those from your paid campaigns. That’s not just an interesting fact—it’s a clear signal to invest more heavily in your content and SEO strategy.
This kind of insight is also gold for your product team. When you analyze the LTV of users who engage with certain features, you get a data-backed reason to prioritize updates that actually boost loyalty and keep customers around longer.
Key Takeaway: LTV is more than a historical report card; it's a predictive tool. It quantifies customer relationships, turning abstract concepts like loyalty and engagement into a concrete dollar value that guides every facet of your business strategy.
To help you get started, here's a quick look at the main formulas we'll be diving into.
Key LTV Formulas at a Glance
This table offers a quick-reference guide to the different ways you can calculate LTV. Each has its place, depending on the data you have and the questions you need to answer.
| Calculation Method | Formula | Best Used For |
|---|---|---|
| Simple LTV | ARPA / Customer Churn Rate | Quick, high-level estimates when you need a fast snapshot. |
| Standard LTV | (ARPA x Gross Margin %) / Customer Churn Rate | A more realistic view that accounts for the cost of serving customers. |
| Predictive LTV | Sum of (Projected Revenue per Period) / (1 + Discount Rate)^Period | Advanced forecasting for mature businesses with historical data. |
| Cohort-Based LTV | Average Revenue per Customer in a Cohort over Time | Analyzing the value of specific customer groups acquired at the same time. |
Understanding these approaches is the first step. The real magic happens when you start applying them to your growth initiatives.
Connecting LTV to Real-World Growth
At the end of the day, knowing what your customers are worth is the foundation for making them more valuable. This knowledge provides the context you need to build more effective multi-channel marketing automation strategies that drive real growth and keep customers happy.
With a clear view of LTV, you can finally:
- Set Smarter Budgets: Justify your marketing spend with confidence, allocating money to the channels that bring in the most profitable customers.
- Optimize Your Pricing: Figure out which pricing tiers attract and hold onto the highest-value users over the long haul.
- Forecast with Accuracy: Build financial models that you, your team, and your investors can actually trust.
- Unite Your Teams: Give sales, marketing, and product a shared goal to rally around—attracting and delighting customers who will stick with you.
This guide will walk you through the practical steps to go from these basic formulas to a truly sophisticated understanding of your business's LTV.
The Foundational Method for Historical LTV Calculation
Before you can even think about predicting the future, you need a firm handle on the past. That's where historical LTV comes in. It’s the bedrock of any solid financial model because it’s based on the cold, hard facts of revenue you’ve actually generated from your customers.
To get started, you only need two core metrics: your Average Revenue Per User (ARPU) and your Customer Churn Rate. This approach gives you a clear, factual baseline. It grounds your entire strategy in reality, telling you what a customer has truly been worth to your business so far.

First, Nail Down Your Average Revenue Per User
So, what's the first number you need to find? Your ARPU. If your SaaS only has one price, congratulations—that was easy. But for most of us, it's not that simple. Multiple subscription tiers mean you need to calculate a weighted average to get an accurate picture.
Let’s walk through it with a fictional mid-sized SaaS, "ConnectSphere." They have two plans:
- Pro Plan: 500 customers paying 50/month each. (500 * 50 = $25,000)
- Business Plan: 100 customers paying 150/month each. (100 * 150 = $15,000)
To find their true ARPU, you just add up the total revenue and divide it by the total number of customers.
Calculation Example: (25,000 + 15,000) / (500 + 100) = 40,000 / 600 = 66.67 ARPU
That $66.67 is the magic number. It represents the average monthly revenue you can expect to bring in from any given account across your entire customer base.
Next, Get a Handle on Your Customer Churn Rate
With ARPU sorted, it's time to face the other side of the coin: your customer churn rate. This is simply the percentage of customers who cancel their subscriptions in a given period, which is typically a month.
Let’s stick with ConnectSphere. They started the month with 600 customers. By the end of the month, 18 of them had canceled.
The formula is straightforward: (Customers Lost / Total Customers at Start) * 100.
Churn Calculation: (18 lost customers / 600 total customers) * 100 = 3% monthly churn rate.
A word of warning here: be consistent. If you calculate ARPU on a monthly basis, you absolutely must use your monthly churn rate. Mismatching timeframes—like using monthly ARPU with annual churn—will throw your LTV calculations into chaos.
If you want to go deeper and see how different groups of users churn over time, a good next step is to perform a cohort retention analysis.
Putting It All Together for a Simple LTV
Alright, you have your two key ingredients. Now you can plug them into the simple historical LTV formula:
LTV = ARPU / Customer Churn Rate
For ConnectSphere, the math looks like this:
- **LTV = ****66.67 / 0.03 = **2,222.33
And there you have it. On average, every new customer ConnectSphere acquires is worth $2,222.33 in revenue over their entire relationship with the company. This is why churn is such a powerful lever. Think about it: reducing churn from 4% to 3% can boost LTV by a massive 33% without you ever having to touch your prices.
Don't Forget to Adjust for Profitability with Gross Margin
The simple LTV formula is a great starting point, but it has one major flaw: it completely ignores the cost of serving your customers. I’m talking about expenses like hosting, customer support team salaries, and third-party software licenses. To get a true sense of a customer's actual value, you have to factor in your gross margin.
This gives us a much more realistic formula:
LTV = (ARPU * Gross Margin) / Customer Churn Rate
Let’s say ConnectSphere runs a tight ship and has a gross margin of 80% (or 0.80).
- LTV = ($66.67 * 0.80) / 0.03
- **LTV = ****53.34 / 0.03 = **1,778
By accounting for the cost of goods sold (COGS), we see the profitable lifetime value of a customer drops to $1,778. This number is infinitely more useful for making smart decisions about your marketing spend and overall budget, because it’s tied directly to the profit each customer generates.
Using Predictive Models to Forecast Future LTV
Relying on historical LTV is a bit like driving by only looking in the rearview mirror. It gives you a clear picture of where you’ve been, but it’s not much help for navigating what’s ahead. This is where predictive models come in, shifting your SaaS lifetime value calculation from a reactive exercise to a proactive growth strategy.
Predictive LTV allows you to estimate a customer's future value right from the moment they sign up. This is a game-changer, especially for younger companies that don't have years of churn and revenue data to work with. Instead of waiting around to see which customers stick, you can make smarter decisions today.
These models work by spotting leading indicators—early behavioral signals that are tightly correlated with long-term value. By tracking these cues, you can forecast LTV with impressive accuracy, even for brand-new cohorts.
Identifying Key Predictive Inputs
The magic of a good predictive model is all in the data you feed it. You have to look beyond simple revenue and churn numbers and start incorporating more dynamic, forward-looking metrics. Think of these as the early warning signs—or green lights—for a customer's long-term health.
From my experience, the most powerful inputs usually include:
- Early User Engagement: How fast does a new user adopt your core features? Someone who invites three teammates and creates five projects in the first week is screaming "high potential."
- Purchase Frequency and AOV: For usage-based models, how often are customers hitting their plan limits or making additional purchases? Consistent, high-value transactions are an incredibly strong signal.
- Support Ticket Patterns: Look at the type of tickets. Are they asking about advanced features, which shows deep engagement? Or are they struggling with basic usability, signaling a potential churn risk?
- Product Adoption Velocity: The speed at which users explore and integrate different parts of your platform can be a powerful predictor of who will upgrade versus who will churn out.
By weaving these behavioral signals together, you can build a model that doesn’t just guess—it intelligently forecasts which new sign-ups are on the path to becoming your next VIPs. To get this done right, many teams use specialized platforms. We put together a guide on the best predictive analytics software if you're exploring options.
A Practical Scenario: From Reactive to Proactive
Let's imagine a project management SaaS called "TaskFlow." For years, they calculated LTV annually and knew their enterprise clients were the most valuable. That’s useful information, but it isn’t exactly actionable on a day-to-day basis.
Everything changed when they built a predictive model. They uncovered a powerful insight: new trial users who connected their account with both a calendar app and a cloud storage service within the first 48 hours had a 4x higher predicted LTV. This was their "aha!" moment.
Instead of waiting a year to confirm a customer's value, TaskFlow could now identify its most promising users in just two days. This insight transformed their entire growth strategy.
Armed with this knowledge, their marketing team launched targeted ad campaigns highlighting these exact integrations. The product team built a new in-app checklist that guided users straight to these high-value actions. The result? They boosted the number of high-LTV customers by 35% in a single quarter.
Advanced Formulas for Future Forecasting
Modern predictive LTV models have evolved far beyond the basic ARPU/churn formula. The best ones now pull in multiple variables to paint a much richer financial picture.
For instance, many SaaS models now blend metrics like average order value (AOV), purchase frequency, and expected customer lifetime. A company with a 200 AOV and an average of 6 purchases per year has an annual customer value of ****1,200. If their predictive model points to an average lifetime of three years (36 months), the total LTV grows to 43,200. After you subtract an ****800 acquisition cost, you're left with a net profit of $42,400—a number that makes it much easier to justify investing in retention.
This kind of forward-looking approach allows you to allocate resources with a whole lot more confidence.
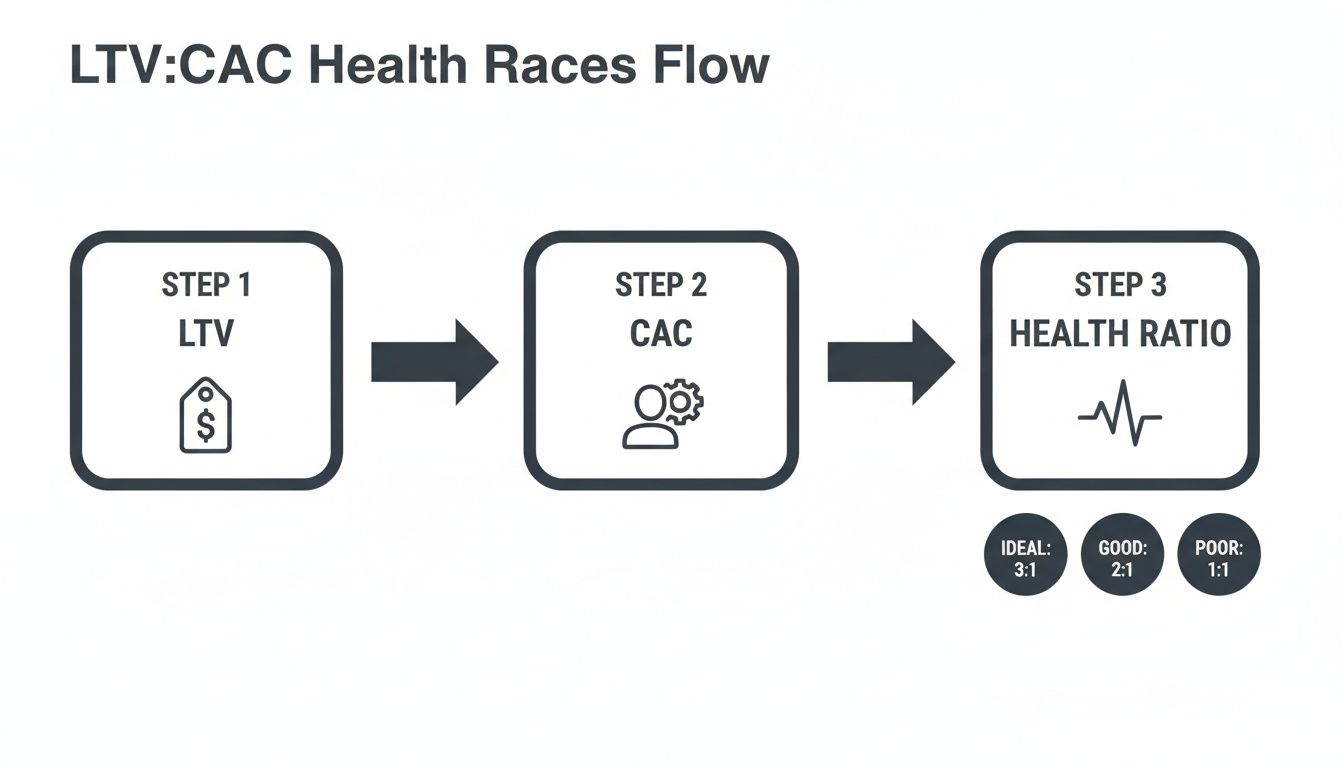
How the LTV to CAC Ratio Reveals Your Business Health
Calculating your Lifetime Value is a huge win, but the number itself is pretty meaningless on its own. A 2,000 LTV sounds incredible, right? But what if it costs you ****2,500 to land that customer? Suddenly, you're not celebrating—you're just burning cash on a broken business model.
This is exactly why the LTV to Customer Acquisition Cost (CAC) ratio is the single most important health check for any SaaS company. It's the ultimate litmus test for sustainability. This one simple ratio answers the most critical question you can ask: for every dollar we spend to get a customer, how many dollars do we get back? It cuts through all the noise and tells you if your growth engine is actually profitable.
First, Get an Honest Look at Your CAC
Before you can get your ratio, you have to get real about your Customer Acquisition Cost. And I mean really real. This isn't just your ad spend. A true CAC calculation includes every single penny you spent to acquire new customers over a specific period.
You'll need to pull together all your sales and marketing expenses, including:
- Salaries and commissions for your entire sales and marketing crew.
- Ad spend on every platform—Google, LinkedIn, social media, you name it.
- Software and tool costs for your CRM, marketing automation, and analytics.
- Content creation costs, whether that's freelance writers or agency retainers.
Once you have that total, just divide it by the number of new customers you brought in during that same timeframe.
A Quick CAC Example: Let's say you spent 50,000 on sales and marketing last quarter and signed up 100 new customers. Your CAC is ****500. (50,000 / 100 = 500 CAC)
Chasing the Magic 3:1 Ratio
Okay, you have your LTV and your CAC. Now for the moment of truth. In the SaaS world, the gold standard you'll hear whispered in every boardroom is a 3:1 ratio. This means for every 1 you spend on acquisition, you generate ****3 in lifetime value.
But why is 3:1 the sweet spot? A 1:1 ratio is a five-alarm fire; you're actively losing money on every new customer once you factor in your operational costs. A 2:1 ratio is living on the edge, leaving you almost no margin for error, let alone reinvestment.
The 3:1 ratio is where a SaaS business really finds its groove. It’s a clear signal that you have a profitable acquisition model with enough cash flow to cover all your other costs and still have a healthy chunk left over to pour back into product development and growth.
What Your LTV to CAC Ratio Is Telling You
Think of your ratio as a powerful diagnostic tool. It’s not just a number; it’s a direct order from your business on what to do next.
| LTV:CAC Ratio | Business Health Status | What to Do Next |
|---|---|---|
| 1:1 or less | Critical - Unprofitable Model | Freeze acquisition spend immediately. Your only focus should be on optimizing your funnel and crushing churn. Your business is bleeding money with every signup. |
| 2:1 | Marginal - Needs Improvement | You're just barely treading water. It's time to get surgical with your marketing channels. Cut the losers and double down on what's bringing in higher-value customers. |
| 3:1 | Healthy - The Gold Standard | You've built a solid, scalable business model. The game now is maintaining this balance while you carefully test new channels for even more growth. |
| 5:1 or more | Inefficient - Underinvesting in Growth | This might feel great, but a ratio this high often means you're playing it too safe. You likely have a huge opportunity to invest more aggressively in sales and marketing to grab market share. |
The LTV to CAC ratio has been a North Star metric for SaaS growth for over a decade, with 3:1 as the widely accepted target. A SaaS with 100 ARPU, 5% churn, and a lean ****50 CAC could hit an LTV of $2,000—a stunning 40:1 ratio that signals hypergrowth potential. On the flip side, a ratio dipping to 1:1 often spells doom, a story we've seen play out in a significant number of failed startups. You can discover more insights about these SaaS benchmarks and see how they guide real-world strategy.
At the end of the day, your saas lifetime value calculation is only half the story. Pairing it with CAC is what turns a simple metric into a strategic roadmap for building a business that lasts.
Turning LTV Insights Into Product Strategy
Calculating your SaaS lifetime value is a critical first step, but the number itself is useless if it just sits in a spreadsheet. The real magic happens when LTV stops being a backward-looking metric and starts actively shaping your product roadmap.
The goal here is to get ahead of the curve. Instead of just reacting to churn when it's too late, you can start proactively building a product that naturally creates high-value, long-term customers. This means weaving LTV thinking into the fabric of your daily product decisions, connecting customer feedback and usage data directly to revenue.
This whole process boils down to understanding the relationship between what a customer is worth to you and what it costs to get them in the door.
Ultimately, you're looking at the LTV:CAC ratio. This simple number tells you if your business model is sustainable and where you should be investing your resources for growth.
Tying Qualitative and Quantitative Signals Together
To really put LTV to work, your product team needs to get comfortable with two very different types of data. It's the combination of these signals that paints a full picture of customer health and future value.
Qualitative Data: The "Why" Behind User Actions
This is the human side of the story—the voice of your customer. It’s messy, unstructured, but full of crucial context. You’ll find it in places like:
- Support tickets and live chat logs
- Call transcripts from your sales and success teams
- In-app survey responses and open-ended feedback
- Online reviews from G2, Capterra, or social media
This is where you discover why users are getting frustrated, what features they’re begging for, and the specific pain points that are pushing them toward the "cancel" button.
Quantitative Data: The "What" Users Are Actually Doing
This is the hard, cold evidence of how people interact with your product. It’s all about behavior and includes metrics like:
- Feature adoption rates and usage frequency
- Session duration and engagement scores
- Error rates and user-reported bugs
- Upgrade, downgrade, and plan utilization trends
This data shows you what users are actually doing (or not doing). It often reveals friction points and expansion opportunities that customers would never think to tell you about directly.
A Real-World Scenario: From Bug Report to LTV Impact
Let's make this tangible. Imagine a product manager at a B2B collaboration tool, "SyncUp," spots a worrying trend in their product intelligence platform. They see a 15% spike in support tickets coming from their brand-new, high-value "Enterprise" tier. The complaints are all slightly different, but they circle the same issue: a critical file-sharing integration is buggy and unreliable.
This is the qualitative signal. On its own, it’s an annoyance, but it's hard to gauge the true impact.
So, the PM dives into the quantitative data. What they find is alarming. Enterprise accounts that encounter this bug have a 40% higher churn risk within their first 90 days. Even worse, sales reps are reporting that new deals are stalling when prospects test this exact integration. The platform crunches the numbers and quantifies the damage: this one bug is putting over $50,000 in monthly recurring revenue (MRR) at risk.
The insight is crystal clear: This isn't just a bug; it's a direct threat to the LTV of their most valuable customer segment. The problem is no longer a subjective complaint—it has a dollar value attached to it.
Armed with this revenue-backed evidence, the PM can now make a compelling case. They create a Jira ticket, not with a generic title like "Fix integration bug," but with "Urgent: File-sharing bug in Enterprise tier is causing $50k/month churn risk." That gets an engineer's attention.
The fix is prioritized and deployed within a week. Support tickets plummet, and more importantly, the churn rate for new Enterprise customers drops back to a healthy baseline. By connecting a qualitative complaint to quantitative behavior and then to revenue impact, the team didn't just fix a bug—they actively protected and grew their LTV.
The following table breaks down how you can create a repeatable process to turn this kind of insight into action.
From Feedback to LTV Impact: A Practical Workflow
This workflow outlines the actionable steps a product team can take to translate raw customer feedback into measurable LTV improvements using a product intelligence platform.
| Step | Action | Tool/Method | Impact on LTV |
|---|---|---|---|
| 1. Collect | Aggregate customer feedback from all sources (support, sales, surveys). | Product Intelligence Platform (e.g., SigOS), CRM, Help Desk | Identifies raw signals related to user friction or unmet needs. |
| 2. Analyze | Use NLP and trend analysis to surface recurring themes and pain points. | Text analytics, sentiment analysis within the platform. | Pinpoints high-frequency issues that likely affect many users. |
| 3. Quantify | Link qualitative themes to quantitative user behavior and revenue data. | Funnel analysis, cohort analysis, revenue impact models. | Connects a "complaint" to a specific dollar amount at risk (churn, lost expansion). |
| 4. Prioritize | Rank issues on the product roadmap based on their quantified LTV impact. | Jira/Asana integration, custom scoring (e.g., RICE with a revenue component). | Ensures engineering resources are focused on the most financially impactful work. |
| 5. Act & Measure | Develop and ship the fix/feature, then monitor the same metrics to confirm impact. | A/B testing, post-release cohort monitoring. | Validates the solution and directly measures the lift in retention, expansion, and LTV. |
By building this muscle, you move from a reactive "whack-a-mole" approach to a strategic, data-informed process that systematically improves your product's value.
Understanding these signals is just the beginning; you also need to track the right outcomes. You can learn more about the core customer retention metrics that tie directly into this process.
Once you’ve calculated LTV and identified the drivers, the next step is to put that knowledge to work. For a deeper look at proven strategies for increasing Customer Lifetime Value, it’s worth exploring frameworks that turn these ideas into concrete actions. This is how you shift from simply measuring LTV to actively managing and growing it as a core business function.
Common LTV Calculation Mistakes and How to Avoid Them
Even with the right formulas in your back pocket, a few common mistakes can make your SaaS lifetime value calculation completely unreliable. Getting this right is all about precision. Avoiding these classic traps ensures your LTV is a trustworthy guide for big decisions, not just a misleading vanity metric.
One of the biggest errors I see teams make is ignoring customer segmentation. Lumping every single customer—from a small business on your entry-level plan to a massive enterprise client with a custom contract—into a single ARPU and churn calculation is a recipe for disaster. This kind of blended average hides the most important truths about your business.
Think about it: your high-value enterprise accounts might be rock-solid with near-zero churn, while your self-serve segment is bleeding customers every month. A single blended number completely masks the stability of one segment and the five-alarm fire happening in the other.
The Dangers of Ignoring Profitability
Another major pitfall is calculating LTV based on revenue instead of gross margin. That top-line revenue figure looks great on a slide, but it doesn't account for the very real costs of actually serving your customers—things like hosting fees, third-party data services, and the salaries for your customer support team.
Forgetting to subtract these costs of goods sold (COGS) will dramatically inflate your LTV, giving you a dangerous sense of security. This is how companies end up wildly overspending on customer acquisition; their LTV-to-CAC ratio looks way healthier than it actually is. You should always use a margin-adjusted LTV for any decision that involves your budget.
A flawed LTV calculation is worse than no calculation at all. It encourages you to pour money into the wrong channels, prioritize the wrong features, and fundamentally misunderstand the health of your business model.
Practical Steps for a More Accurate LTV
To sidestep these issues, you need to get more granular and always keep profit in mind. Here's a better way to approach it:
- Segment Ruthlessly: Start calculating LTV for different customer segments. You can group them by plan type, the channel they came from, or even by company size. This is how you'll uncover which customer groups are your cash cows and which are a drain on resources.
- Embrace Gross Margin: Make this a non-negotiable step. Get with your finance team to nail down an accurate COGS figure for each of your key customer segments.
- Use Cohort Analysis for Churn: Ditch the single, blended churn rate. Instead, use cohort analysis to track the retention of specific groups of customers who signed up around the same time. This gives you a much clearer, more honest picture of long-term loyalty.
Common Questions About SaaS LTV
Even with the right formulas in hand, a few questions always pop up when you start putting LTV into practice. Let’s tackle some of the most common ones I hear from SaaS leaders who are getting serious about this metric.
How Often Should We Be Calculating LTV?
I generally recommend a monthly or quarterly rhythm. Running the numbers monthly gives you a real-time pulse on your business, helping you catch subtle shifts in churn or average revenue before they become major problems. A quarterly calculation is perfect for stepping back, looking at the bigger picture, and preparing for board meetings or strategic planning sessions.
That said, don't just wait for the calendar. Certain events should trigger an immediate recalculation.
- You just changed your pricing. This is a no-brainer. Your ARPU is different now, so your LTV will be too.
- A new product or major add-on just launched. This introduces new expansion revenue streams that need to be factored into your models.
- You're targeting a new customer segment. If you've shifted focus, the LTV of your new user base will almost certainly differ from your historical average.
What’s a Good LTV for a SaaS Business?
This is the classic "it depends" question, but for a good reason. There's no magic number. A 500 LTV could be phenomenal for a self-serve product with a super-efficient, low-cost acquisition model. On the flip side, a ****50,000 LTV could signal serious trouble if your enterprise sales cycle is long and burns through cash.
The real answer isn't about LTV in a vacuum; it’s about its relationship with your Customer Acquisition Cost (CAC). The LTV:CAC ratio tells the true story of your business's health. You're aiming for a 3:1 ratio as a baseline for a sustainable model. For every dollar you spend to win a customer, you should be getting at least three dollars back over their lifetime.
How Can We Calculate LTV for a Brand-New Product?
Calculating LTV without a history of paying customers feels like guesswork, but you can make some very educated guesses. For a new product, you'll have to lean on predictive models built from early signals and market comps.
Start with your beta users. What does their initial engagement look like? Are they adopting the sticky features? This early usage data can help you build your first churn prediction. From there, look at publicly traded SaaS companies in your space. You can often find benchmark data on their ARPU and churn rates to create a reasonable starting point for your own LTV forecast. It won't be perfect, but it's a hell of a lot better than flying blind.
By transforming qualitative feedback into actionable, revenue-driving insights, SigOS empowers product teams to reduce churn, accelerate expansion, and build features customers actually use. Discover how SigOS can help you prioritize your roadmap with revenue impact.


Ready to find your hidden revenue leaks?
Start analyzing your customer feedback and discover insights that drive revenue.
Start Free Trial →