Behavioral Analytics Software for Product Teams
Discover how behavioral analytics software transforms SaaS product intelligence. Learn to predict churn, prioritize features, and drive revenue with SigOS.
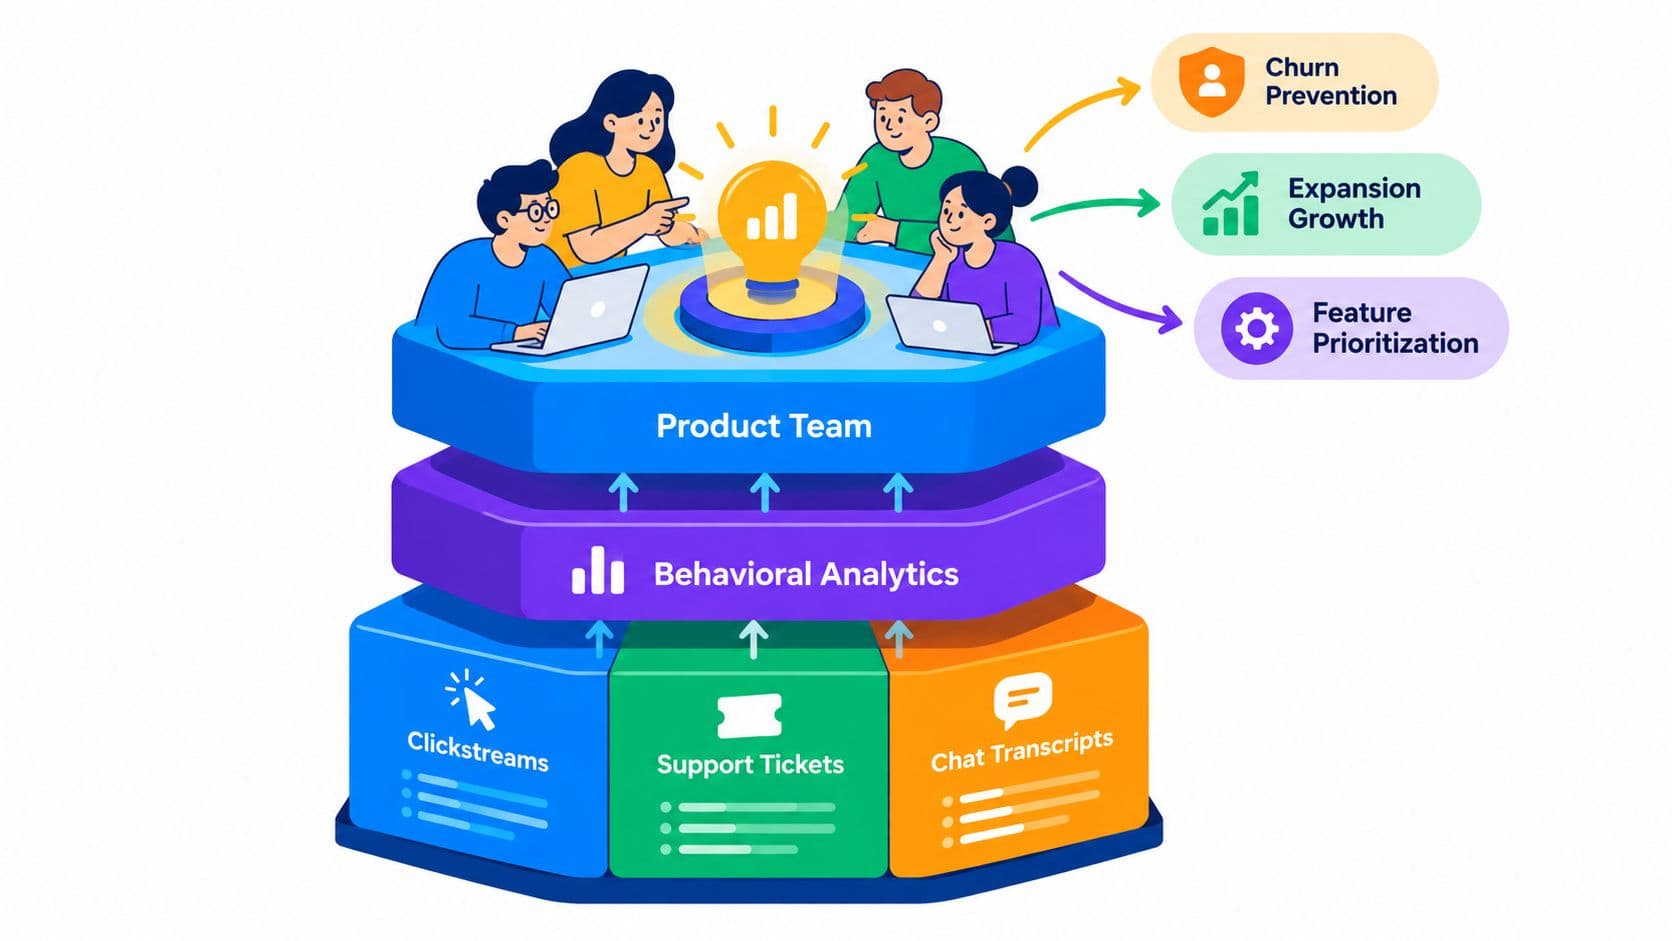
More clickstream data doesn't automatically produce better product decisions. It often produces more dashboards, more arguments about metric definitions, and more time spent explaining what happened after the revenue impact is already visible. A funnel can show where users leave. It can't, by itself, tell you whether they encountered a confusing workflow, a product defect, missing capability, or a support issue that changed their intent.
Behavioral analytics software matters when it connects those events to customer context and business outcomes. The useful question isn't only whether an account used a feature. It's whether a sequence of behaviors, combined with support conversations and account history, signals churn, expansion, or a product investment worth prioritizing.
The Limits of Traditional Product Analytics
Traditional product analytics is excellent at description. It can show page views, event counts, conversion paths, retention cohorts, and feature adoption. Those views are useful, but they leave a dangerous gap between observation and explanation. A dashboard may show that onboarding completion weakened or that a high-value account stopped using a core workflow. It rarely identifies the underlying reason without manual investigation.
The popular advice is to instrument everything. That sounds rigorous, yet indiscriminate tracking creates its own failure mode. Product teams inherit inconsistent event names, duplicate properties, missing context, and dashboards that answer narrow questions while obscuring the larger customer journey. Analysts then spend their time reconciling data instead of helping teams decide what to fix.
Practical rule: Track the behaviors that relate to a customer outcome, not every interaction a product can technically record.
Why the “why” stays hidden
A support ticket may describe a broken export. Usage data may show that the customer attempted the export repeatedly, abandoned it, and then stopped using adjacent features. A conventional dashboard treats those as separate records. An analyst must manually connect the ticket, the account, the session pattern, and the commercial value.
That manual synthesis doesn't scale well across product, customer success, sales, and engineering. It also creates a bias toward whatever question someone remembered to ask. If the team didn't define an event for a meaningful behavior, many event-based tools can't reconstruct the pattern later. The result is an illusion of precision, where clean charts encourage confident decisions built on incomplete context.
Dynamic behavioral signals provide a stronger foundation for churn analysis than static demographic details. In an MIT study of financial churn, diversity and regularity in spatio-temporal activity, along with the entropy of financial choices, were more predictive than demographic features, because activity sequences captured how customers behaved over time rather than merely who they were on paper. The MIT study supports a practical product lesson: behavioral change is often more informative than customer profile data.
From vanity metrics to revenue context
A feature can have strong usage and still fail to create value. Another feature can have modest usage but sit inside a workflow that determines renewal or expansion. Product teams need behavioral analytics that connects actions to outcomes, then brings in qualitative evidence to explain the difference.
That shift changes the operating question from “Which buttons get clicked?” to “Which customer behaviors precede value, friction, risk, or commercial opportunity?” Raw event data is the input. Actionable revenue insight is the product.
Core Capabilities and Data Inputs
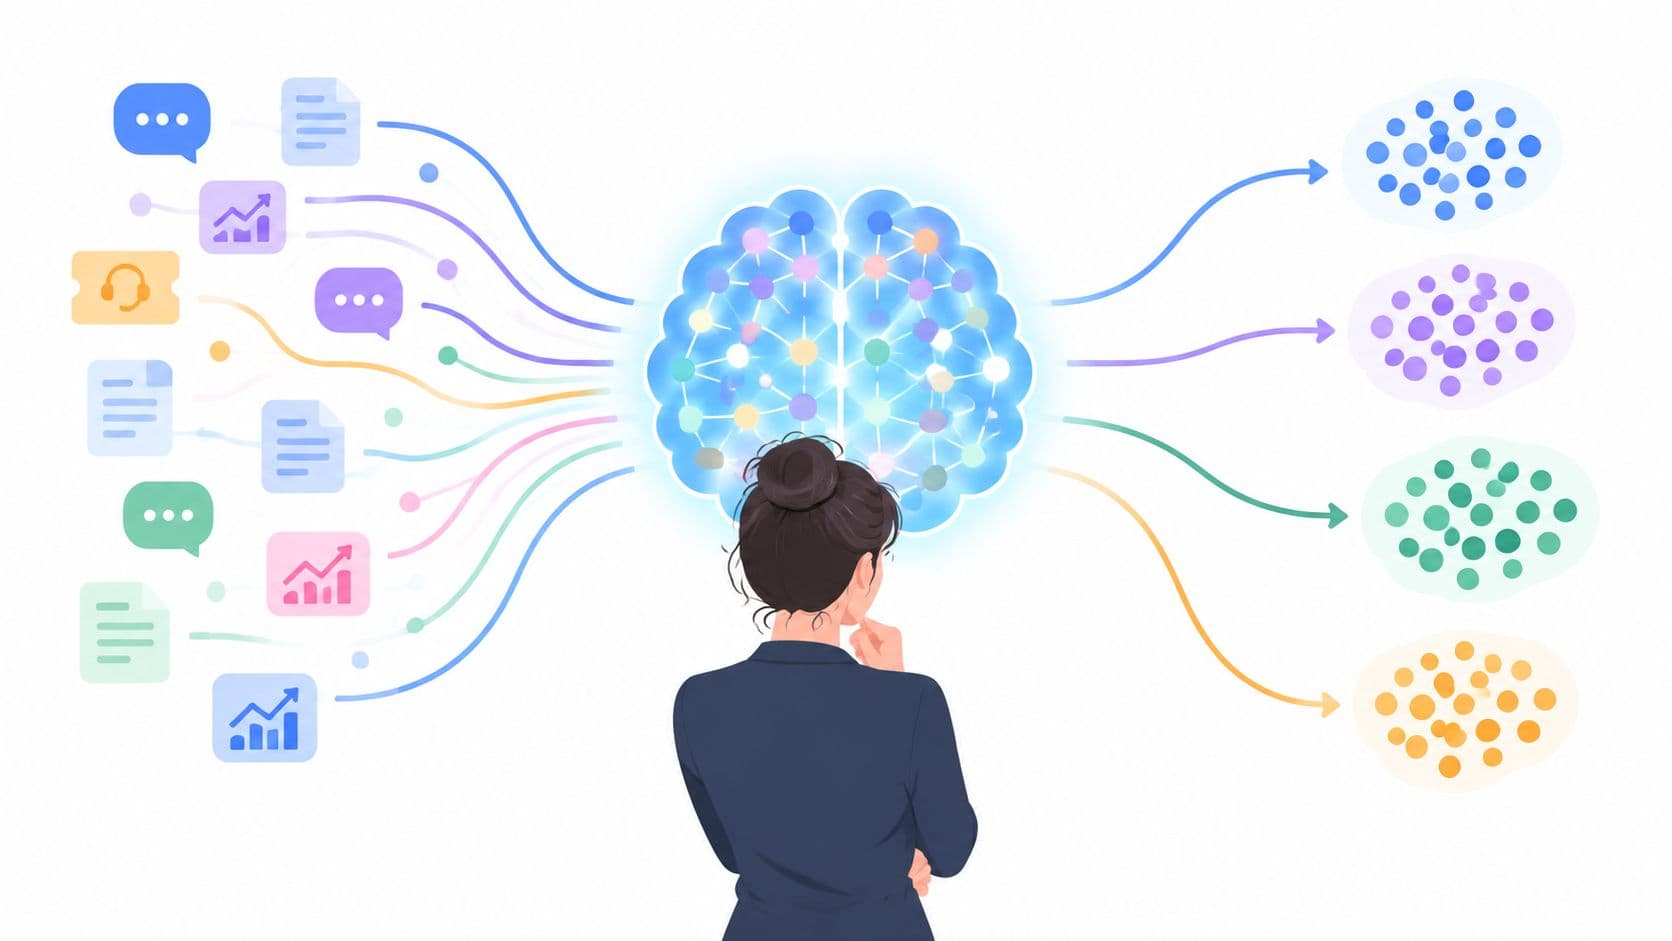
Modern behavioral analytics software starts with event data, but it shouldn't stop there. A mature platform combines quantitative usage signals with account attributes, CRM history, support conversations, sales context, and qualitative feedback. This lets teams examine not only what users did, but also what they were trying to accomplish and what prevented them from succeeding.
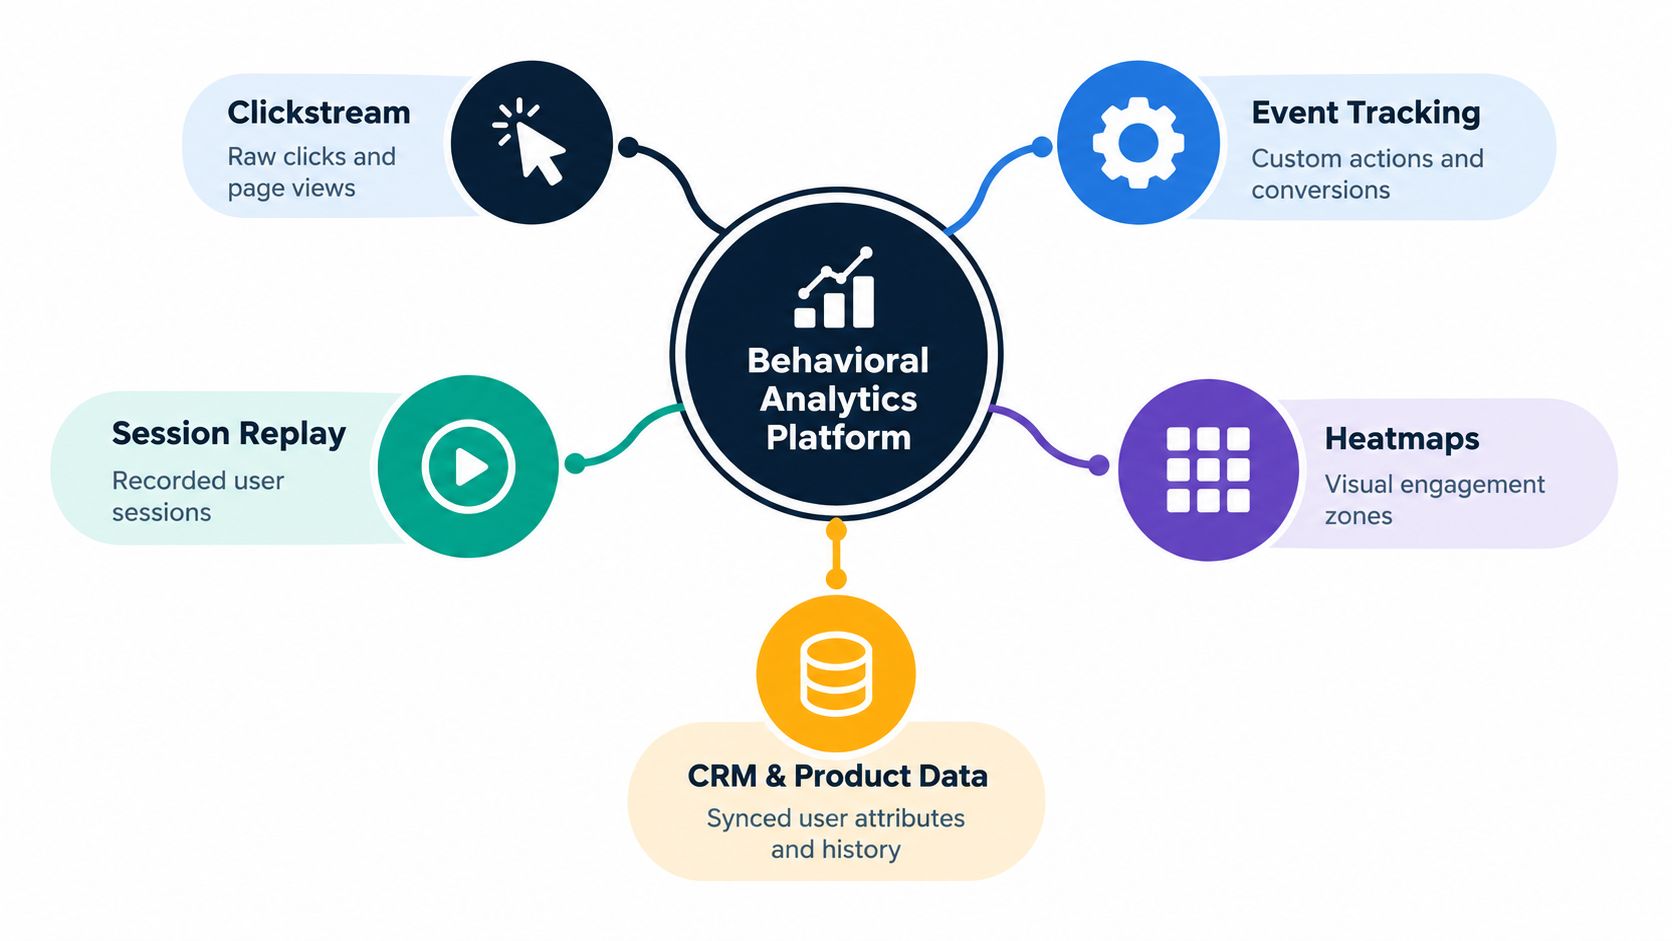
The architecture usually has four layers. First, collection captures clickstream activity, custom events, session behavior, and product states. Second, identity resolution connects actions to users, accounts, workspaces, and segments. Third, analysis detects sequences, changes, friction, and correlations. Finally, an intelligence layer translates those patterns into prioritized actions, such as investigating a workflow, contacting an account, or creating an engineering issue.
The data model behind useful insight
Clickstream and event tracking provide the measurable sequence. Session replay and heatmaps add interaction context, helping teams see hesitation, repeated attempts, or dead ends. CRM and product data add account size, plan, lifecycle stage, ownership, and commercial history. Support tickets, chat transcripts, and sales calls add intent and language that usage events can't provide.
The value comes from correlation rather than accumulation. A platform might connect a failed setup event with a cluster of support complaints, declining activity, and an open renewal. That combined pattern is materially more useful than a dashboard showing the setup event alone.
Teams designing this architecture should treat multi-source data integration as an operating requirement, not a later enhancement. If customer data remains split across the helpdesk, warehouse, CRM, and issue tracker, someone still has to perform the synthesis manually.
What AI should do with the inputs
AI adds value when it reduces the distance between evidence and action. It should group related feedback, identify recurring behavioral patterns, recognize meaningful changes over time, and explain which customer segments are affected. It should also preserve the underlying evidence, so a product manager can inspect the sessions, events, tickets, or account records behind an alert.
A useful workflow might look like this:
- Collect: Capture product events, session context, support records, and account attributes.
- Normalize: Resolve identities, standardize event definitions, and remove duplicate or low-value records.
- Correlate: Link qualitative complaints to behavioral changes and customer outcomes.
- Prioritize: Rank issues by affected users, account importance, urgency, and revenue relevance.
- Activate: Send a clear recommendation to the responsible team or system.
For teams that still rely on classic funnel views, well-designed funnel report dashboards remain useful for locating drop-off. They become considerably more valuable when another system explains the customer context behind that drop-off and routes the finding into a decision workflow.
High-Impact Business Use Cases
Behavioral analytics earns budget when it changes a commercial decision. Three workflows consistently expose the difference between descriptive reporting and product intelligence: preventing churn, finding expansion readiness, and prioritizing product work.
Churn prediction based on changing behavior
A customer rarely announces churn through one isolated event. Risk often emerges as a sequence: fewer sessions, incomplete workflows, repeated errors, declining breadth of usage, and support conversations that remain unresolved. The strongest signal may be the change from a customer's normal pattern, not a universally low activity level.
Consider an account that historically uses reporting, exports data, and invites colleagues. Its recent activity shows repeated export attempts, fewer completed reports, and a support conversation about missing functionality. A basic dashboard may display declining feature usage. A behavioral model can connect the sequence, identify the affected account, and give customer success a reason to intervene with a focused conversation.
Temporal modeling is especially important because churn risk changes over time. A rolling-window churn framework reported 87.6% accuracy and 0.94 ROC-AUC for a feature-based model, while a sequence-based model reached 96.1% recall by capturing disengagement patterns over time. On unseen future data without retraining, performance remained above 83% accuracy and 0.91 ROC-AUC. The rolling-window research provides evidence for using sequences rather than treating customer risk as a static label.
Expansion signals hidden in usage and feedback
Expansion doesn't always begin with a request for a larger plan. It can appear as users reaching product limits, multiple teams adopting the same workflow, administrators asking about governance, or sales calls describing a broader operational need. Support data may reveal that a customer is trying to use a capability outside its current plan, while usage data shows growing dependency on the surrounding workflow.
A revenue team can combine those signals into an account-level opportunity view. Instead of sending a generic upsell campaign to every active customer, it can identify accounts whose behavior indicates broader adoption or unmet demand. The account executive gets a concrete reason to start the conversation, and product receives evidence about which capability is creating commercial pressure.
Prioritizing bugs and feature requests
Roadmap debates often overvalue the loudest request. Behavioral analytics changes the discussion by attaching feedback to affected workflows and account outcomes. A bug reported by one user might affect a critical path for valuable accounts. A popular feature request might receive frequent mentions but have little connection to retention, expansion, or successful onboarding.
A practical prioritization record should include:
- Affected behavior: What users attempted, completed, repeated, or abandoned.
- Customer context: Which segments, plans, industries, or accounts experienced the issue.
- Qualitative evidence: What customers said in tickets, calls, chats, or interviews.
- Commercial relevance: Which renewal, expansion, activation, or adoption outcome may be affected.
- Recommended action: Fix, investigate, educate, redesign, or validate with a targeted experiment.
This approach doesn't turn every decision into a perfect financial forecast. It creates a defensible ranking that product, engineering, sales, and customer success can share. Teams stop asking which stakeholder feels most strongly and start asking which intervention addresses the clearest combination of customer pain and business value.
Traditional Dashboards Versus AI Product Intelligence
Traditional analytics tools and AI product intelligence platforms solve different problems. Event analytics gives teams flexible exploration. Analysts define segments, build queries, inspect funnels, and interpret the results. That model works when the organization has clean instrumentation, available analysts, and enough time to investigate each question.
The limitation appears when evidence is distributed across systems. A dashboard doesn't automatically read a support ticket, compare it with account behavior, estimate the commercial consequence, and create a well-scoped issue for engineering. Someone has to perform those steps, often after a customer has already escalated the problem.
AI product intelligence adds an interpretation and activation layer. Platforms such as SigOS ingest usage metrics alongside support and sales signals, identify relationships between feedback and behavioral change, and connect findings to revenue impact. Its documented workflow includes integrations with tools such as Zendesk, Intercom, Linear, Jira, and GitHub, allowing teams to move from observed signal to issue creation without rebuilding the analysis manually.
A practical comparison
| Feature | Traditional Analytics | AI Product Intelligence, for example SigOS |
|---|---|---|
| Primary output | Funnels, cohorts, charts, and queried reports | Prioritized insights, alerts, and recommended actions |
| Data scope | Mostly structured product and event data | Product behavior combined with qualitative customer signals |
| Investigation | Analysts manually connect related evidence | AI groups patterns and surfaces relationships for review |
| Time horizon | Often retrospective and query-driven | Continuous monitoring for emerging changes |
| Revenue context | Added manually through account analysis | Incorporated into issue and opportunity prioritization |
| Workflow | Insight may remain inside the dashboard | Findings can flow into support, product, and engineering systems |
| Best fit | Exploratory analysis and metric reporting | Cross-functional action around customer and commercial outcomes |
The comparison doesn't mean dashboards are obsolete. Product teams still need reliable funnels, retention reports, cohort analysis, and experimentation measurement. The question is whether those reports are the final destination or the evidence layer for a system that helps people act.
Teams evaluating the shift should also examine automated insight generation. Automation only helps when the platform explains why a pattern matters, shows the supporting evidence, and gives an accountable team a next step. A stream of unprioritized AI summaries creates another inbox.
Selection Criteria for SaaS Product Teams
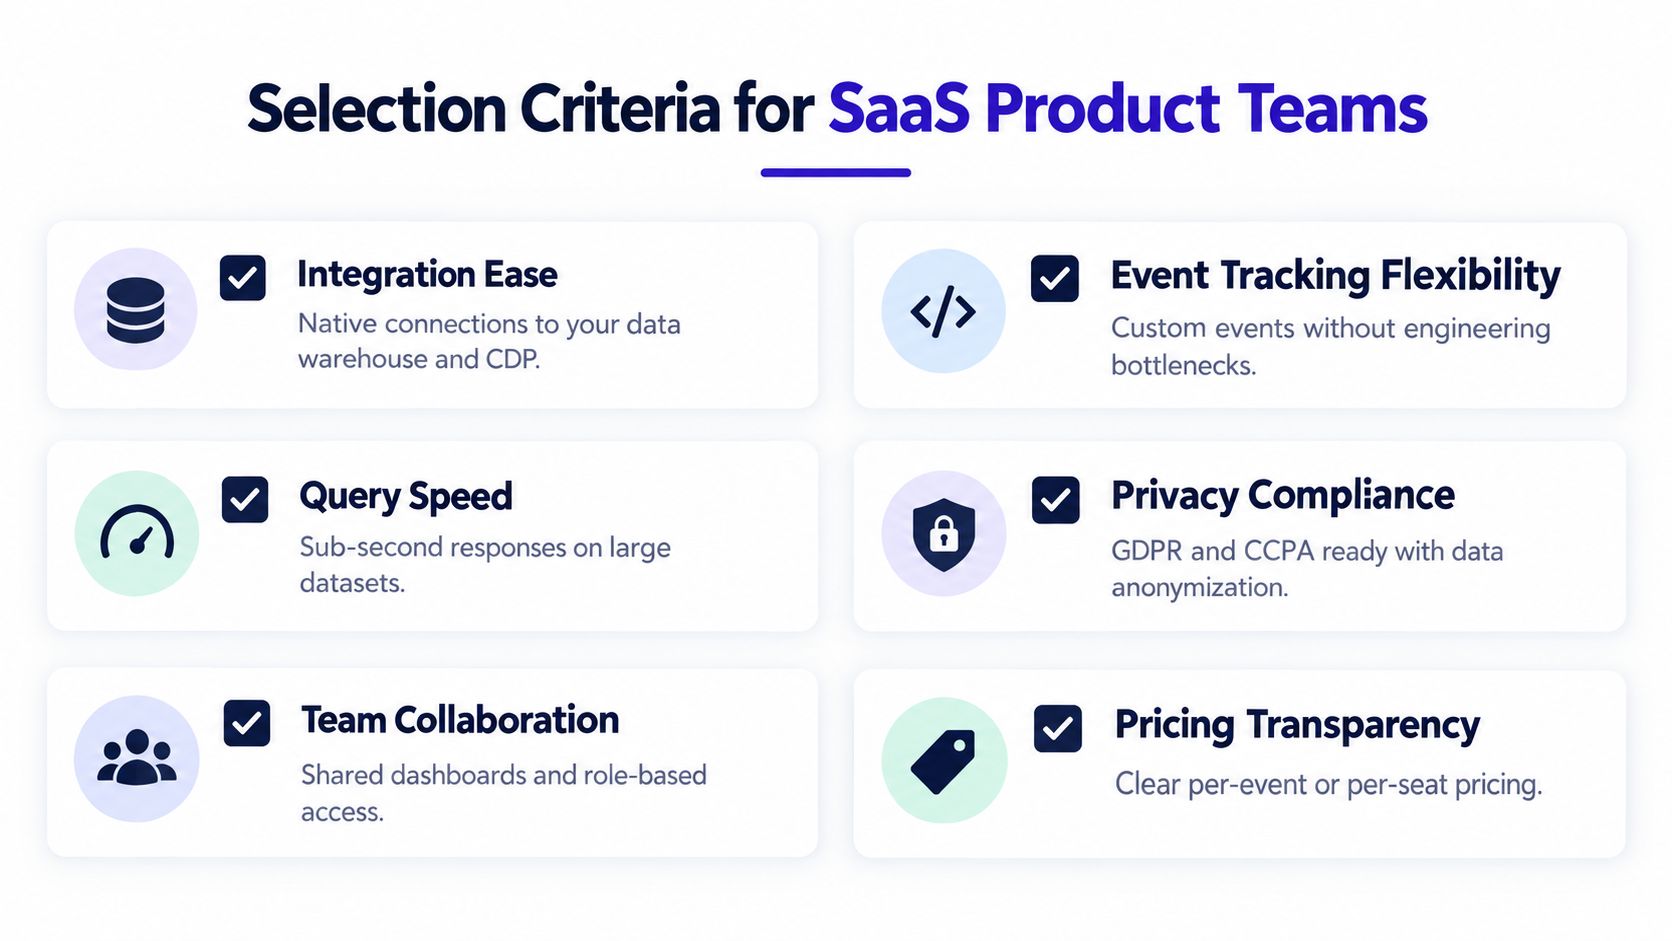
Choosing behavioral analytics software requires testing the path from data capture to action. A polished demo can hide weak integrations, incomplete identity resolution, slow analysis, or privacy practices that don't match your operating environment. Product leaders should evaluate the full workflow with their own representative data whenever possible.
Start with the systems that already contain customer truth. The platform should connect with the CRM, helpdesk, issue tracker, warehouse, and product instrumentation layer. A shallow connector that imports only summaries won't support reliable account-level analysis.
Evaluate the decision workflow
Use a structured evaluation rather than scoring features in isolation:
- Trace one real issue: Start with a known support problem. Can the platform connect the complaint to user behavior, affected accounts, and product impact?
- Test an emerging pattern: Provide recent usage and feedback data. Can the system identify a meaningful change without an analyst constructing every query?
- Inspect the evidence: Require links or references to the events, conversations, and account records supporting each conclusion.
- Measure time to insight: Test how quickly a product manager can move from question to usable finding. Real-time or near-real-time analysis matters when a new defect is increasing churn risk.
- Check revenue attribution: Ask whether the platform can distinguish a high-value workflow issue from a low-consequence usability complaint.
- Validate activation: Confirm that the result can create or update work in Jira, Linear, GitHub, or the team's existing system without losing context.
Don't ignore operating cost
The license isn't the total cost. Include instrumentation maintenance, integration work, identity cleanup, privacy review, analyst dependency, and the time required to train non-technical users. A platform that requires constant specialist intervention may be less useful than a narrower tool that teams can operate every day.
Ask vendors how models are maintained, how false positives are reviewed, and what happens when product behavior changes. You want continuous analysis without turning every model update into a data science project. You also want transparent controls for access, retention, data export, and deletion before procurement signs off.
Navigating Privacy and Data Minimization
Behavioral analytics becomes more valuable as it becomes more detailed, but richer data can increase privacy risk. Support tickets, chat transcripts, sales calls, identifiers, and event properties may contain personal or commercially sensitive information that the product team never needed for its original question.
The right objective isn't maximum collection. It's sufficient context with controlled exposure. Recent privacy guidance recommends logging only what a team needs, dropping or transforming unnecessary fields, using short-lived or randomized identifiers, and avoiding personal data in URLs or event properties. The privacy-preserving product analytics guidance highlights the data-minimization gap that teams often overlook when implementing product analytics.
Design the collection boundary
Before sending an event, define its purpose and the decision it supports. If a team needs to know that a user submitted an export request, it may not need the full contents of the exported file. If an account needs a friction signal from a support conversation, it may not need unrestricted access to every personal detail in the transcript.
Practical controls include:
- Field minimization: Collect only properties required for analysis and remove sensitive payloads.
- Transformation: Hash, tokenize, redact, or aggregate fields where raw values add no decision value.
- Identifier discipline: Use controlled identifiers that support account linkage without exposing personal information.
- Access boundaries: Separate product insight access from unrestricted customer records.
- Retention controls: Keep detailed session and conversation data only as long as the use case requires.
- Auditability: Record who can view, export, or modify sensitive behavioral data.
Encryption protects data in transit and at rest, but it doesn't make unnecessary collection acceptable. Teams should also ask whether a vendor uses customer data to retrain shared models, how deletion requests propagate, and whether administrators can configure masking before capture.
A clear governance model helps preserve predictive value without turning behavioral analytics into a surveillance system. For implementation detail, the data privacy and compliance guidance from SigOS offers a useful checklist for product and technical leaders reviewing controls.
Building a Revenue-Driven Product Culture
Software can't create alignment if teams still reward output over outcomes. Product, support, success, sales, and engineering need a shared view of which customer behaviors matter, which problems recur, and which fixes affect commercial results.
A revenue-driven operating rhythm starts with daily signal review and weekly decision discipline. Product leaders can review the highest-impact behavioral changes, customer success can examine accounts showing risk or expansion readiness, and engineering can inspect issues ranked by affected workflows and customer value. Support leaders can use the same evidence to distinguish documentation gaps from product defects.
The strongest roadmap discussion is not “Who asked for this?” It's “Which customer behavior and business outcome does this change address?”
AI-generated dashboards can support that rhythm, but teams still need judgment. They should challenge weak evidence, speak with customers, test interventions, and measure whether behavior changes after shipping. Behavioral analytics software doesn't replace discovery or strategy. It gives those activities a more reliable starting point than isolated anecdotes or vanity metrics.
The cultural shift is straightforward: stop treating feedback as a queue of opinions and start treating it as evidence connected to behavior and outcomes. When teams can see why customers struggle, which accounts are changing, and where revenue is exposed, they can reduce reactive work and make product priorities easier to defend.
SigOS connects usage metrics with support tickets, chat transcripts, sales calls, and revenue context to surface behavioral patterns linked to churn, expansion, and product impact. Visit SigOS to see how continuous AI-driven product intelligence can turn scattered customer signals into prioritized actions for your product, growth, and customer success teams.
Ready to find your hidden revenue leaks?
Start analyzing your customer feedback and discover insights that drive revenue.
Start Free Trial →