Signal Feature Extraction That Turns Noise Into Revenue
Learn signal feature extraction techniques, implementation patterns and metrics to turn product feedback into churn and expansion signals.
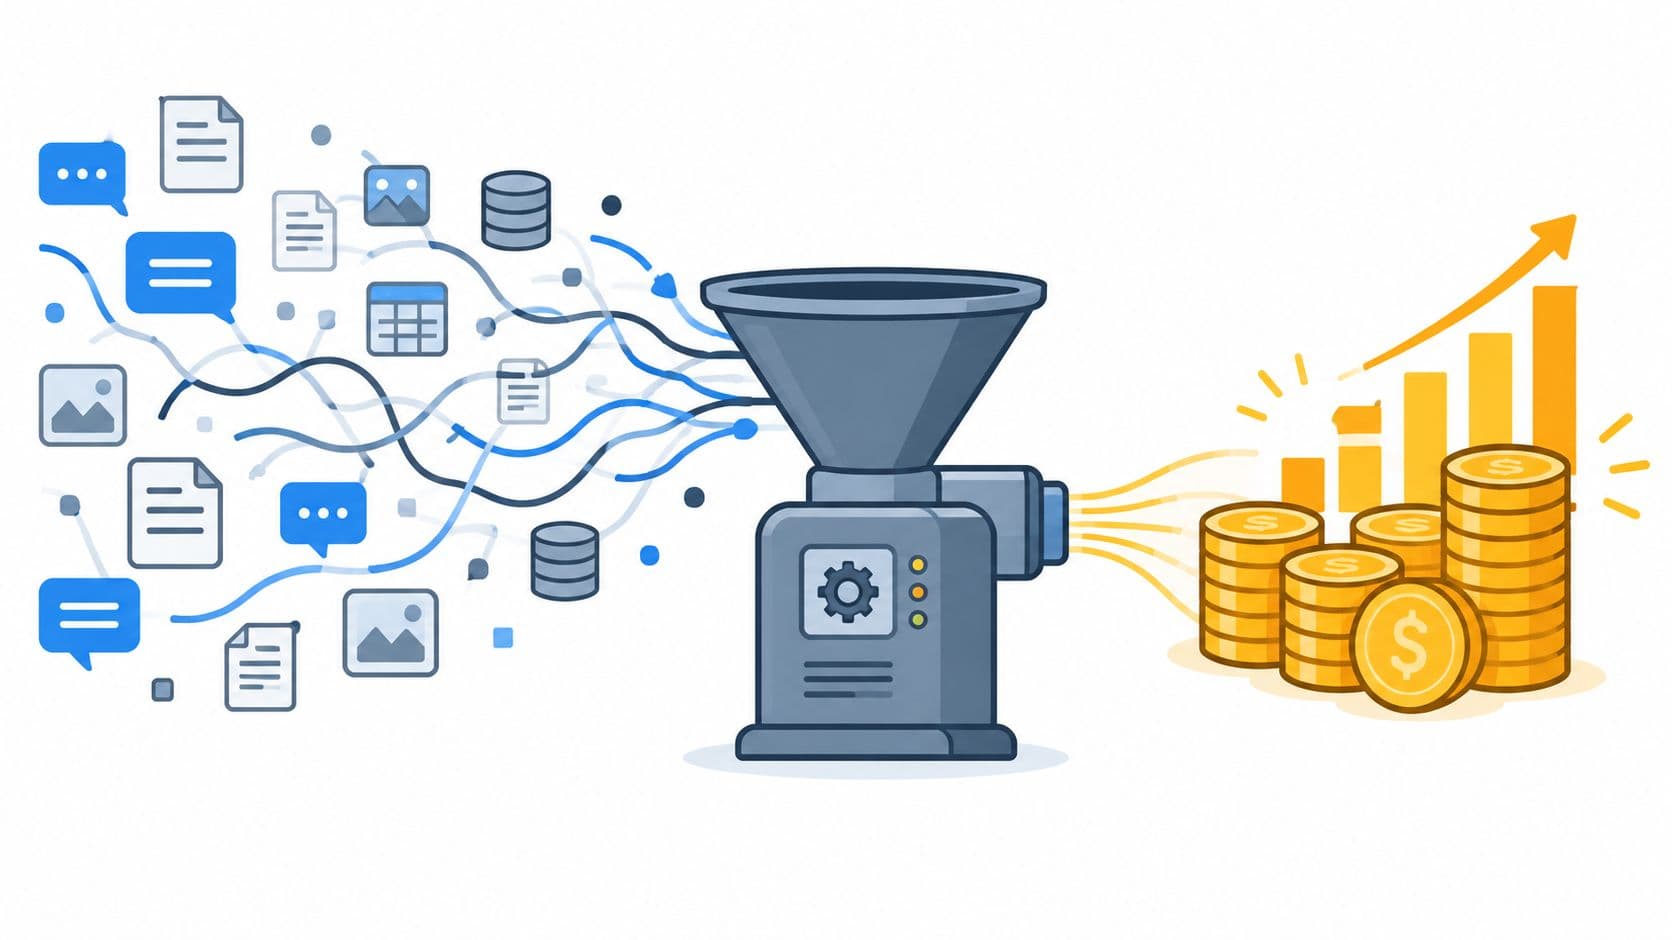
A product team can have thousands of support tickets, chat messages, sales-call transcripts, and usage events, yet still struggle to answer a basic question: what should we do next to protect revenue? Every data source contains useful evidence, but the evidence arrives in different formats, at different speeds, and with different levels of noise. A sudden drop in usage may indicate churn risk, or it may reflect a seasonal workflow. A repeated feature request may signal frustration, or it may reveal an expansion opportunity.
Signal feature extraction creates the translation layer between those raw observations and an actionable decision. It turns waveforms, text, event streams, and behavioral histories into compact features that analysts, models, and product teams can evaluate. The technical method matters, but the commercial question matters more: does the extracted feature remain reliable enough to influence retention, roadmap priority, or expansion planning?
Why Product Teams Drown in Signals Without Extraction
A SaaS product team starts Monday with a familiar pile of evidence. Support has tagged several tickets as “performance,” sales has forwarded call notes mentioning missing workflow controls, customer success has noticed lower engagement from a few accounts, and the product analytics dashboard shows hundreds of thousands of events. Each item looks important in isolation. Together, they create uncertainty rather than clarity.
The problem isn't a lack of data. It's the absence of a shared representation. “Customers are frustrated” is too broad to prioritize. A usable feature might be the change in unresolved ticket volume, the frequency of a workflow abandonment, or the recurrence of a pricing objection in qualified conversations. Those representations allow a team to connect customer behavior with an outcome such as renewal risk or account expansion.

The cost of leaving meaning buried
Without extraction, product managers often use volume as a proxy for importance. The loudest ticket queue wins. The most recent sales request gets discussed in the roadmap meeting. A high-traffic feature receives attention even when its usage doesn't connect to customer value.
That approach creates two kinds of waste:
- Missed retention signals: A gradual decline in a key workflow can disappear inside aggregate usage totals.
- Hidden expansion signals: Similar requests across sales calls may remain scattered across transcripts instead of becoming a coordinated commercial opportunity.
- Unclear ownership: Support, success, product, and revenue teams may describe the same customer problem with different labels.
- Slow response: Analysts spend time cleaning and interpreting evidence before anyone can act on it.
The distinction between useful evidence and irrelevant variation is often described through the signal-to-noise ratio in product and data analysis. Extraction improves that ratio by preserving patterns that answer a defined question and reducing details that don't help the decision.
Treat extraction as a decision layer
A feature becomes commercially useful when someone can connect it to an action. For example, a support-text feature might identify a recurring integration blocker, while a usage feature might indicate that affected accounts are abandoning a valuable workflow. Together, those features can support targeted outreach, a bug-fix decision, or a roadmap change.
The same logic applies beyond product telemetry. Teams evaluating buying signals are already looking for meaningful changes in customer language and behavior. Signal feature extraction formalizes that practice, turning scattered observations into evidence that can be monitored and compared.
Practical rule: Don't ask which data source contains the most information. Ask which extracted feature can change a revenue decision.
What Signal Feature Extraction Really Means
Start with a simple analogy. A raw signal is like a long recording of a busy room. It contains voices, pauses, background noise, and repeated phrases. A feature is the part you measure because it helps answer a question, such as how often a customer mentions a blocked workflow or how sharply usage changes after onboarding.
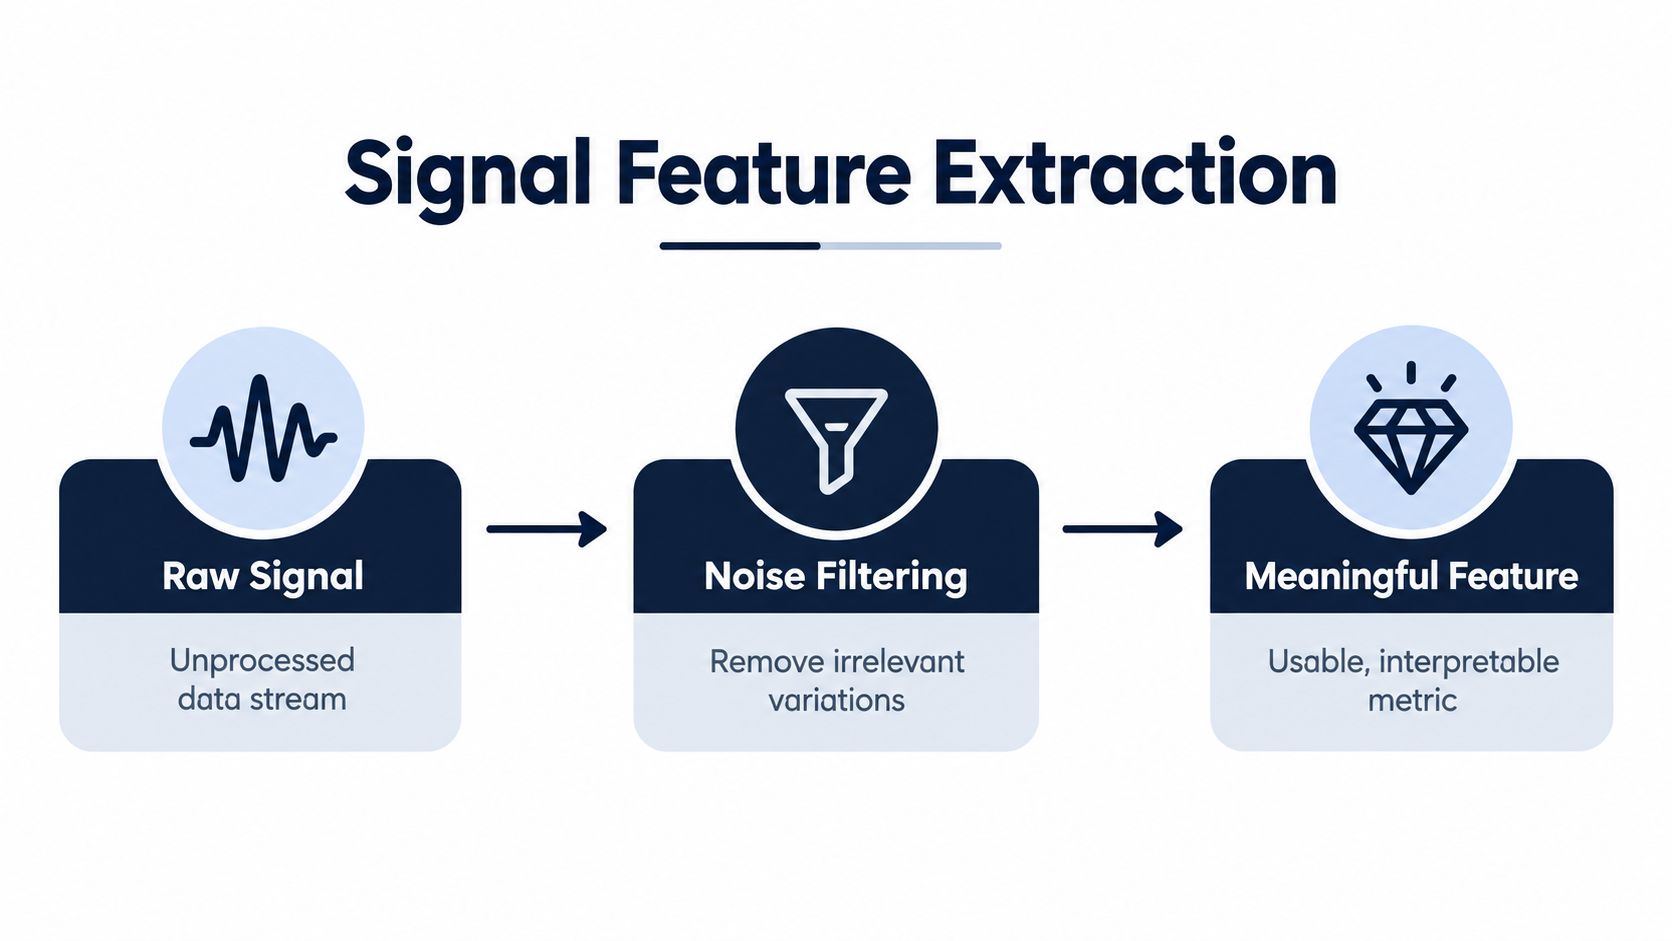
In technical terms, signal feature extraction transforms raw observations into a smaller representation that preserves useful structure. The input might be a sensor stream, a time series, a transcript, or a sequence of product events. The output might be a statistical descriptor, a frequency measure, a text topic, or a learned embedding.
Raw data, signals, and features
These terms are related, but they aren't interchangeable.
- Raw data is the unprocessed observation, such as an event record, audio waveform, transcript, or sensor reading.
- A signal is an organized stream whose changes may carry information. Product usage over time is a behavioral signal. A conversation is a language signal.
- A feature is a measurable representation extracted from that signal, such as variance, spectral power, phrase frequency, sentiment-related language, or workflow completion rate.
Raw signals often fail as direct model inputs because they contain irrelevant variation, inconsistent timing, missing values, and redundant information. A model may technically accept the data while learning patterns that don't generalize. A human analyst faces a similar problem when a dashboard contains every event but no meaningful summary.
The historical foundation
Feature extraction didn't begin with neural networks. Classical signal processing established a durable toolkit that includes Fourier analysis, windowed Fourier transforms, wavelets, PCA, and ICA. These approaches became standard teaching material in pattern recognition and machine vision by the early 2000s, as documented in the MIT OpenCourseWare pattern recognition lecture notes.
PCA preserves directions of maximum variance, which makes it useful for compressing high-dimensional data. ICA instead targets statistically independent components, helping analysts separate mixed sources. After 2012, learning-based extraction became increasingly important, particularly in vision and later in time-series analysis. Modern workflows combine these traditions with models that learn representations directly from data.
The important product lesson is that extraction isn't merely cleanup before analysis. It's where the team decides what a change in behavior means, which evidence deserves attention, and how raw customer activity becomes a decision variable.
Core Techniques That Turn Raw Signals Into Usable Features
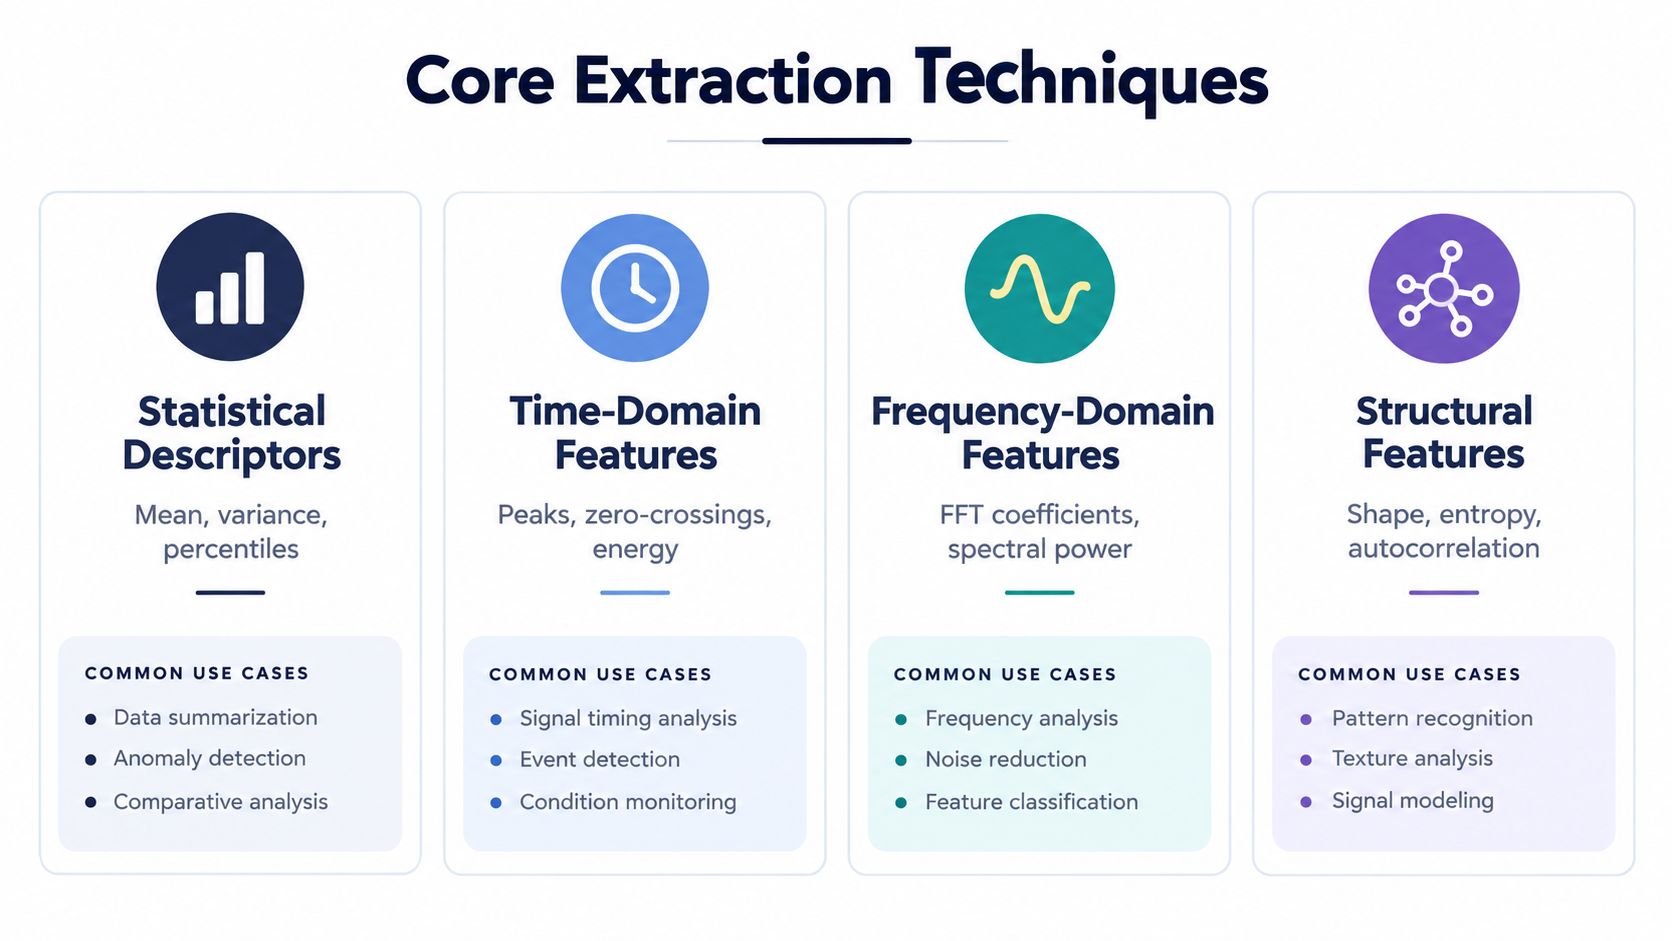
Different extraction families reveal different properties of a signal. Statistical descriptors summarize distribution, time-domain features capture behavior across time, frequency-domain features expose periodic structure, and structural or learned representations describe relationships that simple summaries may miss.
A 2022 study on vibration-based bearing fault diagnosis grouped digital signal processing features into time-domain statistical features, Fourier-domain statistical features, and power spectral density features in its Sensors publication. The same decision logic applies to product data. Choose the representation that matches the business question instead of defaulting to the most advanced method.
| Technique family | What it captures | Best for |
|---|---|---|
| Statistical descriptors | Mean, variance, standard deviation, skewness, kurtosis, and related distribution properties | Stable summaries of usage, latency, ticket volume, or sensor behavior |
| Time-domain features | Peaks, duration, derivatives, areas, rising and falling behavior, and event order | Detecting bursts, drop-offs, workflow friction, and transient changes |
| Frequency-domain features | Fourier coefficients, spectral power, and periodic patterns | Finding cycles, repeated activity, oscillation, or recurring operational behavior |
| NLP features | Terms, topics, entities, intent, sentiment-related language, and phrase relationships | Structuring support tickets, calls, surveys, and sales conversations |
| Embedding-based representations | Dense representations of semantic or behavioral similarity | Finding related requests and patterns when wording or event sequences vary |
Statistical descriptors
Statistical features are often the strongest starting point because they're compact and easy to explain. Mean and variance describe a baseline and its spread. Skewness and kurtosis reveal whether behavior is uneven or concentrated around unusual events. Spectral measures add information about patterns that aren't visible in a simple average.
For product teams, these features can summarize account-level activity, response delays, error frequency, or changes in support demand. They won't explain every cause, but they give models and analysts a stable surface for comparison.
Time and frequency views
Time-domain features answer when and how behavior changes. A peak in failed actions may reveal a release problem. A long rising time in support volume may show accumulating friction before a customer escalates.
Frequency-domain features answer whether behavior repeats. Recurring weekly activity, periodic processing failures, or regular bursts in a workflow can point to operational cycles. These methods are particularly useful for sensor and industrial signals, but the broader principle is valuable in product analytics too.
Text and embeddings
Text signals need a different treatment. NLP features can turn phrases such as integration blockers, pricing concerns, or missing controls into structured variables. Embeddings go further by representing semantic similarity, allowing differently worded requests to cluster together.
For teams building a broader operating model, a practical user behavior analytics guide can help connect behavioral events with qualitative evidence. Still, embeddings aren't automatically better. They can be harder to audit, and a cluster only becomes valuable when the team can name the behavior and connect it to an action.
For a broader view of how automated systems identify patterns, see this discussion of automated pattern recognition. The right method depends on the signal, the noise, the decision, and the level of explanation stakeholders require.
How to Implement Extraction at Product Scale
A production pipeline needs more than an extraction algorithm. It needs consistent timing, identity resolution, versioning, storage, and delivery. Without those controls, a feature can look useful in a notebook and become unreliable when it meets late events, duplicated records, or changing product schemas.
Start with an explicit signal contract
Define the source, entity, time boundary, transformation, and intended decision before writing extraction code. A feature such as “support escalation intensity” needs a clear subject, perhaps an account or workspace, and a clear observation period. It also needs rules for duplicate tickets, reopened tickets, missing timestamps, and changes in labeling.
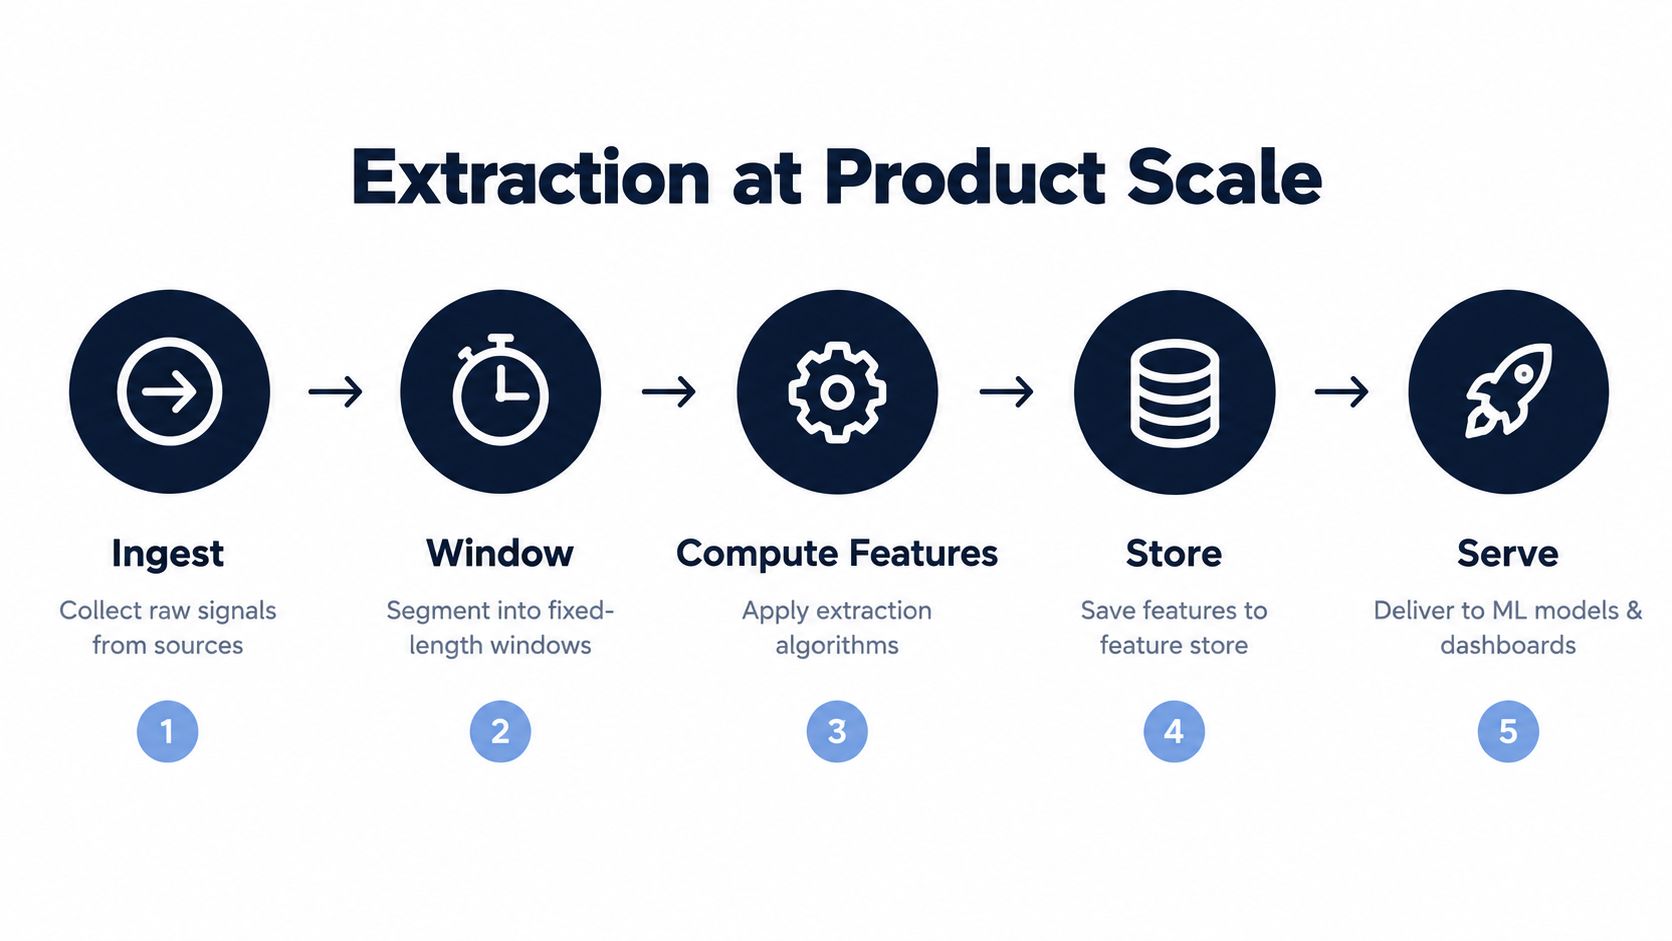
A reliable workflow usually follows this order:
- Ingest: Collect raw signals from product analytics, support systems, CRM records, transcripts, or connected sensors.
- Align: Resolve accounts, users, devices, and timestamps so different sources refer to the same entity.
- Window: Segment continuous streams or event histories into meaningful intervals.
- Compute: Apply statistical, temporal, spectral, NLP, or learned extraction methods.
- Store and serve: Publish versioned features to a feature store, model, dashboard, alert, or workflow.
Windowing deserves special attention. A fixed-length window can make a continuous signal computationally manageable, while an event-driven window may better represent a customer journey. The wrong boundary can hide the very change the team wants to detect.
Parallelize the expensive work
Window-parallel extraction can reduce compute cost in high-dimensional biosignal pipelines. A Ninapro benchmark reported up to a 20× reduction in total extraction time with 32 cores, with best-case latency of 0.23 ms per time window and 51.86 seconds per subject, compared with 64.92 minutes per subject and 16.66 ms per time window on one thread. These figures come from the Frontiers in Neurorobotics benchmark.
The result is useful, but it isn't a universal promise. The same benchmark found that gains vary by feature complexity, with RMS extraction faster than multiresolution DWT. Product teams should benchmark their own workload, especially when combining transcript processing, event joins, and real-time alerts.
Store features as governed products
A feature store should preserve the feature definition, source lineage, transformation version, freshness, and missing-data behavior. Analysts need to know whether a churn feature changed because customers changed or because the extraction logic changed.
Integration choices also affect operating speed. Zendesk, Intercom, Jira, Linear, and GitHub can provide complementary evidence, but each connector introduces identity and schema concerns. A disciplined data pipeline automation approach helps teams focus on decisions instead of repeatedly repairing ingestion jobs.
How to Evaluate Whether Your Features Actually Matter
A feature matters when it remains useful under realistic conditions and supports a defensible action. Model accuracy on a clean benchmark is only one signal. Product teams also need to know whether the feature is stable across accounts, periods, devices, plans, and changes in data collection.
Test stability before sophistication
Begin with a baseline. Compare a compact set of interpretable features against a larger feature dump, and keep the evaluation split aligned with how the system will operate. If the model will predict future churn, a time-based validation design is more revealing than a random split that allows information from later periods to leak backward.
Check for:
- Distribution stability: Does the feature behave similarly across customer segments and observation periods?
- Missingness sensitivity: Does the feature change meaning when one source stops reporting?
- Redundancy: Are several features measuring the same behavior?
- Drift: Does a release, device change, or tracking update alter the feature without changing customer intent?
- Actionability: Can a product, success, or revenue team respond to the finding?
Feature selection can improve both stability and efficiency. A structural health monitoring benchmark found that reduced univariate feature sets from a single accelerometer could distinguish healthy and damaged states under stratified k-fold cross-validation. In spike-sorting research, reducing 64-sample extracellular waveforms to about 46 to 55 selected features produced better clustering performance than most alternatives, with statistical significance reported at p < 0.001, as described in the Structural Health Monitoring study.
Separate prediction from explanation
A predictive feature isn't automatically causal. A rising ticket count may correlate with churn because the product is failing, because a customer has expanded usage, or because a new support workflow changed how cases are logged.
Ask three questions:
- What behavior does this feature represent?
- What alternative explanations could produce the same value?
- Does the relationship persist when the environment changes?
Explainability tools such as Shapley values and Grad-CAM can help interpret model outputs, but they don't automatically explain whether the underlying signal feature is durable or business-relevant. Recent work on biomedical and signal-processing systems highlights interpretability as an unresolved issue and discusses these methods in that context in this review.
A feature earns trust when a stakeholder can inspect it, challenge it, and still understand why the resulting action makes sense.
Real Examples Where Extracted Features Revealed Churn and Expansion
Consider a renewal account with an apparently healthy total usage trend. The account still logs in regularly, so a basic dashboard marks it as engaged. A closer extraction pipeline separates usage by workflow and finds a decline in the feature that represents a core activation path, alongside growing support language around an integration blocker.
The team doesn't treat that pattern as proof of churn. It treats it as a prioritized investigation. Customer success reviews the account, product checks the integration issue, and the team compares the extracted behavior with the account's contract context. The value comes from combining features that make the risk legible, not from relying on one alarming metric.
A second pattern appears in sales conversations. Different prospects use different language for the same missing capability. One says the workflow needs better approval controls, another describes an audit requirement, and a third asks for a more flexible handoff. NLP extraction identifies the recurring topic, while embeddings group semantically related requests that keyword rules would separate.
From pattern to commercial action
The product team can then connect the request cluster to account context. Are these requests coming from strategic prospects, existing customers, or low-value trials? Does the capability affect adoption, retention, or a larger expansion conversation? The extraction layer doesn't answer every commercial question, but it turns unstructured language into something the revenue team can examine.
A useful prioritization record might contain:
- Observed feature: A recurring workflow or topic representation.
- Affected entities: Accounts, segments, users, or opportunities connected to it.
- Behavioral evidence: Usage change, repeated friction, or support escalation.
- Commercial context: Renewal timing, expansion stage, or account importance.
- Recommended action: Investigate, contact, fix, validate, or defer.
The discipline matters because the supplied evidence doesn't support invented revenue outcomes or fabricated customer case studies. Teams should document the actual account, decision, and result rather than borrowing a precise dollar figure from an attractive narrative.
Revenue test: If a feature can't be mapped to a customer, a behavior, and a decision, it isn't ready to guide the roadmap.
Building a Feature Strategy That Survives Real World Noise
Real deployments rarely provide clean, perfectly aligned signals. Devices drift, events arrive late, customers use different workflows, transcripts contain ambiguous language, and one source may disappear temporarily. Recent reviews describe practical signal-based machine learning systems as challenged by noise, scarce abnormal samples, and computational complexity, while multimodal work highlights growing integration and interpretability burdens in this review.
A durable strategy starts with restraint. Extract the smallest representation that can answer the decision question, then add complexity only when the simpler feature fails. Mean, variance, change over time, topic frequency, and workflow sequence can be easier to monitor than a dense representation whose meaning shifts.
Use a revenue-oriented checklist
Before promoting a feature into production, ask:
- Robustness: Does it survive missing data, noisy inputs, and changes in collection?
- Reproducibility: Can another analyst recreate it from the same source records?
- Interpretability: Can stakeholders explain what a high or low value means?
- Discrimination: Does it separate relevant customer states from ordinary variation?
- Commercial mapping: Can the team connect it to churn prevention, expansion, adoption, or support cost?
- Governance: Is its lineage, version, access, and retention policy documented?
- Monitoring: Will someone notice when its distribution or meaning changes?
Multimodal data increases the opportunity and the risk. Combining usage with support language can reveal context that either source misses, but it also creates more alignment and governance work. The strongest feature strategy acknowledges that trade-off instead of assuming that more inputs always produce better decisions.
The final standard is practical: choose features that remain stable enough to trust and specific enough to act on. In revenue-sensitive product intelligence, a modest feature that survives deployment can be more valuable than a feature that only performs in a curated dataset.
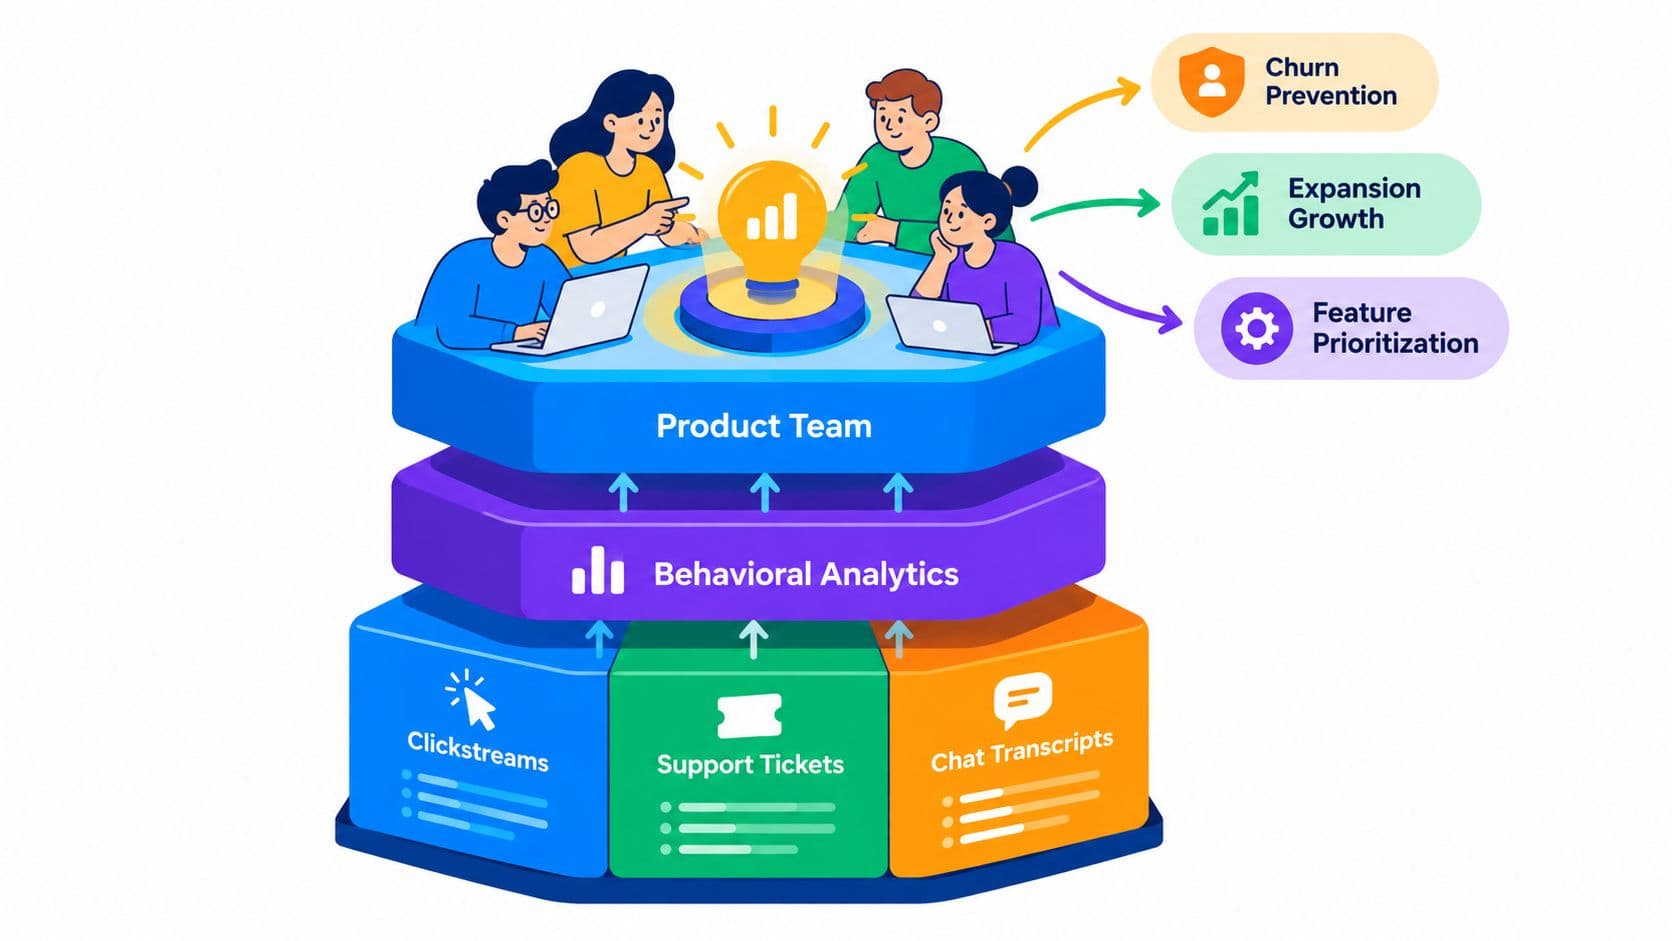
SigOS connects support tickets, chat transcripts, sales calls, and usage metrics to identify patterns associated with churn, expansion, and customer value. Visit SigOS to see how continuous behavioral analysis can turn extracted product signals into prioritized revenue decisions.


Ready to find your hidden revenue leaks?
Start analyzing your customer feedback and discover insights that drive revenue.
Start Free Trial →