Behavioral Data Analysis: A PM's Guide to Driving Revenue
Learn to use behavioral data analysis to cut churn and link user actions to revenue. A practical guide for SaaS product managers and growth teams.

A lot of product teams are stuck in the same loop right now. Survey responses say customers love the product. NPS comments look positive. Sales calls sound encouraging. Then renewal time comes around, expansion stalls, and support volume keeps climbing around the same few workflows.
That disconnect usually means you're measuring opinions more carefully than behavior.
For a SaaS business, revenue rarely moves because users said the right thing in a form. It moves because they completed onboarding, adopted the sticky part of the product, invited teammates, resolved friction fast, and built the product into their daily workflow. Behavioral data analysis is the discipline of turning those actions into decisions you can act on.
The teams that get good at this stop debating anecdotes. They start asking better questions. Which actions show real product value? Which patterns show churn risk early? Which support issues are tied to lost expansion, not just ticket volume? That's where product, growth, success, and revenue teams finally start working from the same evidence.
Why User Behavior Beats User Opinion
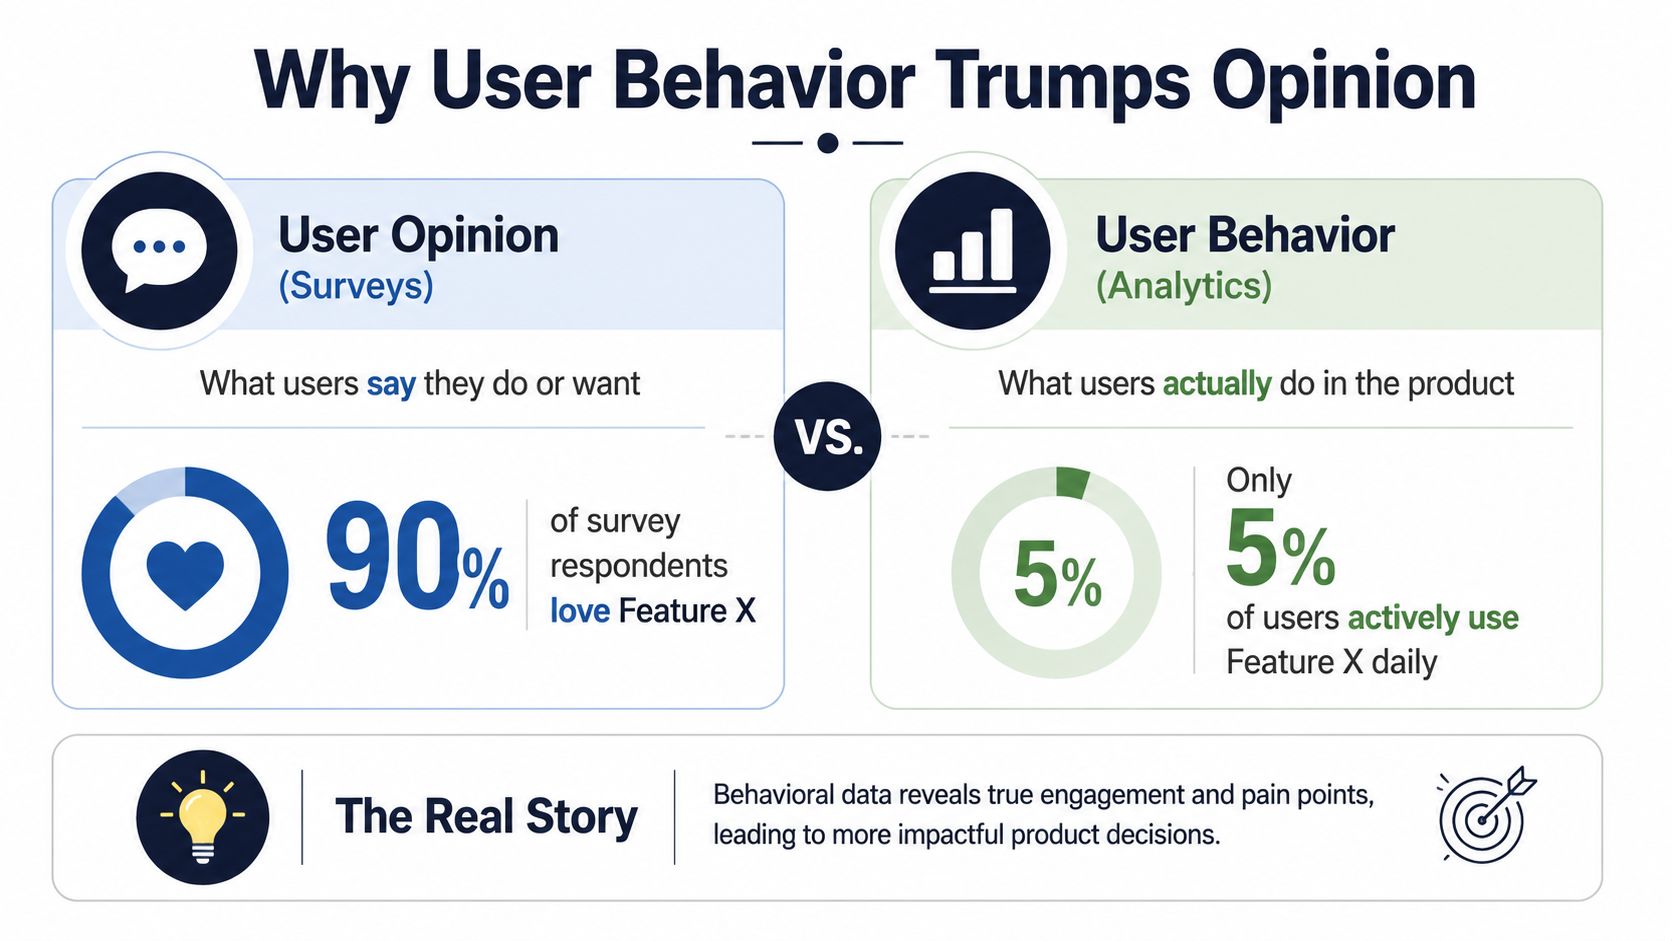
A common PM scenario looks like this. You ship a feature after weeks of customer interviews. Early feedback is strong. A handful of users even call it a reason they chose your product. But when you open product analytics, usage is thin, repeat usage is worse, and almost nobody builds the feature into a recurring workflow.
That gap matters because users often report aspirations, intentions, or isolated reactions. Behavior shows what they did when they had real work to do.
What opinion data gets right
Opinion data still has value. Surveys, interviews, and support conversations can uncover language, motivations, and frustration that clickstream data will never explain on its own.
If a customer says setup feels confusing, that's useful. If several enterprise buyers say procurement stalled because permissions were unclear, that's useful too. For teams working with interview transcripts and customer themes, this qualitative data analysis guide is a helpful complement to product analytics.
What behavior does better
Behavioral data analysis wins when the question is commercial, not conversational.
It answers things like:
- Adoption: Which actions separate accounts that stay active from those that fade after onboarding?
- Friction: Where do users abandon a flow, retry steps, or bounce into support?
- Expansion: Which usage patterns show that a team is growing into a higher-value account?
- Retention risk: Which combinations of declining usage, failed actions, or support pain tend to appear before churn?
Practical rule: If a decision affects retention, pricing, onboarding, or roadmap priority, validate what users said against what users did.
This is one reason the category has expanded so quickly. The global behavioral analytics market reached USD 1.5 billion in 2023 and was projected to grow at a CAGR of more than 40% from 2023 to 2028 according to MarkNtel Advisors' behavioral analytics market analysis. That growth reflects a simple shift in how companies operate. They aren't treating user actions as background reporting anymore. They're using behavior as input for product, retention, and revenue decisions.
The revenue angle most teams miss
Vanity metrics are comfortable because they make progress look broad. Signups went up. Tickets went down. More users visited the dashboard.
None of that guarantees value creation.
The stronger move is to ask whether a behavior has a plausible path to money. Did usage deepen in a workflow tied to renewal? Did more accounts reach the activation point that predicts long-term stickiness? Did a bug affect users with open expansion opportunities?
When a team starts from behavior instead of sentiment, roadmap conversations get sharper. You stop optimizing for applause and start optimizing for actions that compound.
Finding the Signal What Is Behavioral Data
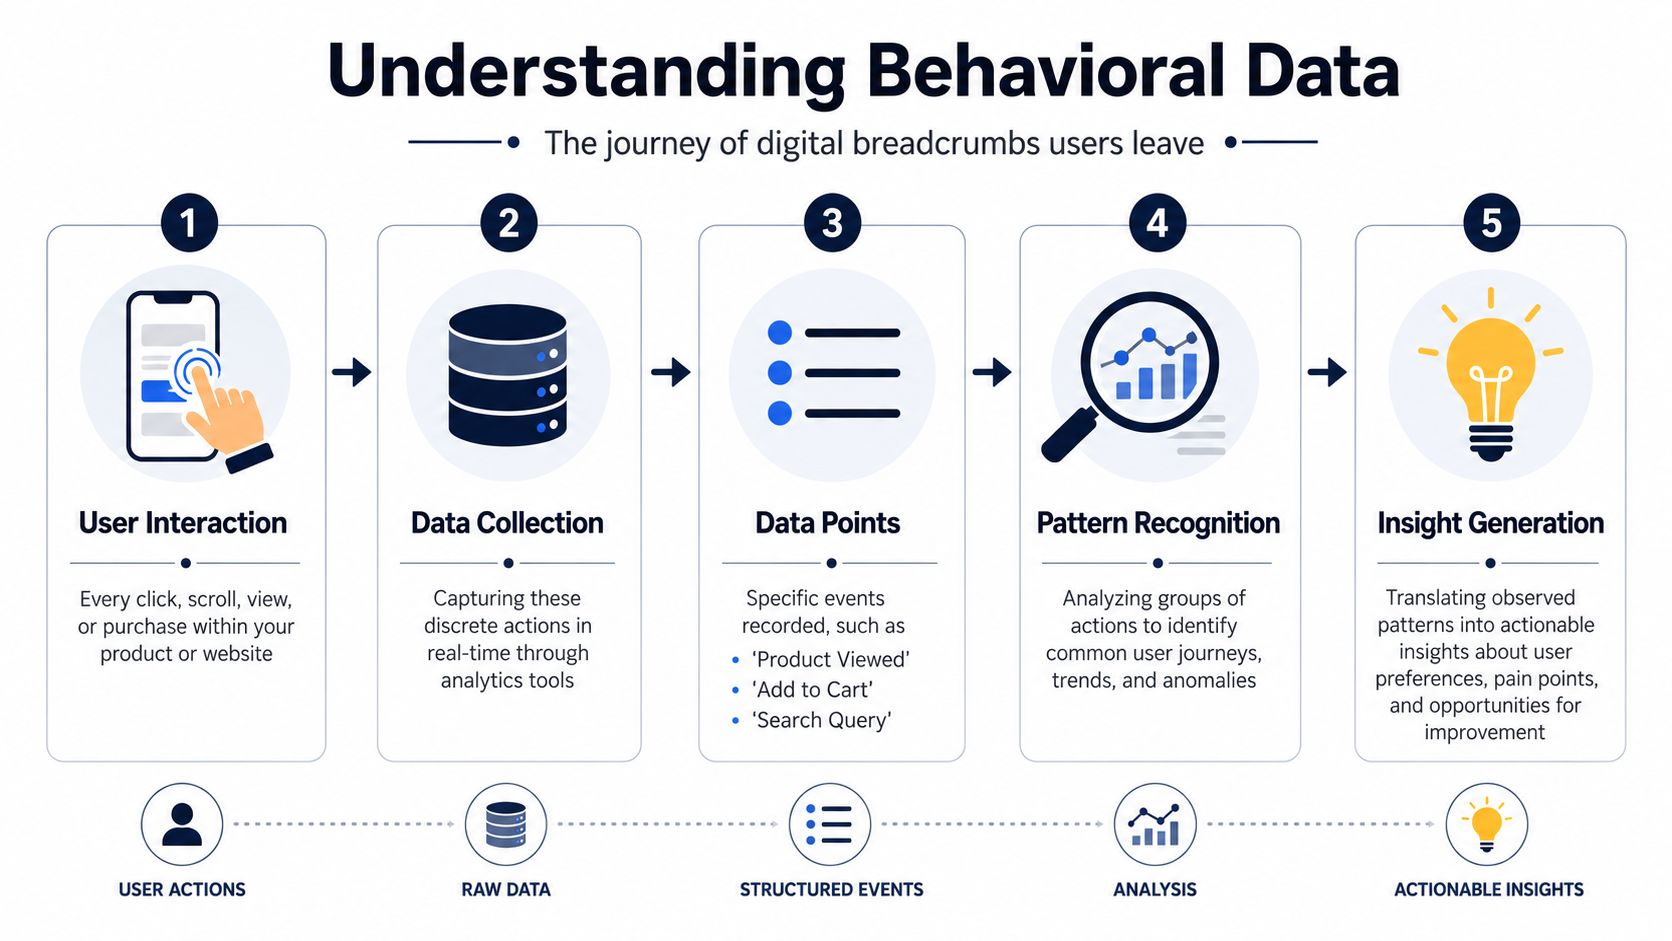
Behavioral data is the trail users leave behind as they move through your product and related channels. Not broad summaries. Not monthly averages. Individual actions tied to a user, a session, or an account.
In practice, these are your digital breadcrumbs. A login. A page view. A search. A button click. A failed import. A report export. A support chat opened after an error. On their own, these look small. Combined, they tell the story of whether someone is getting value or getting stuck.
Where the data comes from
Most SaaS teams already have more behavioral data than they realize. It's just scattered.
Common sources include:
- Product events: Logins, feature clicks, searches, workflow completions, errors, and repeated retries.
- Marketing engagement: Email clicks, ad interactions, webinar attendance, pricing page visits, and demo requests.
- Support signals: Tickets, chat transcripts, bug reports, escalation tags, and help center searches.
- Commercial activity: Trial start, plan changes, seat growth, downgrade requests, and renewal conversations.
If you work across product and service delivery, this guide for agencies on behavioral segmentation is useful because it frames behavior by patterns and intent instead of broad persona labels.
Why event-level tracking changes everything
Modern behavioral data analysis relies on event-level tracking, where every user action is captured as an event with a user or session ID. That structure is what turns random activity logs into a usable journey across funnels, cohorts, and sequences, as explained in Statsig's guide to understanding behavioral data.
Without event-level tracking, teams end up arguing over summaries. You might know that activation dropped this month, but not which exact step failed or which segment felt the change first. With event-level data, you can isolate the point of friction and the users affected.
Good instrumentation doesn't start with dashboards. It starts with naming the actions that matter and capturing them consistently.
The basic pipeline that has to work
A reliable setup usually has three layers.
First, instrumentation. This is your tracking plan. You define the events, properties, naming conventions, and identities that matter. If your onboarding flow includes invite teammate, connect integration, and publish first output, those steps should exist as explicit events, not inferred guesses.
Second, collection. Analytics tools, CDPs, product telemetry, and support systems capture those actions as they happen.
Third, storage and access. Data lands in an analytics platform or warehouse where product, growth, and data teams can query it. If this layer is messy, every later insight becomes suspect.
The bedrock is the tracking plan. Teams that skip it usually end up with duplicate event names, broken IDs, missing properties, and endless debate over whether a metric is trustworthy.
Core Methods for Behavioral Data Analysis
Teams don't need more dashboards. They need the right method for the question in front of them.
A useful progression starts with exploratory review and moves into deeper analysis. The strongest approach is to begin with EDA, then use cohort, funnel, and predictive analysis to move from pattern recognition to action, as described in Indicative's explanation of behavioral analytics methods.
Start with the business question
If the question is vague, the analysis will be vague too.
“Tell me what's happening in the product” produces noise. “Which behaviors in the first week separate retained customers from churned customers?” produces a useful plan. So does “Where do self-serve users abandon setup before reaching first value?” or “Which support interactions tend to appear before downgrade requests?”
Behavioral analysis methods at a glance
| Method | Key Question It Answers |
|---|---|
| Funnel analysis | Where do users drop out of a critical journey? |
| Cohort analysis | How does behavior or retention differ across groups over time? |
| Sequence analysis | What paths do successful users usually take before reaching value? |
| Clustering | Which meaningful user groups exist based on actual behavior patterns? |
| Predictive analysis | Which current behaviors suggest likely future outcomes such as churn or upgrade? |
For a deeper breakdown of retention-based grouping, this cohort analysis primer is worth keeping handy.
Funnel analysis for friction you can fix
Funnel analysis is the workhorse for onboarding, conversion, and feature adoption.
A PM might track this sequence: create workspace, invite teammate, connect data source, publish first report. If the biggest drop happens between invite teammate and connect data source, that points to a specific implementation problem. Maybe permissions are unclear. Maybe the integration step feels risky. Maybe the setup docs don't match the UI.
The point isn't just to identify a leak. It's to identify a leak tied to a commercial milestone.
Cohort analysis for retention reality
Cohorts let you compare groups that started in different periods, from different channels, or with different product experiences.
The inadequacy of vanity metrics becomes clear. A new onboarding flow might boost initial activation, but a cohort view can show whether those users still engage weeks later. Likewise, a feature launch may look successful in aggregate while newer cohorts retain worse because adoption is shallow.
Cohorts help you avoid one of the most expensive mistakes in SaaS: declaring victory on early activity that doesn't hold.
Sequence analysis for the golden path
Some users don't just use your product more. They use it in a different order.
Sequence analysis helps you map the common path taken by users who become successful accounts. Often there's a repeatable progression. They import data, configure one core workflow, invite collaborators, and return through a specific recurring task. That sequence becomes more valuable than any single event in isolation.
This is especially useful when you're trying to redesign onboarding. Instead of showing every capability, you steer users toward the sequence most associated with durable value.
Clustering for segments that are real
A lot of segmentation in SaaS is cosmetic. Team size, plan type, or acquisition channel can be useful, but they don't always explain usage.
Behavioral clustering often reveals sharper groups:
- Explorers: They click widely, sample features, but don't repeat core actions.
- Operators: They use a narrow workflow frequently and depend on reliability.
- Champions: They invite teammates, configure advanced settings, and expand usage.
- At-risk accounts: They log in less, encounter repeated friction, and shift toward support interactions.
Those segments give product and lifecycle teams something practical to act on.
A Practical Workflow From Insight to Revenue
The most useful behavioral analysis starts with a financial question, not an analytics one. Don't begin with “what can we measure?” Begin with “what behavior seems to separate accounts that grow from accounts that stall?”
That framing changes everything. It forces product, growth, support, and finance to look at the same journey.

Start with one revenue-linked question
A strong question sounds like this: which early behaviors are common among retained accounts and rare among churned accounts?
That question is better than “what's our activation rate?” because it connects usage to an outcome that matters commercially. It also gives the team a way to avoid measuring activity for its own sake.
In practice, the workflow usually looks like this:
- Choose the outcomePick one business outcome to explain. Churn, renewal health, expansion readiness, downgrade risk, or activation quality all work.
- Define the comparison groupsCompare retained versus churned accounts, expanded versus flat accounts, or support-heavy versus support-light accounts.
- Pull the relevant behaviorsLook at first-week actions, repeated feature use, collaboration patterns, support events, and failure points.
- Find the differentiatorsIdentify which actions show up consistently in stronger accounts and which patterns cluster around weaker ones.
- Turn the finding into an interventionIf successful users reliably complete a setup step early, redesign onboarding and lifecycle messaging to drive that action.
What this looks like in the real world
Say you notice that retained customers often complete one important workflow early, while churned users spend time in peripheral features and never reach that moment. You don't need a giant transformation program. You need a focused test.
You might simplify onboarding so the first-run experience pushes users toward that action. Customer success might add it to kickoff calls. Lifecycle emails might reinforce it with setup guidance. Support might tag issues that block it.
That's the point where analysis starts earning its keep. The insight creates a hypothesis, the hypothesis changes execution, and the business measures whether behavior and outcomes improved.
A lot of teams also need a way to combine product activity with support and revenue context. Tools like product analytics platforms, warehouse models, and systems such as SigOS can help by correlating usage signals, feedback, and account-level commercial impact in one view, especially when churn and expansion patterns don't show up in product events alone.
Here's a useful explainer before you operationalize this process:
Build a loop, not a one-off report
One analysis rarely changes a business. A repeatable loop does.
Use this operating rhythm:
- Observe behavior: Review the key journeys weekly.
- Form a hypothesis: Decide which behavior likely matters and why.
- Ship a change: Adjust onboarding, UX, messaging, support process, or packaging.
- Measure again: Check whether the target behavior moved and whether the downstream revenue outcome changed.
Revenue-focused behavioral work gets stronger when product and GTM teams share the same definition of value. Otherwise one team drives clicks while another team deals with churn.
Many PMs become more influential when they stop being owners of features and become owners of user progression toward revenue-relevant outcomes.
Separating Correlation From Causation
One of the easiest mistakes in behavioral data analysis is assuming that a strong pattern explains itself.
Your highest-value accounts may use a specific feature heavily. That doesn't automatically mean the feature creates high-value accounts. It might be that more mature teams adopt it because they already have better processes, larger teams, or a stronger implementation partner. The feature could be a marker of account quality, not the cause of it.
That distinction matters because bad causal logic leads to bad product bets.
Correlation is a starting point
A major challenge in this work is separating signal from confounding variables. Many teams can explain what happened in a funnel or segment, but the harder question is why it happened, which requires stronger diagnostic or experimental design, as discussed in Wakoopa's behavioral data analysis overview.
If users who contact support during onboarding retain worse, the wrong conclusion is “support causes churn.” More likely, those users ran into friction serious enough to require help. Support is the signal. The product problem may be the cause.
How to build confidence
The practical move is to raise the standard of proof before you change roadmap or lifecycle strategy.
Use questions like these:
- Timing: Did the behavior appear before the outcome, or only alongside it?
- Segment consistency: Does the pattern hold across self-serve, mid-market, and enterprise users?
- Alternative explanations: Could account size, role, implementation quality, or plan type explain the difference?
- Intervention evidence: When you actively increase the behavior, do outcomes improve?
For PMs who need a disciplined way to validate ideas, this hypothesis testing guide is a practical next step.
What strong teams do differently
They treat observational analysis as a prioritization tool, not final proof.
A sequence pattern can tell you where to investigate. A cohort gap can tell you where to look. A predictive signal can tell you which accounts need attention. But if you're making a major product decision, run a cleaner test when you can. Change onboarding for one segment. Adjust the in-app prompt. Compare outcomes. Watch whether the target behavior rises and whether retention or expansion shifts with it.
Don't ask data to prove more than it can prove. Use behavioral patterns to narrow the field, then use experiments and diagnostics to decide what's real.
That mindset protects teams from overreacting to patterns that look compelling but won't survive contact with the next quarter's data.
Common Pitfalls and Ethical Guardrails
Most failures in behavioral data analysis aren't caused by complex math. They're caused by bad inputs, weak questions, and sloppy operating habits.
Teams chase dashboards before they fix instrumentation. They monitor clicks that don't connect to value. They ask predictive models to compensate for missing product data. Then they wonder why none of the outputs are stable enough to trust.
The mistakes that waste the most time
A few show up constantly:
- Vanity metrics first: High usage on a shallow feature can distract from weak retention in the core workflow.
- Analysis paralysis: Teams keep slicing segments without deciding what action the analysis should trigger.
- Broken instrumentation: Event names drift, IDs don't resolve cleanly, and key properties are missing when you need account context.
- Premature prediction: Teams want churn scoring before they can reliably define activation or product-qualified behavior.
A key issue is knowing when your data is sufficient for predictive modeling versus descriptive reporting. Predictive behavioral data often requires more specialized instrumentation, and many teams struggle to judge whether their current data quality is good enough for reliable churn or expansion forecasting, as outlined in this discussion of predictive behavioral data requirements.
Privacy is not a side topic
Behavioral analysis gets risky when teams act like more data is always better.
You need clear limits. Collect what you can justify. Restrict access to sensitive records. Be transparent with users about what you track and why. Work with legal and security teams before someone stitches together product events, support logs, and customer communications in a way that violates your own standards.
For teams building internal principles around responsible collection and transparency, this data privacy manifesto is a useful reference point.
The practical standard is simple. If you can't explain a data practice clearly to a customer, revisit it. If a model output could affect how an account is treated, make sure someone can inspect the reasoning behind it.
Behavioral analysis is powerful because it sits close to real customer activity. That's also why the guardrails matter.
Your First Steps in Behavioral Analysis
You don't need a full data science program to get started. You need one concrete question, one meaningful journey, and enough discipline to tie behavior back to a business outcome.
Three moves to make this week
- Pick one activation behavior: Choose the action that most likely represents first value in your product. Then compare users who reach it against users who don't. Look for differences in repeat usage, support friction, and account health.
- Map one critical journey end to end: Sit with an analyst or engineer and define the events for your most important path. For many SaaS products, that's trial start to first successful outcome. Don't over-model it. Just make sure the journey is instrumented cleanly.
- Pair usage with customer context: Read a small set of support tickets or sales notes tied to one feature, then compare them with actual feature usage. You'll often find that loud feedback and meaningful behavior aren't the same thing.
What to watch for
You're looking for behaviors that meet three tests.
First, they happen early enough to influence. Second, they show up consistently in stronger accounts. Third, your team can do something about them through product, onboarding, support, or lifecycle work.
That's the operating point where behavioral data analysis becomes useful. Not as an abstract reporting layer, but as a way to decide where to focus limited time and roadmap capacity.
Start small. Get one pattern right. Prove that a behavioral insight can change a business decision. After that, the work gets easier because the team stops asking whether this matters and starts asking where else they can apply it.
If your team wants to connect support feedback, usage signals, and revenue impact in one workflow, SigOS is built for that job. It helps product and growth teams identify behavioral patterns tied to churn, expansion, and customer pain so prioritization is based on commercial impact instead of noise.
Keep Reading
More insights from our blog


Ready to find your hidden revenue leaks?
Start analyzing your customer feedback and discover insights that drive revenue.
Start Free Trial →