Calculate Lifetime Value SaaS: calculate lifetime value saas in practice
Learn how to calculate lifetime value saas with practical formulas, real-world examples, and strategies to boost SaaS profitability.

Calculating the lifetime value (LTV) of a SaaS customer is, at its core, an estimate of how much total revenue that person will bring in before they eventually churn. To get a quick, back-of-the-napkin figure, you just need your Average Revenue Per Account (ARPA) and your Customer Churn Rate. The simple formula is just LTV = ARPA / Churn Rate.
But that's just the starting point.
Why SaaS LTV Is Your Ultimate Growth Compass

Before we get buried in formulas and spreadsheets, let's be clear on why LTV is so much more than just another metric to track. For a SaaS business, LTV is your North Star. It's the single best indicator of your company's health and long-term viability. Honestly, learning how to calculate lifetime value for your SaaS company is a non-negotiable skill if you're serious about sustainable growth.
Getting a real handle on LTV forces a critical shift in perspective—moving away from chasing short-term acquisition numbers and toward building a durable, value-driven growth engine. This one number can, and should, inform smarter decisions across your entire company.
- Marketing Spend: LTV tells you exactly how much you can afford to spend to acquire a new customer and still turn a profit. No more guessing games with your ad budget.
- Product Development: It shines a light on your most valuable customer segments, helping you prioritize the features that keep them happy and drive expansion revenue.
- Investor Confidence: Nothing says "healthy business model" like a strong LTV. It demonstrates predictable, long-term revenue, which is exactly what investors want to see.
The LTV to CAC Ratio Explained
The real magic happens when you pit your LTV against your Customer Acquisition Cost (CAC). This gives you the LTV:CAC ratio, which is the ultimate health check for your entire business model. It answers the one question that truly matters: are you building a profitable company, or just burning cash?
The unofficial gold standard in SaaS is a 3:1 ratio. For every dollar you put into acquiring a customer, you should be getting at least three dollars back over their lifetime. A healthy ratio like this is a powerful signal of scalability, solid product-market fit, and a bright financial future.
A ratio hovering around 1:1 is a massive red flag. You're essentially on a treadmill to nowhere, just breaking even on every new customer you bring in. On the flip side, a ratio of 5:1 or higher might actually mean you're underinvesting in growth and leaving money on the table.
This delicate balance is what makes the LTV:CAC ratio so incredibly powerful. In fact, some research shows that companies consistently holding LTV:CAC ratios above that 3:1 benchmark can fetch valuation multiples that are 20-25% higher than their peers. You can find more great insights about SaaS valuation drivers from Design with Value.
At the end of the day, LTV isn't just a number you look back on. When you calculate it right, it becomes a predictive compass guiding every strategic move you make—from daily marketing tweaks to your long-term product vision. It’s what helps you build a business that not only grows but actually lasts. The next sections will walk you through the practical steps to calculate lifetime value for your SaaS business with the accuracy you need.
Getting the Core Ingredients Right for a Reliable LTV

Before you even touch a formula, you have to get your data straight. I've seen too many teams build a beautiful, complex LTV model only to have it fall apart because the inputs were garbage.
Think of it this way: if you're baking a cake and grab salt instead of sugar, it doesn't matter how great your recipe is—the result will be a disaster. The same principle applies here. Your LTV calculation hangs on three fundamental pillars: average revenue, customer churn, and gross margin. Let's walk through how to lock these down with the precision they demand.
Nailing Your Average Revenue Per Account
First up, we need to know what a customer is actually worth on a recurring basis. This is your Average Revenue Per Account (ARPA), sometimes called ARPU. It’s the average revenue you pocket from each account, usually measured monthly.
The basic formula looks simple enough:
ARPA = Total Monthly Recurring Revenue (MRR) / Total Number of Active Customers
But here's where people trip up: mixing contract types. If you have both monthly and annual plans, just averaging them out will give you a wonky number. You have to normalize everything to a monthly figure first.
- Monthly Plans: Just use the MRR. Easy.
- Annual Plans: Take the annual contract value and divide it by 12.
Let's run a quick scenario. Imagine you have 90 customers paying 100/month and 10 others on a ****960 annual plan. You'd first get your total MRR: (90 * 100) + (10 * (****960/12)) = 9,000 + ****800 = $9,800.
Now, divide that by your 100 total customers, and you get a true ARPA of $98. That's the number you can trust.
Decoding Your Customer Churn Rate
Next, we have to face the music: how fast are customers leaving? That's your Customer Churn Rate—the percentage of subscribers who cancel in a given period. It's the flip side of your retention rate.
The standard formula for monthly churn is:
Customer Churn Rate = (Customers Lost in Period / Customers at Start of Period) * 100
But there's a critical distinction here that separates the pros from the amateurs: customer churn vs. revenue churn.
- Customer Churn: This just tracks lost logos. It tells you how many accounts you've lost.
- Revenue Churn: This tracks lost dollars. It’s a much better indicator of financial health, especially if you have customers on different pricing tiers.
Honestly, for most SaaS businesses trying to get a real handle on lifetime value, revenue churn tells a more powerful story. Losing ten small-fry accounts might not hurt as much as losing one massive enterprise client. Tracking the right customer retention metrics is about more than just counting heads.
My Two Cents: When calculating churn for a specific month, make sure you only use the customer count from the start of the month as your denominator. Don't include new customers you signed during that month. Including them will artificially deflate your churn rate and give you a dangerously inflated LTV.
If you really want to get into the weeds on this, our guide on essential customer retention metrics breaks down how to track this stuff properly. https://www.sigos.io/blog/customer-retention-metrics
Calculating an Honest Gross Margin
This last ingredient is the one I see forgotten most often: your Gross Margin. Calculating LTV on pure revenue is a vanity metric. You need to know the profit a customer delivers over their lifetime. Gross Margin cuts through the noise and tells you what percentage of revenue is left after the direct costs of serving your customers.
Gross Margin % = ((Total Revenue - Cost of Goods Sold) / Total Revenue) * 100
The real work here is defining your Cost of Goods Sold (COGS) correctly. For SaaS, this isn't about physical inventory; it's about the costs directly tied to keeping your service running and your customers happy.
What to Include in SaaS COGS:
- Cloud hosting bills (like AWS, Azure, or Google Cloud)
- Salaries for your customer support and success teams
- Tools used only by your support team (think Zendesk or Intercom)
- Fees for any third-party data or APIs core to your product
What to Exclude from SaaS COGS:
- General R&D and product engineering salaries
- Sales and marketing expenses
- Overhead like office rent or executive salaries (G&A)
Skipping the gross margin step is a rookie mistake. An LTV of 5,000 looks fantastic on a slide deck, but if your gross margin is 70%, the lifetime profit is actually ****3,500. That distinction is everything when you're deciding how much you can afford to spend on customer acquisition.
Once you have these three numbers dialed in, you're finally ready to put them together for a truly meaningful LTV calculation.
Choosing the Right LTV Formula for Your Business
Now that you have your core metrics squared away—ARPA, churn, and gross margin—it’s time to actually calculate lifetime value. But this isn't a one-size-fits-all situation. The LTV formula you pick really depends on your business stage, what you're trying to achieve, and frankly, how precise you need to be right now.
There are a few ways to tackle this, each with its own trade-offs between speed and accuracy. Let’s break down the most common methods, starting with the simplest and working our way up to the most insightful. This will help you find the right fit for where your business is today.
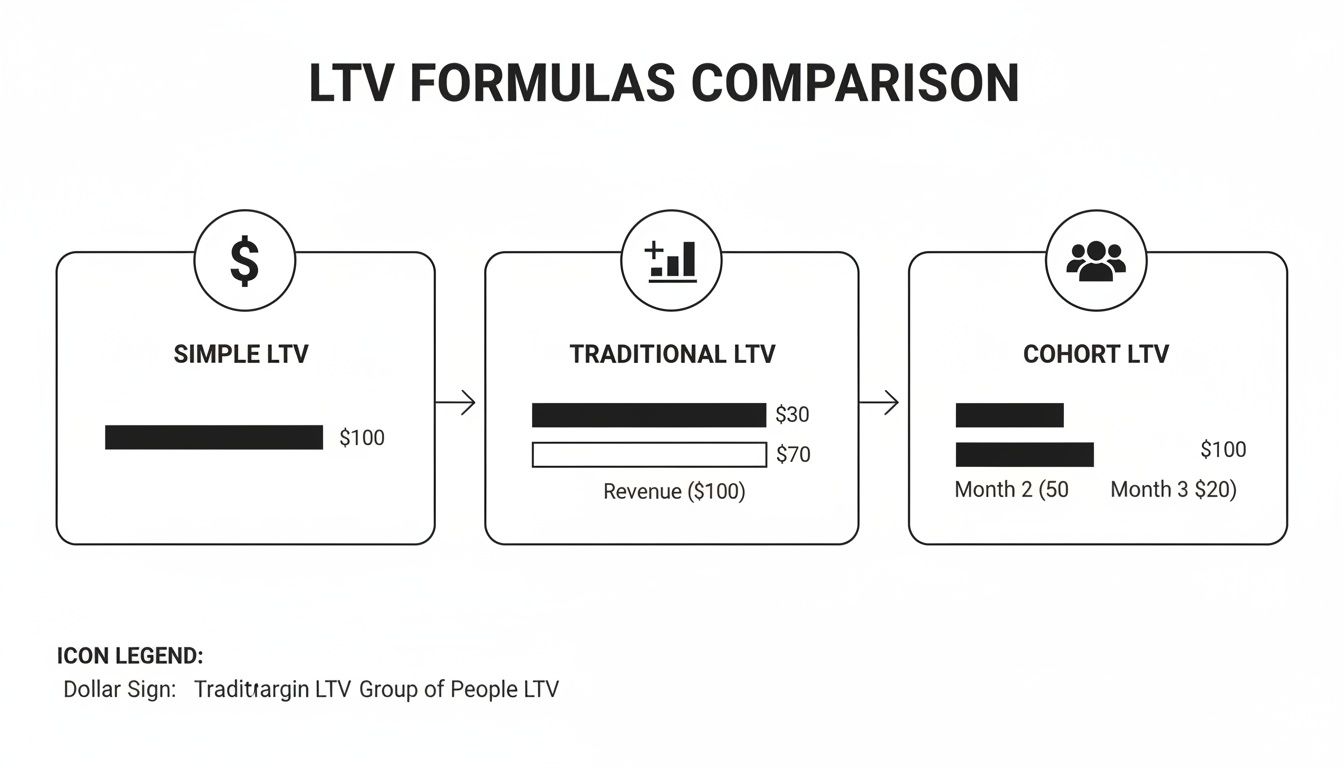
The Quick and Dirty Snapshot
For a fast, back-of-the-napkin estimate, you can use the most basic LTV formula out there. This version is great for getting a general sense of direction, but be warned: it comes with some serious blind spots.
The formula is simply: LTV = ARPA / Customer Churn Rate
Let’s imagine your SaaS company has an ARPA of $150 and a monthly customer churn rate of 5% (or 0.05).
Plugging those in, your LTV would be **150 / 0.05 = **3,000.
This tells you that, on average, a new customer is worth $3,000 in revenue over their lifetime. It’s a useful starting point, but it's dangerously incomplete. Why? Because it treats every dollar of revenue as pure profit, and as we all know, that’s never the case.
Introducing the Traditional LTV Formula for Profitability
To get a much more realistic picture of what a customer is actually worth, you absolutely have to factor in your Gross Margin. This one change shifts the entire focus from top-line revenue to bottom-line profitability, which is what truly fuels sustainable growth.
Here’s the more traditional and responsible formula: LTV = (ARPA * Gross Margin %) / Customer Churn Rate
Let’s stick with the same numbers but add a Gross Margin of 80% (0.80), which is pretty standard for a lot of SaaS businesses.
Now the calculation looks like this: LTV = ($150 * 0.80) / 0.05
LTV = 120 / 0.05 = ****2,400
That’s a $600 difference. Suddenly, the lifetime profit from each customer is 20% lower than our initial, overly optimistic estimate. This is a massive distinction when you’re setting marketing budgets based on your LTV:CAC ratio. Ignoring gross margin isn't a small oversight; it’s a recipe for overspending and burning through cash.
This formula gives you a solid, company-wide average. It’s a huge improvement over the basic model and provides a much healthier number to guide your strategy. But it still has one major weakness: it assumes all your customers are the same.
The Gold Standard: Cohort-Based LTV Analysis
For a SaaS business, the most powerful way to calculate lifetime value is through cohort analysis. This approach moves beyond a single, blended LTV and reveals how specific customer groups actually behave over time. A cohort is just a group of customers who all signed up during the same period, usually the same month.
By tracking each cohort separately, you can uncover trends that a single, company-wide average would completely hide. You might discover that customers who signed up in March have a much higher LTV than those from July, which should immediately make you ask, "What did we do differently then?"
Let's walk through a simplified example. Imagine you're analyzing your January 2023 cohort, which started with 100 new customers.
| Month | Active Customers | ARPA | Monthly Revenue | Cumulative Revenue |
|---|---|---|---|---|
| Jan 2023 | 100 | $50 | $5,000 | $5,000 |
| Feb 2023 | 95 | $50 | $4,750 | $9,750 |
| Mar 2023 | 92 | $51 | $4,692 | $14,442 |
| Apr 2023 | 88 | $51 | $4,488 | $18,930 |
To find the LTV for this cohort at the 4-month mark, you just divide the total cumulative revenue by the number of customers you started with:
**4-Month LTV = ****18,930 / 100 Customers = **189.30
This number tells you the average revenue you’ve generated from each customer in this specific group over their first four months. You can keep this going for 12, 24, or even 36 months to see how that value evolves.
Why Cohorts Are So Powerful
Analyzing LTV this way gives you incredible insights. You can start answering critical questions like:
- Product Improvements: Did that major feature we released in Q2 lead to higher LTV for the cohorts that followed?
- Marketing Channels: Are customers from our paid search campaigns more valuable than those from organic social?
- Pricing Changes: How did our new pricing tiers affect the LTV of customers who signed up after we made the change?
While it’s more complex to set up, cohort analysis transforms LTV from a static metric into a dynamic diagnostic tool. It helps you understand the why behind your numbers, so you can double down on what works and fix what doesn't. For any SaaS business serious about optimizing its growth engine, moving to a cohort-based LTV isn’t just an option—it’s a necessity.
Accounting for Expansion Revenue and Discounting
The simple LTV formulas we've covered so far are a great starting point, but they have a blind spot. They often miss two powerful—and opposing—forces that can dramatically warp your numbers: happy customers spending more over time, and discounts silently eating away at your profit margins.
A basic calculation treats every customer like a static, predictable revenue stream. It assumes they’ll pay their $50/month until the day they churn, and that's that. But in any healthy SaaS business, your best customers grow with you. They upgrade to a higher tier, add more seats for their growing team, or buy new features. This is expansion revenue, and it’s pure gold for your bottom line.
To truly get a handle on calculating the lifetime value of a SaaS customer, you have to look beyond the initial sale and account for both this organic growth and the value erosion from discounts.
Factoring in Upsells with Net Revenue Retention
To move past a static LTV model, we need to shift our focus from just customer churn to a more holistic metric: Net Revenue Retention (NRR). NRR gives you the full story by tracking the total recurring revenue from a cohort of customers, factoring in both revenue loss from churn and revenue gains from expansion.
Here’s the formula:
NRR = (Starting MRR + Expansion MRR - Churned MRR) / Starting MRR
If your NRR is over 100%, you’ve hit the SaaS holy grail. It means your existing customers are generating more new revenue than you're losing from the ones who leave. This is often called "negative churn," and it means your business can grow even if you don't sign a single new customer.
This is where LTV calculations really start to evolve, moving from simple estimates to more sophisticated, cohort-based models that reflect reality.
As you can see, layering in variables like gross margin and cohort-specific behavior makes your LTV calculation a much more accurate predictor of genuine, long-term profitability.
The Hidden Damage of Aggressive Discounting
While expansion revenue is the hero that lifts your LTV, discounting is the villain that drags it down. It's a silent killer of long-term value, and its impact is almost always bigger than you think.
The damage goes far beyond the initial lost revenue. The real problems are second-order effects:
- It tanks your ARPA: This one's obvious. A discount directly reduces your Average Revenue Per Account, shrinking one of the core inputs of your LTV formula from day one.
- It attracts the wrong crowd: Customers drawn in by a cheap price are often the first to leave when a competitor offers something cheaper. Their loyalty is to the deal, not your product.
- It sets a low price anchor: Once someone gets a discount, it becomes incredibly difficult to ever get them to pay full price. In their mind, you've already devalued your own product.
Let's look at how these two opposing forces play out.
Impact of Discounting vs. Expansion Revenue on LTV
This table shows a side-by-side comparison of how a 15% annual discount versus a 15% annual expansion revenue strategy impacts the key components of an LTV calculation for a customer with a base ARPA of $100.
| Factor | Effect of 15% Discounting | Effect of 15% Annual Expansion |
|---|---|---|
| Year 1 ARPA | $85 (initial discount applied) | $100 (starts at base price) |
| Year 2 ARPA | Remains at $85 (or lower) | $115 (grows by 15%) |
| Customer Profile | Price-sensitive, higher churn risk | Value-focused, higher loyalty |
| Price Anchor | Low; difficult to upsell | High; easier to upsell further |
| Overall LTV | Significantly Reduced | Significantly Increased |
The contrast is stark. One path consistently degrades value over the customer's entire lifetime, while the other creates a compounding effect that builds value year after year.
A Tale of Two Companies
Let's make this even more concrete. Imagine two identical SaaS companies, Company A and Company B. Both start with an ARPA of $100, a 2% monthly churn rate, and an 80% gross margin.
Based on these numbers, their baseline LTV is: (100 * 0.80) / 0.02 = ****4,000.
Now, watch what happens when they adopt different strategies.
Company A: The Growth Engine Company A obsesses over customer success and delivering more value. As a result, they generate a modest 1% in monthly expansion revenue from existing customers. This counteracts their churn, bringing their Net Revenue Churn down to just 1% (2% churn - 1% expansion).
- Their new LTV is: (100 * 0.80) / 0.01 = ****8,000
- The Result: By focusing on value, they have doubled their LTV.
Company B: The Discount Trap Company B, on the other hand, uses a 20% upfront discount as their go-to sales tactic. Their ARPA immediately drops to $80. Worse, the price-sensitive customers they attract are less sticky, and their churn rate creeps up to 3%.
- Their new LTV is: (80 * 0.80) / 0.03 = ****2,133
- The Result: That "quick win" discount has obliterated their LTV by nearly 47%.
This side-by-side comparison makes it painfully clear. Chasing short-term acquisition numbers with discounts can destroy long-term value. A smarter, more sustainable path is to focus on customer success and expansion, which creates a powerful, compounding growth engine for your business.
Using AI and Product Signals for Predictive LTV
Even the most detailed cohort analyses have a fundamental weakness: they’re rearview mirrors. They tell you a story about what already happened. The real strategic power, though, comes from predicting what will happen. This is exactly where modern AI and product intelligence are changing the entire game for SaaS leaders.
Instead of waiting for a cancellation request to land in your inbox, you can now analyze real-time user behavior to see the future taking shape. Suddenly, LTV transforms from a historical report card into a forward-looking tool you can actually use to make decisions.
From Lagging Metrics to Leading Indicators
The future of LTV modeling is all about spotting the leading indicators of churn and expansion. These are often subtle patterns in how people use your product, long before they ever think about their subscription renewal.
AI-driven platforms are built to crunch enormous volumes of user data from every corner of your product, looking for these critical signals. Think about things like:
- Feature Adoption Rates: Are new customers grabbing onto the "sticky" features that you know correlate with long-term value?
- Usage Frequency: Has an account that used to log in daily suddenly gone quiet for a week?
- Support Ticket Themes: Are you seeing a spike in bug reports from a specific customer segment? That's a sign of growing frustration.
When you connect these product behaviors to actual financial outcomes, your LTV model becomes far more dynamic and accurate. You're no longer guessing—you're using data to see which accounts are at risk and which ones are ready to grow. For those looking to build out this capability, it’s worth exploring some of the top predictive analytics software on the market.
Quantifying the Dollar Value of Product Behavior
This predictive approach finally builds the bridge between the product team's daily grind and the company's financial health. Once you can tie specific product signals to revenue, LTV becomes an incredibly powerful product management tool.
Imagine your system flags that users who fail to adopt "Feature X" within their first 14 days are 70% more likely to churn in the next quarter. That's not just a cool data point; it's a fire alarm for your product and onboarding teams.
Key Takeaway: Predictive LTV turns vague user feedback into a prioritized, revenue-driven roadmap. It allows you to answer questions like, "Which bug fix will save us the most ARR this month?" or "Which feature request is most likely to unlock expansion revenue from our enterprise segment?"
This proactive focus on retention is where the magic happens. The relationship between retention and LTV is dramatic; research consistently shows that even tiny improvements in keeping customers create huge financial gains. One of the most-cited findings in SaaS economics is that a mere 5% increase in customer retention can boost profits by 25-95%, depending on the business.
Making LTV an Actionable Product Tool
Ultimately, the goal is to stop reacting to churn and start preventing it before it's even a thought. AI-powered tools can generate a real-time "health score" for every customer based on their behavior, alerting you to risk months before an account is truly in jeopardy. This is a foundational piece of AI-powered decision making for any modern product organization.
This capability gives your teams the power to:
- Prioritize Proactively: Focus engineering time on fixing the issues or building the features that have a quantifiable impact on retaining your most valuable customers.
- Intervene Early: Trigger a helpful onboarding flow or a personal check-in from a CSM the moment an account shows early warning signs of disengaging.
- Identify Expansion Opportunities: Spot power users who are bumping up against usage limits or exploring adjacent features—the perfect signal for an upsell conversation.
By weaving these predictive signals into your process, LTV evolves from a static, historical calculation into a dynamic strategy that actively protects and grows your revenue.
Your SaaS LTV Questions, Answered

Even after you’ve got the formulas down, putting LTV into practice always brings up a few tricky questions. I've been there. Let's walk through some of the most common gray areas I see teams run into, so you can move forward with total confidence.
How Often Should I Calculate LTV?
For most SaaS businesses, hitting a monthly or quarterly rhythm for LTV calculation is the way to go.
A monthly check-in is fantastic for catching new trends as they emerge. It’s your early-warning system—if churn suddenly spikes or ARPA dips, you’ll see it right away and can start digging into the why. This frequency keeps you agile.
On the other hand, a quarterly calculation gives you a more stable, big-picture view by smoothing out any short-term blips. This is the perspective you want for strategic planning, board updates, and longer-term forecasting.
The most important thing? Just be consistent. Pick a schedule and stick with it. That’s the only way you’ll be able to reliably track your LTV:CAC ratio over time and know if you're heading in the right direction.
What Is a Good LTV for a SaaS Company?
This is probably the number one question I get, but it's not quite the right one to ask. A standalone LTV number is pretty meaningless. You could have a 10,000 LTV, but if it costs you ****12,000 to acquire that customer, you have a serious problem.
The metric that actually matters is the LTV to CAC ratio. This is what separates healthy, growing companies from those that are just spinning their wheels.
- A 3:1 ratio is the gold standard. For every dollar you put into sales and marketing, you get three dollars back in lifetime profit. It’s the sign of a sustainable, efficient business model.
- Anything below 1:1 is a red alert. You’re literally paying to lose money on every new customer.
- A ratio above 5:1 might seem amazing, but it can actually be a sign that you're underinvesting in growth. You're likely leaving money on the table by not being aggressive enough with your customer acquisition.
Forget about a single LTV number and focus on keeping that LTV:CAC ratio in the healthy 3:1 range. It's a much better compass for guiding your company's growth.
What Are the Biggest Mistakes When Calculating SaaS LTV?
It’s incredibly easy to get your LTV calculation wrong, and a bad number is often worse than no number at all. I've seen teams make the same handful of mistakes over and over again.
Here are the most common traps to watch out for:
- Forgetting Gross Margin: This is the big one. Using revenue instead of profit will give you a dangerously inflated LTV, leading you to overspend on acquisition because you think you have more margin than you do. Always factor in your cost of goods sold (COGS).
- Using a Blended Churn Rate: A single, company-wide churn rate papers over huge differences in your customer base. Your high-value enterprise accounts and your self-serve SMBs behave differently—they churn at different rates, and your LTV model needs to reflect that reality.
- Ignoring Expansion Revenue: If you're not accounting for upsells, cross-sells, and add-ons (also known as "negative churn"), you are massively underestimating the true value of your best customers. This is a huge blind spot for many companies.
- Calculating Too Early: Don't try to project a multi-year LTV off of just two or three months of data. It’s just not reliable. You need a solid block of historical data before your forecast becomes anything more than a wild guess.
By side-stepping these common errors, you can be sure your LTV calculation is a reliable compass for making smart decisions, not just a vanity metric. The goal is to build a model that reflects the actual financial health of your customer relationships.
Don't let guesswork guide your product strategy. SigOS transforms qualitative customer feedback into a revenue-driven roadmap. Our AI platform analyzes support tickets, sales calls, and usage data to pinpoint the features that will reduce churn and drive expansion, giving you the clarity to build what truly matters. Discover how to prioritize with confidence at sigos.io.


Ready to find your hidden revenue leaks?
Start analyzing your customer feedback and discover insights that drive revenue.
Start Free Trial →