Customer Health Scoring: How to Build and Monitor
Master customer health scoring with a practical framework. Learn feature selection, weighting strategies, validation, and actionable playbooks

A customer health score is a dynamic, multi-signal metric that predicts retention risk and expansion potential by combining usage, support, relationship, and commercial data into one actionable view. Effective customer health scoring isn't about building the most complicated formula. It's about proving that the score identifies risk early enough to change the outcome and triggers a response your team can execute.
The popular advice usually starts with a checklist: collect product activity, add NPS, include support tickets, assign weights, and display the result as green, yellow, or red. That approach produces a dashboard quickly, but it often produces little operational value. A score that looks precise yet misses a customer's deteriorating relationship is still a bad score.
Customer health scoring became widely adopted in SaaS because it turns scattered signals into one predictive metric. Common inputs include engagement, usage, support history, and NPS, often combined into a 0–100 scale or traffic-light system. Industry guidance also shows that health scores are 30% more common in SaaS than in on-premise or services organizations, and that 79% of organizations track them in customer success software while 14% still use spreadsheets. Gainsight's overview of customer health scores provides useful context for how the practice became an operating standard.
Rethinking the Health Score Mindset
Building health scoring as a reporting project is common. Data gets pulled into a dashboard, a formula assigns a color, and customer success managers are expected to interpret the result during account reviews. The problem isn't the dashboard. The problem is that nobody defined what the score should cause a person to do.
A health score should function as an early-warning system, not a report card. Its job is to identify a change in customer behavior or relationship quality early enough for a CSM, support leader, product manager, or executive sponsor to respond. If a score doesn't connect to a renewal risk, expansion opportunity, or customer outcome, it's measuring activity without creating operational advantage.
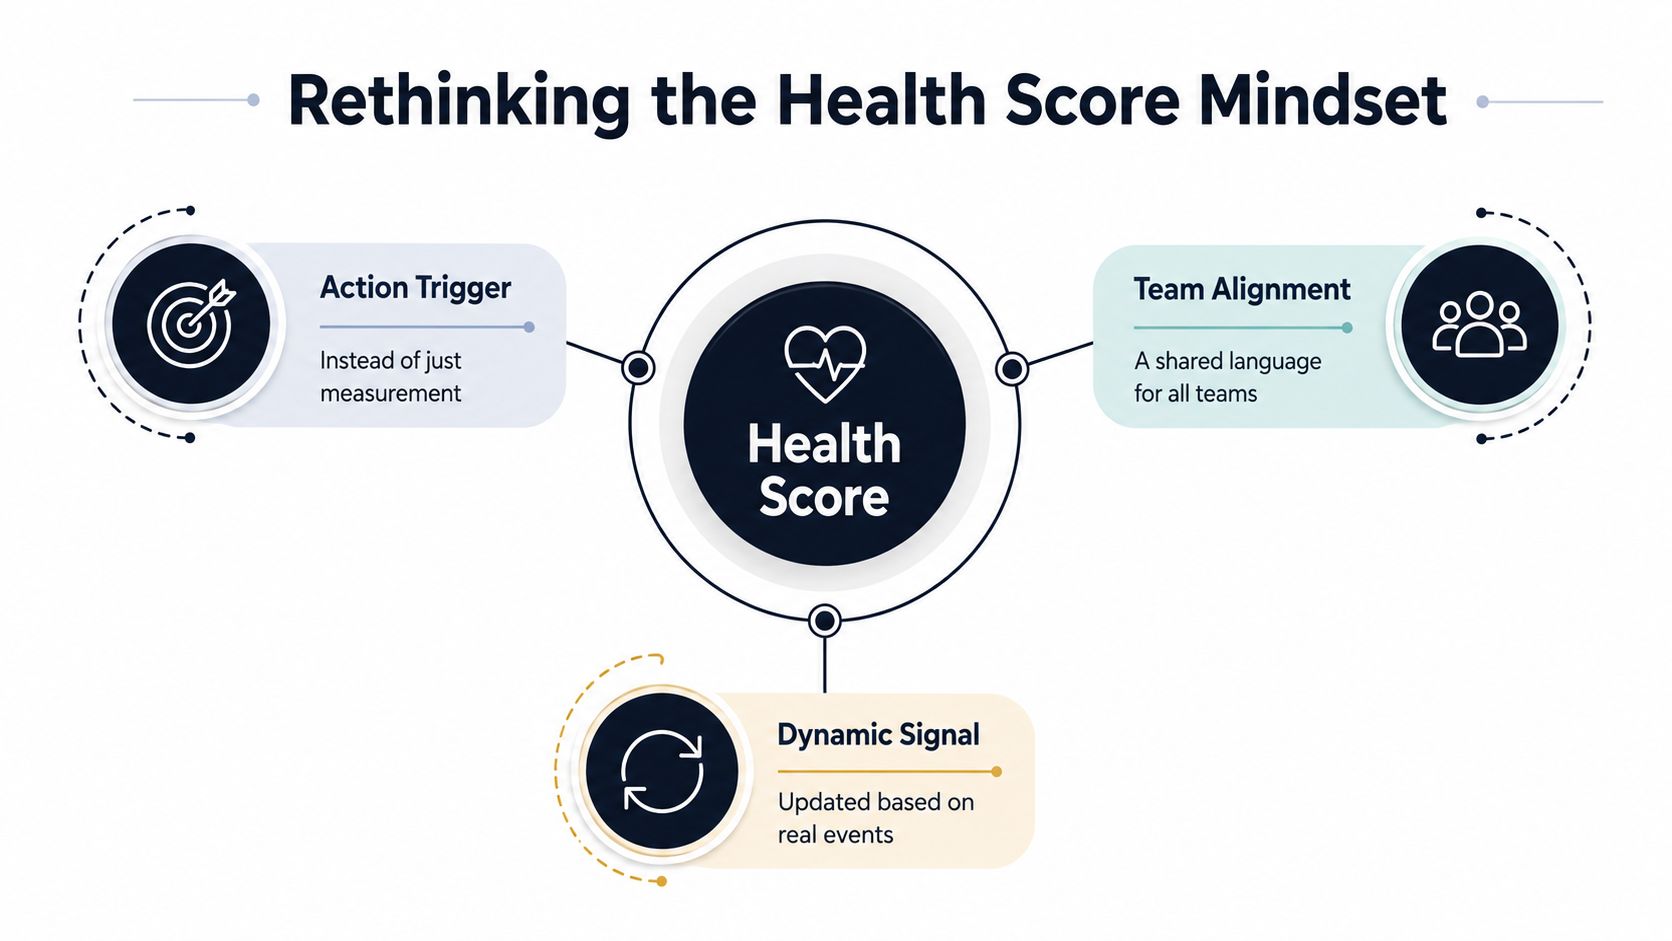
A score is a trigger, not a verdict
A declining score doesn't prove that an account will churn. It tells the team where to investigate. A sudden usage decline might indicate poor adoption, a completed project, seasonal demand, a product defect, or a change in the customer's operating model. The number narrows attention, but people still need to establish the cause.
That distinction changes how teams design the model. Instead of asking, “How can we include every useful signal?” ask, “Which changes should trigger a specific investigation?” This keeps the system explainable and prevents a long list of weak inputs from overwhelming the few signals that consistently matter.
Practical rule: Every health band should have an owner, a response time, and a defined next action. If the team can't describe those three things, the band is only a label.
Complexity doesn't equal prediction
Traditional models often fail because they depend on lagging indicators and subjective inputs. A customer may report dissatisfaction only after the renewal decision has effectively been made. A CSM may mark an account green because conversations feel positive, even though the champion has left and usage is narrowing.
The opposite error is overengineering. Too many inputs make it difficult for CSMs to understand why a score changed, and a score nobody trusts won't influence behavior. Practical guidance recommends keeping the score explainable, segment-aware, and tied to action thresholds, rather than maximizing model complexity. Saber's customer health score guidance also frames health as a formative construct built from relationship quality, product usage, and customer value realization.
Teams should treat the score as a shared language across customer success, support, sales, and product. Behavioral segmentation can help teams interpret the same event differently across customer groups, which is why behavioral segmentation in customer experience belongs in the operating design, not as an afterthought.
Selecting Core Signals and Data Sources
A reliable model starts with the customer outcome, not the data you already happen to have. Define what renewal readiness looks like for each meaningful segment, then identify the signals that appear before that outcome changes.
Product usage is an obvious starting point, but it shouldn't automatically receive the greatest weight. Recent practitioner research argues that relationship strength, transactional history, and commercial context can outperform raw usage telemetry in some segments. A 2025 research summary cites a Nordic B2B SaaS study in which relationship-strength metrics outperformed usage telemetry, while peer-reviewed work on LRFM-style invoice data found that transactional signals can support churn models and that survey-style satisfaction signals may correlate poorly with retention. This research summary on health scores and churn prediction explains the trade-off.
Build the signal inventory
Start by grouping inputs into distinct data buckets. The point isn't to use every bucket equally. It's to understand what each one can and cannot tell you.
- Usage and adoption: Track depth of use across value-driving workflows, not just logins. A customer can remain active while avoiding the feature that produces the promised outcome. Guidance on tracking app usage can help product and success teams distinguish superficial activity from meaningful adoption.
- Relationship strength: Capture champion coverage, executive access, meeting quality, outcome alignment, and changes in stakeholder involvement. These signals are especially important in enterprise accounts where usage may remain stable even as the commercial relationship weakens.
- Support friction: Use ticket severity, escalation patterns, unresolved issues, and changes in support behavior. High volume doesn't automatically mean poor health. A customer asking thoughtful questions may be engaged, while a silent account may have disengaged.
- Commercial context: Include renewal timing, billing behavior, contraction signals, plan fit, procurement changes, and expansion discussions. A healthy usage pattern doesn't remove the risk created by a budget freeze or a lost business sponsor.
- Sentiment and feedback: NPS, CSAT, survey responses, call notes, and qualitative feedback add context. Treat these as evidence to interpret alongside behavior, not as a standalone verdict.
Normalize before you weight
Raw values aren't comparable. One segment might generate many support tickets because it has a large user base, while another might submit fewer but more severe issues. Normalize signals within a relevant cohort, account size, lifecycle stage, or product motion before combining them.
A new customer with limited usage shouldn't be compared directly with a mature customer whose team has settled into a stable workflow. Similarly, an enterprise account with steady adoption may need more relationship and executive coverage in its model than a self-serve account managed primarily through product behavior.
Keep a data dictionary for every input. Record its source, update cadence, direction, missing-value behavior, and interpretation. If a signal changes from positive to negative without explanation, the CSM should be able to trace the change to a real event.
Separate leading signals from context
Leading signals usually change before a renewal decision becomes visible. Examples include declining use of core workflows, a champion going quiet, an unresolved critical issue, or a new procurement constraint. Lagging signals, such as a missed renewal or a formal downgrade, confirm the outcome but arrive too late to drive prevention.
Use outcome data to test the distinction. A signal belongs in the model because it helps identify risk or growth, not because it's easy to export from a CRM. If the model is green across the portfolio while renewal conversations repeatedly reveal hidden dissatisfaction, the data selection is wrong, even if the dashboard is technically accurate.
Designing and Implementing the Model
A health score fails when its formula becomes more impressive than its decisions. Build it around four practical choices: collect usable data, select signals that explain outcomes, weight them by segment, and set thresholds that trigger specific work. The goal is calibrated action and evidence of predictive power, not mathematical complexity.
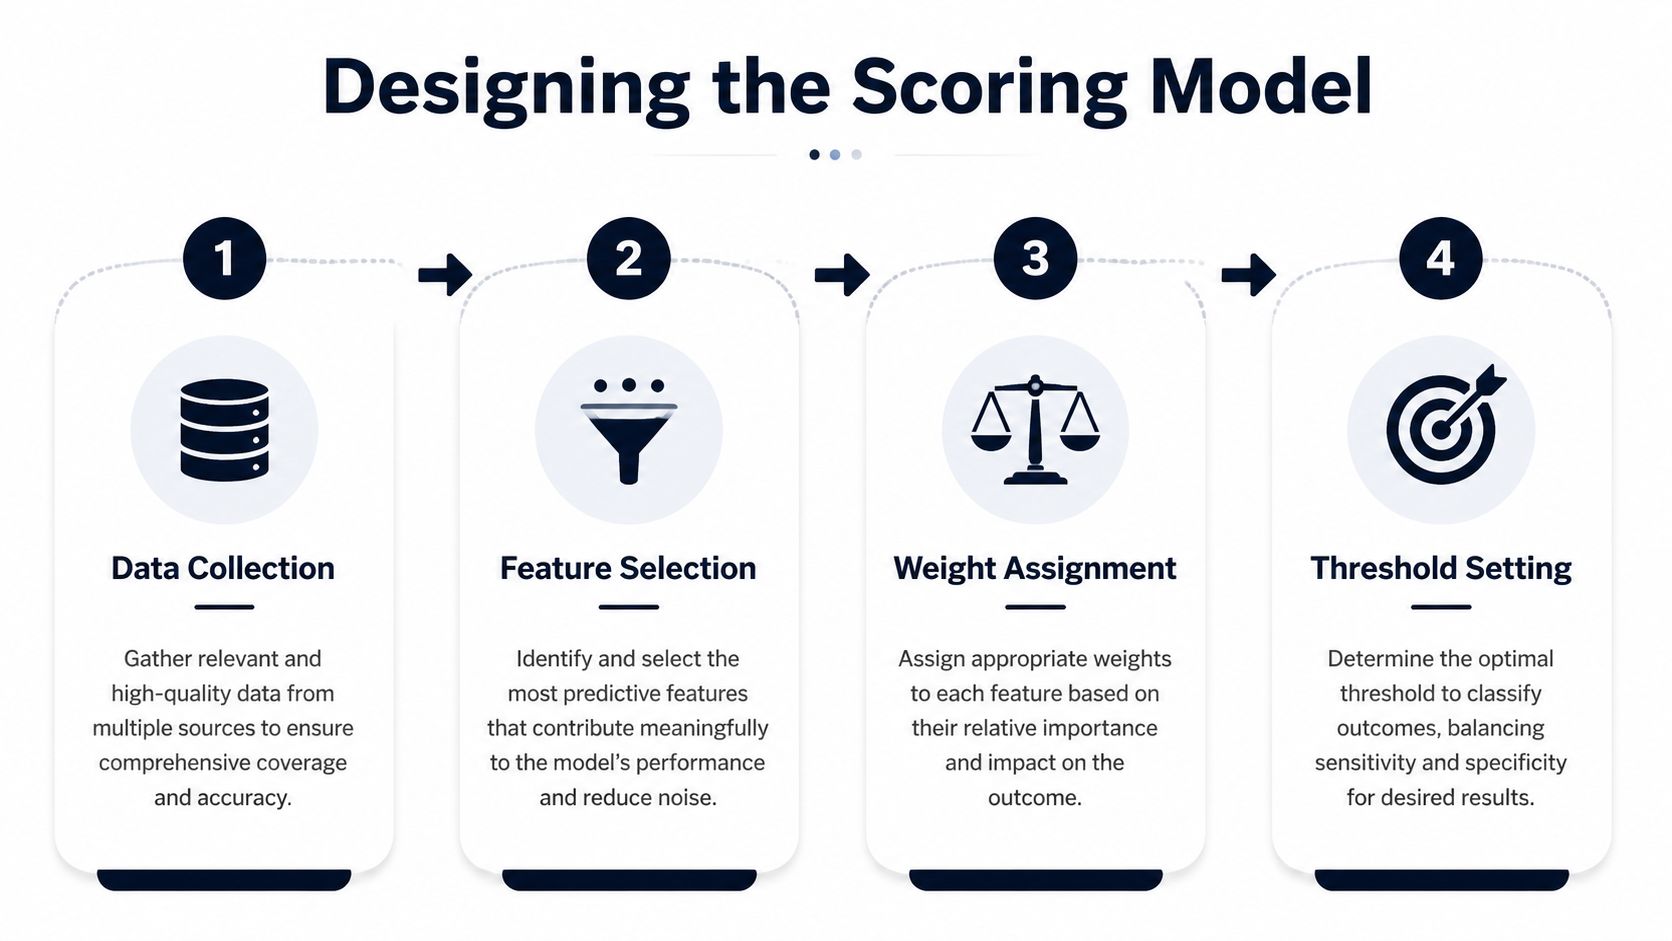
Start with a transparent formula
Normalize each signal onto a common scale, then combine the signals with weights that reflect the customer segment and business motion. A practical structure can include usage depth, breadth of adoption, support risk, sentiment, and commercial momentum. Let observed retention and churn outcomes shape the weighting instead of copying a standard template.
A CSM should be able to explain the calculation to a customer-facing colleague. “The score declined because core workflow adoption fell and an unresolved support issue remained open” supports action. “The model's latent feature vector shifted” does not.
Keep the feature set disciplined. Remove inputs that duplicate one another, change unpredictably because of instrumentation problems, or fail to separate retained accounts from churned accounts. A smaller score with clear evidence is easier to calibrate and defend than a broad score that creates false confidence.
Teams building predictive systems should distinguish a rules-based score from a predictive model. The explanation of how automated lead scoring works offers a useful comparison for signal aggregation, weighting, and automated prioritization.
Segment before setting thresholds
One weighting scheme rarely fits every customer motion. Enterprise customers, self-serve accounts, new implementations, and mature deployments can show different healthy behaviors. A low-login account may be stable because its workflow runs in a back-office process, while the same pattern in a high-frequency product may signal immediate risk.
Use separate score logic when adoption patterns, relationship structures, contract dynamics, or lifecycle expectations differ. Do not create a separate model for every niche. Begin with segments that have materially different operating conditions, then test whether the split improves warning quality.
A common operating convention places accounts in Healthy at 71–100, At Risk at 31–70, and Critical at 0–30. Treat these bands as a starting convention, not evidence that identical cutoffs fit every business.
Make thresholds operational
A threshold matters only when it changes behavior. A Critical account might trigger an investigation and executive review. An At Risk account might enter a structured recovery plan. A Healthy account might stay on the standard cadence unless commercial signals indicate expansion readiness.
Show the score with its drivers, direction of travel, recent events, and assigned owner. The number alone hides whether risk comes from declining adoption, support friction, weak relationships, or commercial pressure. Each threshold should have an owner, a response time, and a defined next action.
For an implementation focused on churn prediction rather than dashboard design, predictive churn modeling provides relevant context. The model should serve the workflow, while later validation tests whether its warnings correspond to real outcomes.
Validating and Monitoring Performance
A health score without validation is a hypothesis presented as a measurement. The most important review isn't whether most accounts are green. It's whether the score identified accounts that later churned, early enough for a useful intervention.
The practical workflow is straightforward. Validate the model quarterly by backtesting churned accounts, then inspect the score each account held 90 days before churn. One implementation guide recommends judging usefulness by whether the score flags a large share of eventual churners in that window, with a workable target of about 75% to 80% true positive detection while keeping false positives manageable. Inveo's customer health score implementation guide describes this validation approach.
Measure warning coverage
Create a review cohort containing accounts with known churn outcomes. For each account, retrieve its historical score and the contributing signals at the selected pre-churn point. Then compare the accounts flagged as At Risk or Critical with those that churned.
Track four questions:
- Coverage: How many eventual churners received an actionable warning?
- Timing: Did the warning arrive early enough for the assigned playbook?
- Precision: How many flagged accounts represented meaningful risk rather than normal variation?
- Explainability: Could the team identify the event that caused the alert?
A model that flags nearly everyone may achieve broad coverage while exhausting the team with false alarms. A model that keeps the portfolio green may feel reassuring while missing the accounts that need help. Calibration means finding a useful balance for the available team capacity and intervention motion.
A green portfolio isn't evidence of customer health. It may be evidence that the thresholds are too generous.
Recalibrate the living system
Scores drift. Product instrumentation changes, customer segments evolve, pricing and packaging shift, and support behavior changes as teams mature. A static rule set gradually stops representing the customer experience that produced the original data.
Refresh the review with new churn cohorts, then inspect whether the same signals still lead outcomes. Revisit weights and thresholds by segment rather than applying one portfolio-wide adjustment. If enterprise relationship signals are losing relevance but billing friction is increasing, the model should reflect that change.
Industry commentary identifies calibration and actionability as the central gap in many programs. It also reports that only 22% of organizations use AI-driven predictive models today, which suggests that the unresolved question isn't how to assemble a score. It's how to prove that the score predicts outcomes and triggers the right action at the right time. Statisfy's analysis of health scores and churn prediction makes that distinction explicit.
For adjacent thinking about using predictive data in operational decisions, Bridge Global's healthtech data strategy discussion offers useful context. The domain differs, but the principle transfers: monitoring performance requires a feedback loop between predictions, actions, and observed outcomes.
Executing Playbooks for Risk and Growth
The same score can point to two very different operating decisions. A declining account needs diagnosis and value recovery. A strong account may need an expansion conversation, deeper adoption, or an advocacy request. Treating both as generic “outreach” wastes the signal.
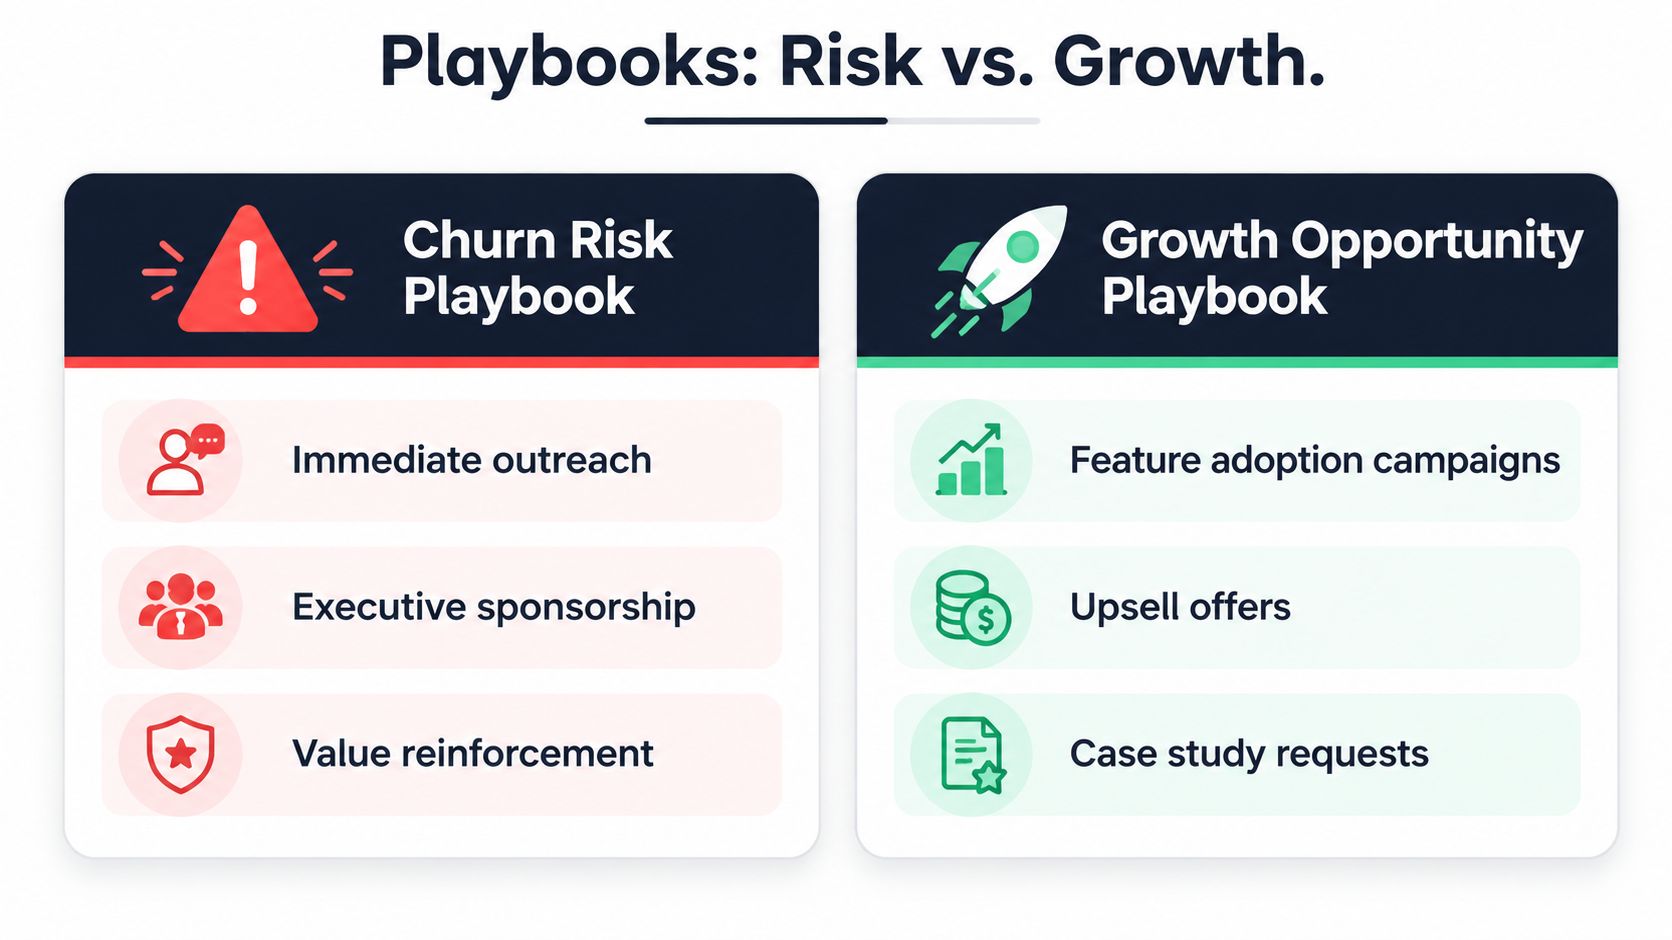
Churn risk requires diagnosis
When an account enters a risk band, don't send a generic check-in email and mark the task complete. First identify the driver. The response should differ depending on whether the score moved because of adoption decline, unresolved support friction, relationship loss, or commercial pressure.
A risk playbook might include:
- Immediate investigation: Review the score drivers, recent tickets, product events, call notes, and stakeholder changes.
- Named ownership: Assign one person to coordinate customer success, support, product, and sales activity.
- Value reinforcement: Connect the product to the customer's intended outcomes, then document a recovery plan with observable milestones.
- Executive sponsorship: Use leadership involvement when the issue affects strategic alignment, renewal authority, or a major unresolved failure.
- Escalation discipline: Set a clear handoff when the customer doesn't respond, the issue remains unresolved, or the renewal risk becomes commercial.
The score should create a case with context, not just an alert. A CSM needs to see what changed, why it matters, and what action is expected.
Growth requires evidence of readiness
Healthy accounts shouldn't automatically receive an upsell pitch. Strong health means the customer is positioned to discuss growth, not that they've already expressed a buying intent. Look for breadth of adoption, repeated use of value-driving capabilities, additional teams entering the workflow, executive interest, or commercial momentum.
A growth playbook might include:
- Adoption campaign: Introduce a relevant feature or workflow that extends value for an already engaged team.
- Opportunity review: Confirm the customer has a use case, budget context, and internal sponsor for expansion.
- Customer proof: Ask for a reference, testimonial, or case study only after the customer has demonstrated a meaningful outcome.
- Account planning: Coordinate CSM and sales activity so the expansion conversation follows customer value rather than interrupting it.
Connect bands to capacity
Critical accounts deserve deeper intervention than accounts showing mild risk. Healthy accounts can often receive scalable education, targeted product recommendations, or commercial discovery. The routing logic should reflect the team's actual capacity, otherwise every alert becomes urgent and none receives the attention it requires.
The most useful playbooks specify the trigger, owner, deadline, evidence to review, customer-facing action, and exit condition. An account shouldn't leave the risk workflow merely because someone contacted it. It should leave when the underlying risk driver improves or the commercial outcome becomes clear.
Integrating Scores into Daily Workflows
A health score becomes useful when teams encounter it where work already happens. A CSM shouldn't need to open a separate analytics tool, search through support tickets, and inspect product activity before deciding whether an account needs attention.

Consider a support escalation. The support lead sees the account's current health, its recent trend, open issue severity, and relationship owner beside the ticket. A critical issue on a stable account may need a fast product response. The same issue on an account with declining adoption and weak champion coverage may require coordinated executive attention.
Product managers need a different view. They should see which recurring issues appear across at-risk accounts, which feature gaps affect expansion-ready customers, and where customer feedback aligns with usage changes. Customer success operations can turn score movements into tasks in Salesforce, HubSpot, Jira, Linear, Zendesk, or Intercom, provided each automation includes an owner and useful context.
For teams that need to connect qualitative feedback with usage and commercial signals, SigOS can ingest support tickets, chat transcripts, sales calls, and usage metrics, then surface patterns related to churn, expansion, and revenue impact. It can also create issues through integrations with tools such as Zendesk, Intercom, Linear, Jira, and GitHub.
The workflow should feel like this: an event changes the score, the system explains the change, the correct team receives a task, and the outcome feeds the next validation cycle. That closes the loop between customer intelligence and daily execution.
A short visual explanation can help teams align on how health signals move from detection to action:
Start with a small set of high-confidence signals, validate them against real churn outcomes, and connect every threshold to a playbook. Then visit SigOS to see how an AI-driven product intelligence workflow can turn customer feedback and behavior into prioritized actions for retention and expansion.
Keep Reading
More insights from our blog



Ready to find your hidden revenue leaks?
Start analyzing your customer feedback and discover insights that drive revenue.
Start Free Trial →