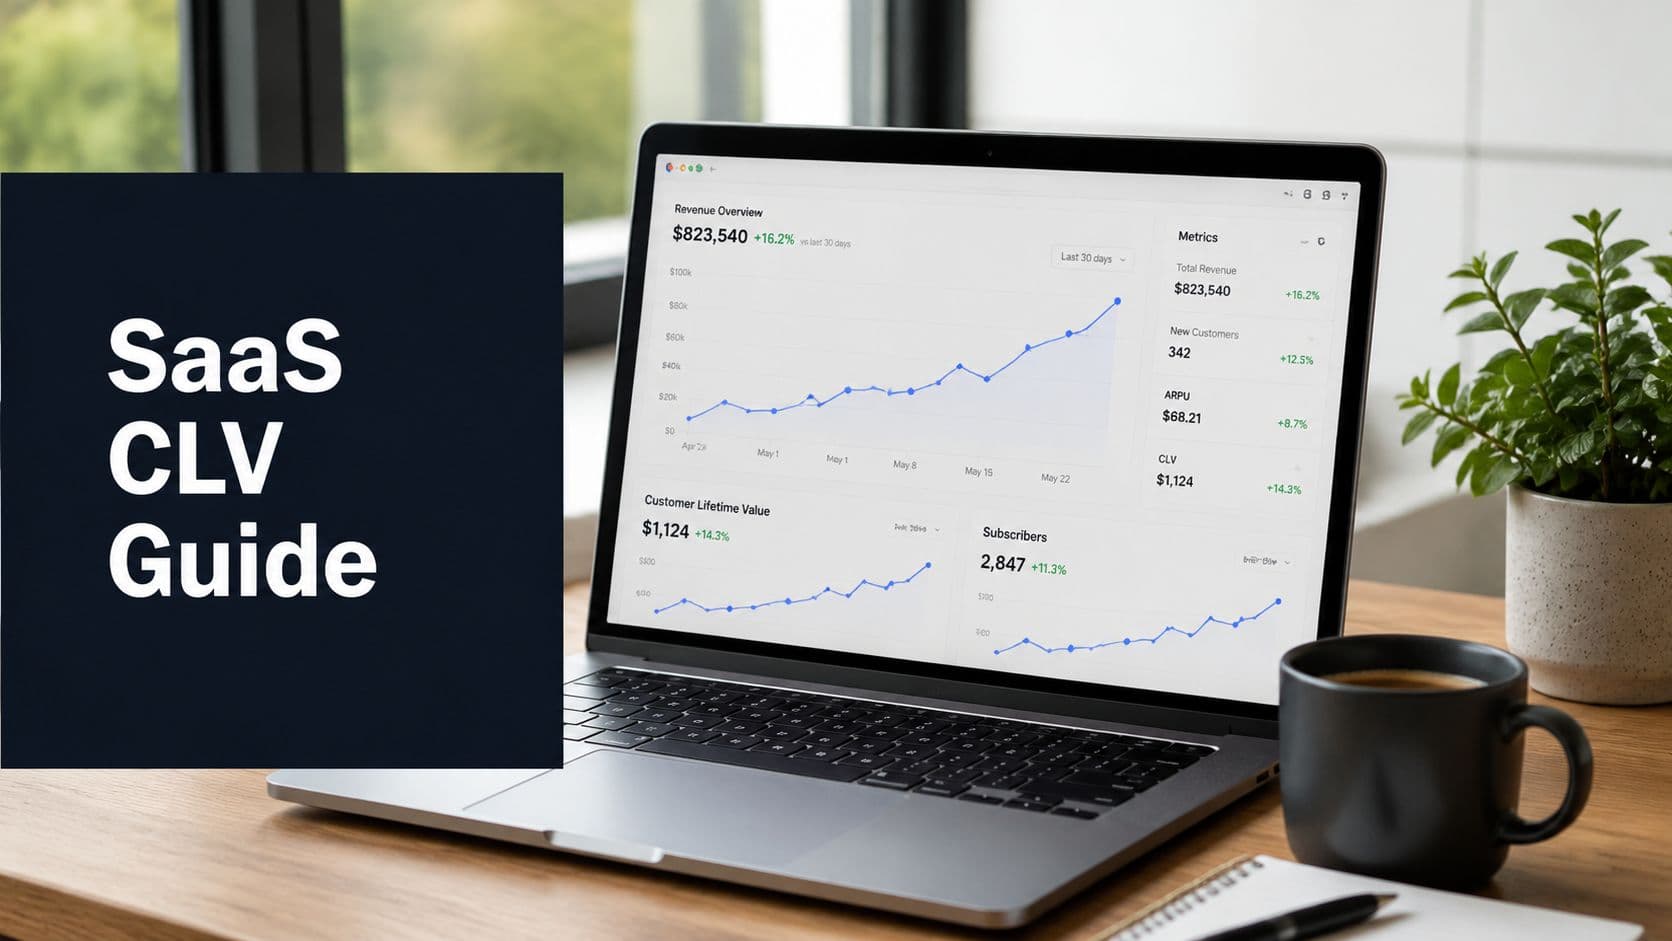
Unlock SaaS Growth: Customer Lifetime Value Analysis
Unlock SaaS growth with customer lifetime value analysis in 2026. Learn to calculate, predict, & leverage CLV with behavioral data to prioritize your roadmap.
Most advice about customer lifetime value analysis starts with the formula. That's useful, but it also creates the wrong habit. Teams calculate CLV once a quarter, drop the number into a board deck, and move on. Then they wonder why the metric never changes product decisions.
In SaaS, that approach is too slow and too blunt. By the time revenue tells you a segment is weakening, the product signals that caused the decline have usually been visible for weeks. Support friction, failed onboarding steps, poor feature adoption, and account-level disengagement all show up before downgrade or churn does.
The primary purpose of customer lifetime value analysis isn't to produce a tidy historical average. It's to connect customer behavior to future revenue so product, growth, and success teams can act while there's still time to change the outcome.
Moving Beyond the Basic CLV Formula for SaaS
Customer lifetime value became a standard business metric because it shifts attention from single transactions to the full economic relationship with a customer. The basic formula is straightforward: CLV = customer value × average customer lifespan (Stripe's overview of customer lifetime value). That's the right starting point.
It just isn't enough for most SaaS companies.
A simple formula works best when customer behavior is stable and the relationship is easy to summarize. SaaS rarely looks like that. Revenue changes through renewals, expansion, contraction, seat growth, pricing changes, and usage patterns that affect both retention and support burden. Two accounts with the same subscription price today can have very different future value depending on what they've adopted and how much effort it takes to keep them healthy.
Why the basic formula breaks down in practice
The standard CLV formula tells you what a customer relationship is worth in principle. It doesn't tell you whether the value is strengthening or deteriorating right now.
That gap matters because product teams don't work in hindsight. They decide what to fix this sprint, what to ship next quarter, and which requests deserve engineering attention. A static CLV number can support planning, but it won't help much with daily prioritization unless it's tied to behavior.
A customer isn't “high value” because finance labeled them that way last quarter. They're high value if their current behavior suggests they'll keep generating profitable revenue.
In SaaS, the distinction between historical CLV and a more forward-looking view is where the metric becomes useful. Historical CLV is descriptive. It shows what happened. Operational CLV is directional. It helps teams ask whether current usage, engagement, and service patterns point toward retention, expansion, or decline.
Treat CLV as a live account signal
The strongest teams use CLV less like a finance KPI and more like a product decision layer. They still calculate the baseline. They still care about revenue per account and customer lifespan. But they don't stop there.
Instead, they ask:
- Which behaviors precede renewal strength so those behaviors can be reinforced in onboarding and product design.
- Which friction points show up before churn risk so support and product teams can intervene earlier.
- Which features correlate with durable accounts so roadmap bets focus on value creation, not just request volume.
- Which accounts look large on revenue but expensive to maintain so the business doesn't confuse top-line size with healthy lifetime value.
If you want a useful external primer on analyzing customer value for SaaS businesses, that resource is worth reviewing. The important shift is mindset. Don't treat CLV as an accounting artifact. Treat it as a model of the customer relationship that product teams can influence.
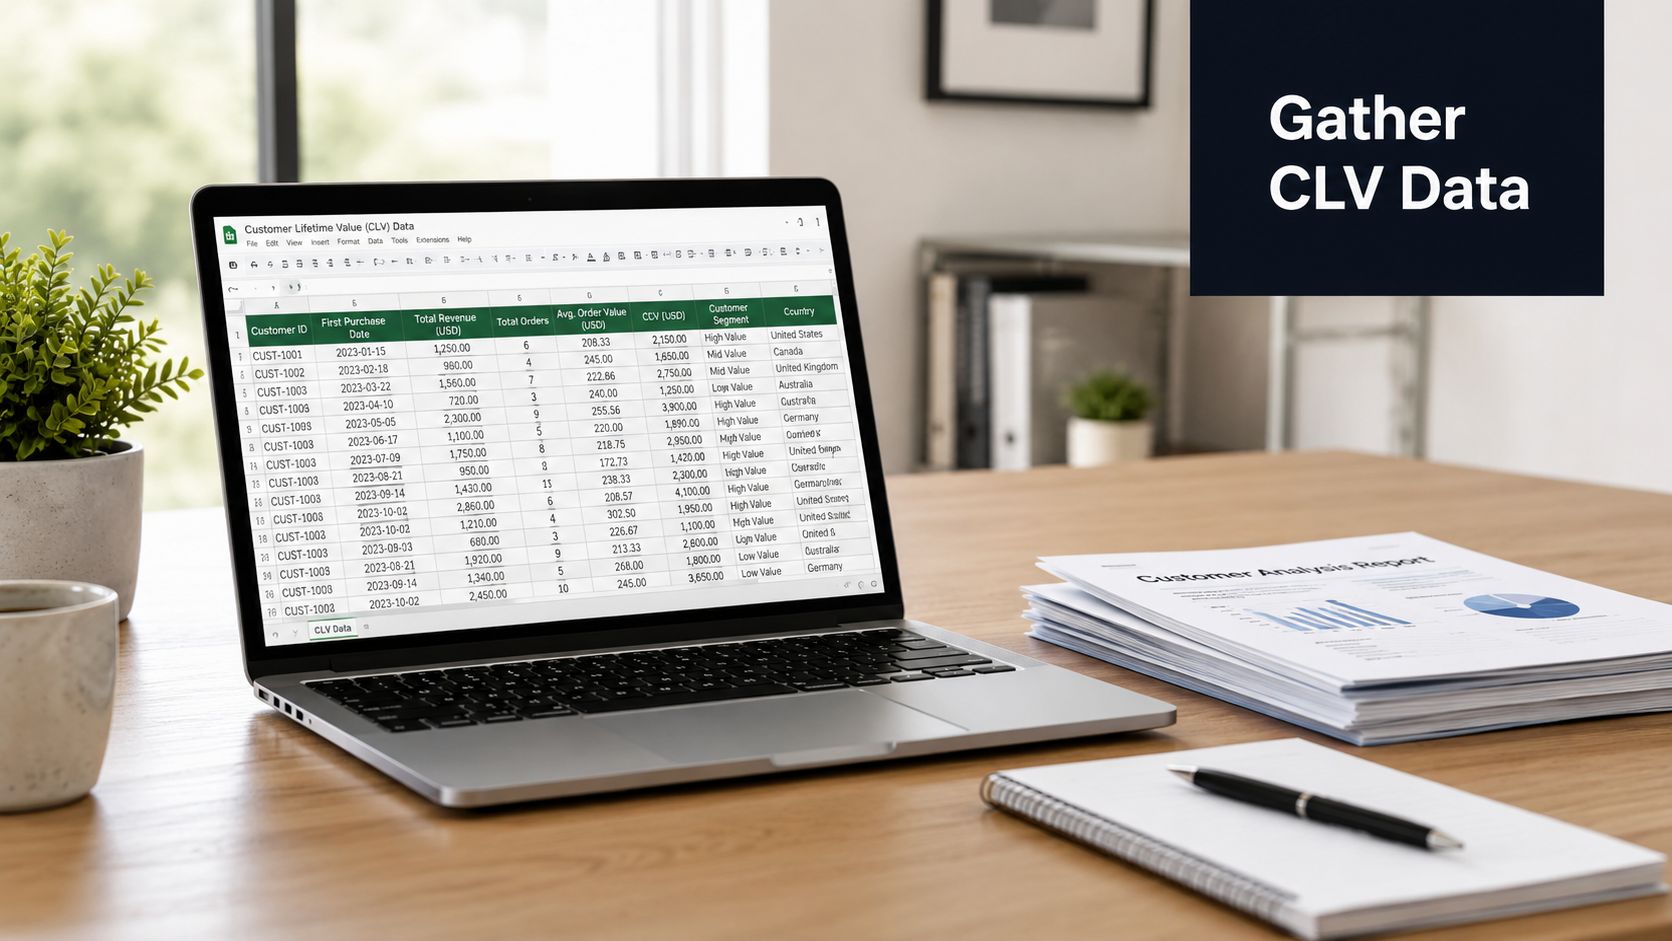
Gathering and Preparing Your CLV Data Sources
Most customer lifetime value analysis projects fail long before modeling. They fail in the joins.
SaaS data lives in different systems for good reasons. Stripe or Chargebee holds billing truth. Salesforce or HubSpot stores account and opportunity context. Amplitude, Mixpanel, PostHog, or your warehouse captures product usage. Zendesk, Intercom, and Gong hold the qualitative signals that often explain why value rises or falls. If those records don't resolve to the same customer entity, your CLV work becomes a spreadsheet exercise with false precision.
Start with a master customer record
Before calculating anything, define what counts as the customer record of truth. In B2B SaaS, that usually means an account-level entity with linked users, contracts, product events, and service interactions.
A workable master record should include:
- Billing attributes such as plan history, invoice status, renewals, cancellations, upgrades, downgrades, and discounts from tools like Stripe, Chargebee, or Recurly.
- CRM context including segment, owner, deal source, contract terms, and expansion notes from Salesforce or HubSpot.
- Product usage signals such as activation milestones, feature adoption, session patterns, workspace activity, and admin behavior from Amplitude, Mixpanel, or warehouse events.
- Service and feedback data from Zendesk, Intercom, support email, call transcripts, or NPS systems.
- Cost-related fields that help you estimate whether a high-revenue account is also expensive to support.
If your IDs don't line up, stop and fix that first. You can't build reliable CLV by merging on company name and hoping for the best.
Clean the data before you model it
This is the part teams rush, and it's why their outputs aren't trusted.
Three issues show up constantly:
- Conflicting customer IDsThe billing account, CRM account, and product workspace often use different identifiers. Build a mapping table and maintain it. Don't solve this ad hoc in every query.
- Missing lifecycle eventsContract start dates, churn dates, plan changes, and account merges are often incomplete. If a cancellation happened in billing but never reached the warehouse, your retention view is wrong.
- Inconsistent event definitions“Active user,” “adopted feature,” and “healthy account” can mean different things across teams. Lock those definitions before you compare segments.
Practical rule: A mediocre model on clean, trusted data beats a sophisticated model built on account records no one believes.
Strong data hygiene pays off outside CLV too. If your team needs a broader read on data quality for a healthier pipeline, that framing applies directly here. Product strategy falls apart when core customer records are fragmented.
A useful internal checkpoint is to review common data quality issues that break analytics workflows. Most of the mistakes in CLV analysis aren't mathematical. They're operational.
Build for repeatability, not one-off analysis
Don't make customer lifetime value analysis dependent on an analyst manually exporting CSVs at month-end. Create a repeatable pipeline with clear ownership.
A practical setup includes:
| Data source | What to pull | Why it matters for CLV |
|---|---|---|
| Billing system | Subscription changes, invoices, renewals, cancellations | Establishes revenue history and relationship duration |
| CRM | Segment, source, account owner, sales notes | Adds commercial context to value differences |
| Product analytics | Activation, feature usage, engagement trends | Surfaces leading indicators before revenue changes |
| Support systems | Ticket volume, themes, escalations | Reveals friction and cost to serve |
| Data warehouse | Unified model and customer record | Makes the analysis durable and auditable |
When this foundation is stable, CLV stops being a special project. It becomes a dependable layer in product and revenue decision-making.
From Simple Calculation to Predictive CLV Models
The cleanest way to think about customer lifetime value analysis is as a maturity curve. You don't jump straight to predictive modeling because it sounds advanced. You start with the simplest model that helps you make a better decision, then increase sophistication when the extra complexity earns its keep.
A rigorous workflow begins by segmenting customers into cohorts, then measuring each cohort's average order value, purchase frequency, and retention duration before projecting future revenue. More advanced approaches move from historical CLV to cohort and predictive CLV depending on the goal (Contentsquare's guide to CLV analysis).
Historical CLV as a baseline
Historical CLV is the practical starting point. It tells you what customers or segments have been worth so far based on actual transaction and retention history.
This approach is useful when you need to answer straightforward questions:
- Which acquisition channels have produced the most valuable accounts?
- Which plan tiers tend to create stronger long-term relationships?
- Which customer segments have underperformed despite strong top-of-funnel conversion?
Historical CLV is easy to explain internally, and that matters. Finance, product, and growth teams are more likely to trust a model they can understand.
Its weakness is timing. Historical CLV is backward-looking by design. It ranks the past well, but it often reacts too late to support roadmap decisions.
Cohort-based CLV for pattern detection
Cohort analysis is where customer lifetime value analysis becomes much more useful for SaaS operators. Instead of averaging everyone together, you group customers by a meaningful starting point, often signup month, plan, acquisition source, or onboarding path, then compare how each cohort behaves over time.
That reveals patterns aggregate metrics hide.
A flat overall average can mask a recent quality drop in new customers. It can also hide improvement. If a redesigned onboarding flow produced stronger retention in newer cohorts, a blended CLV number might bury the signal for months.
Cohorts answer the question averages avoid. Are we getting better at creating valuable customers, or just living off old ones?
For product teams, cohort-based CLV is often the sweet spot. It's much more informative than a simple average and much easier to operationalize than a custom machine learning stack.
If you want a quick companion tool for rough estimation, this guide to calculate customer lifetime value can be helpful as a sanity check. It shouldn't replace a cohort view, but it can help teams align on inputs before building something deeper.
Predictive CLV for forward decisions
Predictive CLV uses historical and behavioral signals to estimate future value. In SaaS, that usually means adding product usage, engagement changes, service interactions, and account-level context to the model.
The point isn't to make a perfect forecast. The point is to improve decisions before the financial outcome is locked in.
Predictive CLV becomes worth the effort when you need to answer questions like:
- Which recently signed accounts are likely to become strong long-term customers?
- Which seemingly healthy customers are drifting toward churn?
- Which accounts are candidates for expansion based on current adoption patterns?
- Which support-heavy customers produce weak profitability despite decent revenue?
Predictive churn work often overlaps with CLV. If your team is already modeling retention risk, a resource on predictive churn models can help connect those methods to value forecasting.
Comparison of CLV Calculation Methods
| Method | Best For | Pros | Cons |
|---|---|---|---|
| Historical CLV | Baseline reporting, segment ranking, quick business reviews | Easy to calculate, easy to explain, grounded in actuals | Backward-looking, weak for early intervention |
| Cohort-based CLV | Product changes, onboarding evaluation, channel comparison | Shows behavioral differences over time, surfaces trend shifts | Needs cleaner segmentation and more disciplined tracking |
| Predictive CLV | Prioritization, churn prevention, expansion planning | Uses current signals to estimate future value, supports earlier action | More complex, requires unified behavioral and commercial data |
Choose the model that fits the decision
The mistake isn't using a simple model. The mistake is using a simple model for a complex decision.
If you're reporting account economics to leadership, historical CLV may be enough. If you're comparing onboarding changes across signup months, use cohorts. If you're deciding whether to fix a workflow bug that affects expansion-ready accounts, predictive CLV is the better tool because the damage may not have shown up in revenue yet.
That's the progression that works. Start with a baseline. Add cohorts when averages stop being useful. Add predictive signals when timing becomes the main constraint.
Connecting Behavioral Signals to Future Revenue
Most SaaS teams already collect the signals that matter for customer lifetime value analysis. They just don't connect them to revenue soon enough.
Product usage drops. Support tickets spike. Admins stop inviting teammates. A feature gets tried once and never touched again. Customer success hears the same complaint across renewals. None of those events is revenue on its own. But together they often tell you where future CLV is moving.
Modern CLV is shifting from retrospective estimates to continuously updated decision support using churn rates and behavioral signals. It also needs to be paired with cost to serve so teams don't overvalue high-revenue but expensive accounts (CMSWire's discussion of modern CLV).
Which signals matter most
The useful signals are the ones that change before account value changes. They usually fall into a few buckets.
- Adoption signalsCore workflow completion, repeated use of sticky features, team invites, admin setup depth, and cross-functional usage. These often indicate whether the account is embedding the product into real work.
- Friction signalsReopened tickets, repeated complaints on the same workflow, usage stalls after onboarding, failed imports, unresolved bugs, and rising escalation patterns.
- Commercial signalsSeat utilization, dormant paid users, delayed rollout to additional teams, plan downgrade behavior, or stalled expansion conversations.
- Service load signalsAccounts that require constant manual intervention may still look valuable on booked revenue, but the economics can deteriorate once support and success effort are considered.
Turn events into operational CLV inputs
A practical way to use behavioral data is to create account-level indicators that update frequently enough to influence action. Don't wait for a quarterly recalculation.
For example, product and customer success teams can track:
| Behavioral signal | What it may indicate | Operational response |
|---|---|---|
| Drop in usage of a core workflow | Weakening product fit or adoption decay | Trigger account review and examine recent product friction |
| Repeated support tickets on one feature | Feature instability or poor UX | Prioritize fix if linked to valuable or at-risk segments |
| Expansion feature used by only a small subset of an account | Untapped growth blocked by onboarding or UX | Improve enablement and reduce setup friction |
| High revenue plus high support burden | Inflated CLV if service cost is ignored | Reassess profitability and service model |
The key is correlation, not storytelling. Don't assume a noisy support account is always a churn risk. Some high-engagement customers generate lots of feedback because they care a great deal and plan to expand. Look for repeated patterns across segments, then validate them against retention and revenue outcomes.
Some behaviors are loud but harmless. Others look small and quietly destroy future value. Good CLV work separates the two.
What not to do
A few habits make behavior-driven CLV useless:
- Counting activity instead of meaningful usageLogins alone rarely tell you much. Focus on actions tied to value realization.
- Treating all customers as interchangeableThe same product behavior can mean different things for a startup account and an enterprise rollout.
- Ignoring support and success effortRevenue-heavy accounts can still be poor long-term bets if they consume disproportionate service capacity.
- Running the analysis too slowlyIf usage changed weeks ago and your model updates monthly, the operational value drops fast.
Later in the workflow, it helps to show these relationships visually so teams can review them together. A short explainer can help frame that discussion:
Use behavior to sharpen product judgment
The point of this analysis isn't just prediction. It's prioritization.
If feature adoption predicts stronger renewals, product teams should protect that path. If unresolved ticket themes correlate with value loss in important segments, those issues deserve more urgency than a long list of low-impact requests. If an account's revenue looks strong but support load is climbing, teams should ask whether the product is scaling cleanly or whether they're subsidizing the relationship with human effort.
That's when customer lifetime value analysis stops being descriptive. It becomes operational.
How to Prioritize Your Roadmap with CLV Analysis
Roadmap debates usually get stuck between volume and value. One side argues for the feature requested by the most customers. The other argues for the issue affecting the loudest accounts. CLV gives you a better filter. It helps you ask which work is most likely to protect or increase the value of the customer base you want.
That matters because retention has significant economic impact. Improving retention by just 5% can raise profits by 25% to 95%, while retaining customers is typically 5 to 7 times cheaper than acquiring new ones. Many teams also use the 3:1 LTV:CAC ratio as a benchmark, aiming for roughly **3 of lifetime value for every **1 spent on acquisition (Improvado's CLV guide).
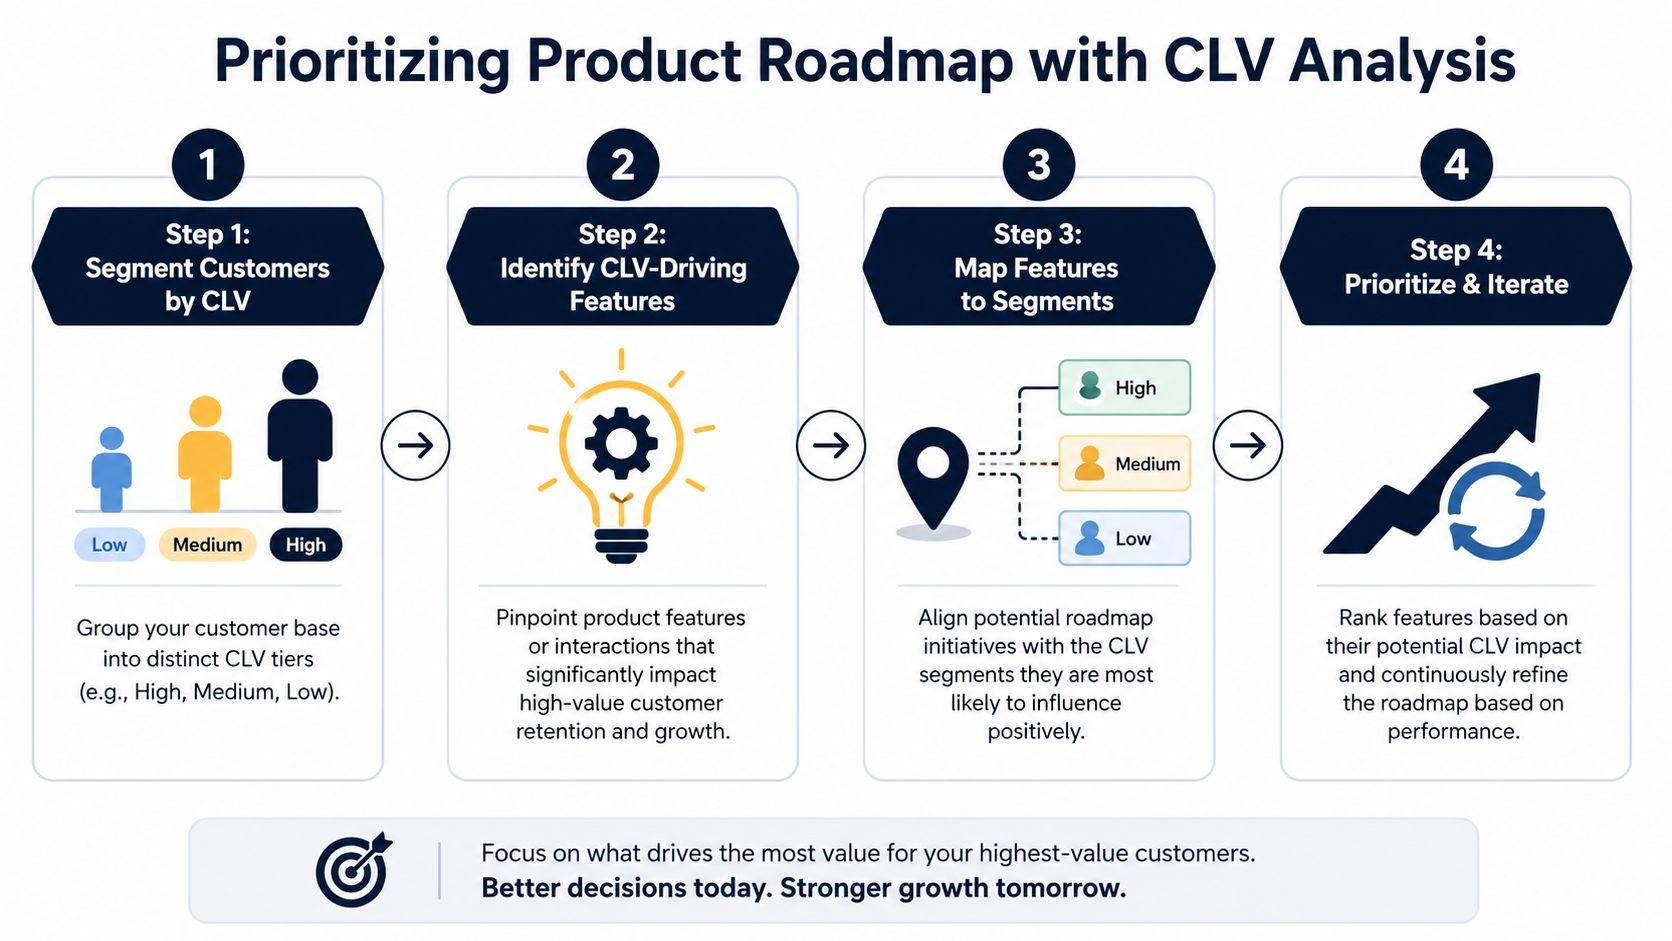
Prioritizing Product Roadmap with CLV Analysis
A practical CLV-led roadmap process looks like this:
- Segment customers by value profileDon't stop at one company-wide average. Separate accounts into meaningful CLV tiers and keep segment logic visible to product, support, and success teams.
- Identify the product behaviors linked to stronger accountsLook for the features, workflows, and onboarding actions that repeatedly show up in durable, expandable relationships.
- Map candidate roadmap items to the segments they influenceA bug that affects a small number of high-value accounts may deserve more urgency than a broadly requested cosmetic enhancement.
- Review outcomes and adjust Prioritization shouldn't be fixed. Once an issue is addressed, monitor whether the targeted segment improves.
A better way to compare roadmap trade-offs
Use CLV to structure the decision, not to replace judgment.
Here's how that plays out in real product conversations:
- Bug fix vs new featureIf a bug disrupts a workflow used by customers with strong renewal and expansion potential, fixing it can be more valuable than shipping a popular request from low-commitment users.
- Enterprise request vs SMB volumeIf enterprise accounts drive stronger lifetime economics and the requested capability removes a real adoption blocker, it may outrank a larger pile of lower-value asks.
- Onboarding improvement vs acquisition supportIf poor activation is suppressing future CLV, better onboarding can outperform work aimed purely at top-of-funnel growth.
Product teams don't need CLV to tell them what customers want. They need it to judge which wants are worth building first.
Keep CLV from distorting the roadmap
CLV can improve prioritization, but teams can misuse it.
Watch for these traps:
- Overfitting the roadmap to current high-value accountsThat can protect present revenue while starving the product of future market expansion.
- Ignoring strategic betsSome roadmap work matters because it opens a new segment or category, not because current CLV data can prove it yet.
- Using static tiers for too longValue shifts. Segments should be reviewed as behavior and product fit evolve.
A structured framework helps. If your team already uses a scoring approach, this guide to a feature prioritization matrix is a solid complement. CLV should inform prioritization criteria, not become a blunt override.
The best roadmap discussions get more disciplined after CLV enters the room. Not because every decision becomes mathematical, but because teams finally have a shared way to link product work to revenue quality instead of request volume alone.
Making CLV an Operational Rhythm
Customer lifetime value analysis becomes powerful when it stops living in a slide deck.
The change is less about math than operating cadence. Teams need a rhythm where product, growth, support, and success review the same account signals, the same behavioral shifts, and the same value assumptions often enough to act on them. That rhythm can be weekly for product triage, monthly for segment reviews, and quarterly for broader planning. What matters is that CLV isn't trapped inside finance reporting.
What an operational rhythm looks like
A useful cadence usually includes:
- Weekly review of behavior changesLook for sudden drops in adoption, recurring ticket themes, and friction in critical workflows.
- Monthly segment health checksCompare how key cohorts and CLV tiers are moving. Review whether recent product changes improved the intended segment.
- Quarterly model refreshRevisit assumptions, validate whether behavioral indicators still predict future value, and adjust scoring logic if customer behavior has shifted.
This doesn't require perfection. It requires consistency.
What works and what doesn't
What works is simple. Tie customer lifetime value analysis to decisions a team already makes. Bug triage. Onboarding fixes. Expansion enablement. Service routing. Roadmap scoring.
What doesn't work is treating CLV like a prestige metric. If the number is impressive but no one changes priorities because of it, the analysis isn't operational.
The most useful CLV model is the one your team actually consults before making trade-offs.
There's also a cultural piece. Product teams need to trust that customer behavior can reveal revenue impact before revenue confirms it. Support teams need to see that ticket themes aren't just anecdotal noise. Growth teams need to accept that not every acquired customer is equally valuable. When those groups align, CLV becomes a shared language.
That's the ultimate payoff. You stop asking only how many customers you added or what they paid this month. You start asking whether the product is creating stronger customer relationships over time, and which daily actions increase that odds.
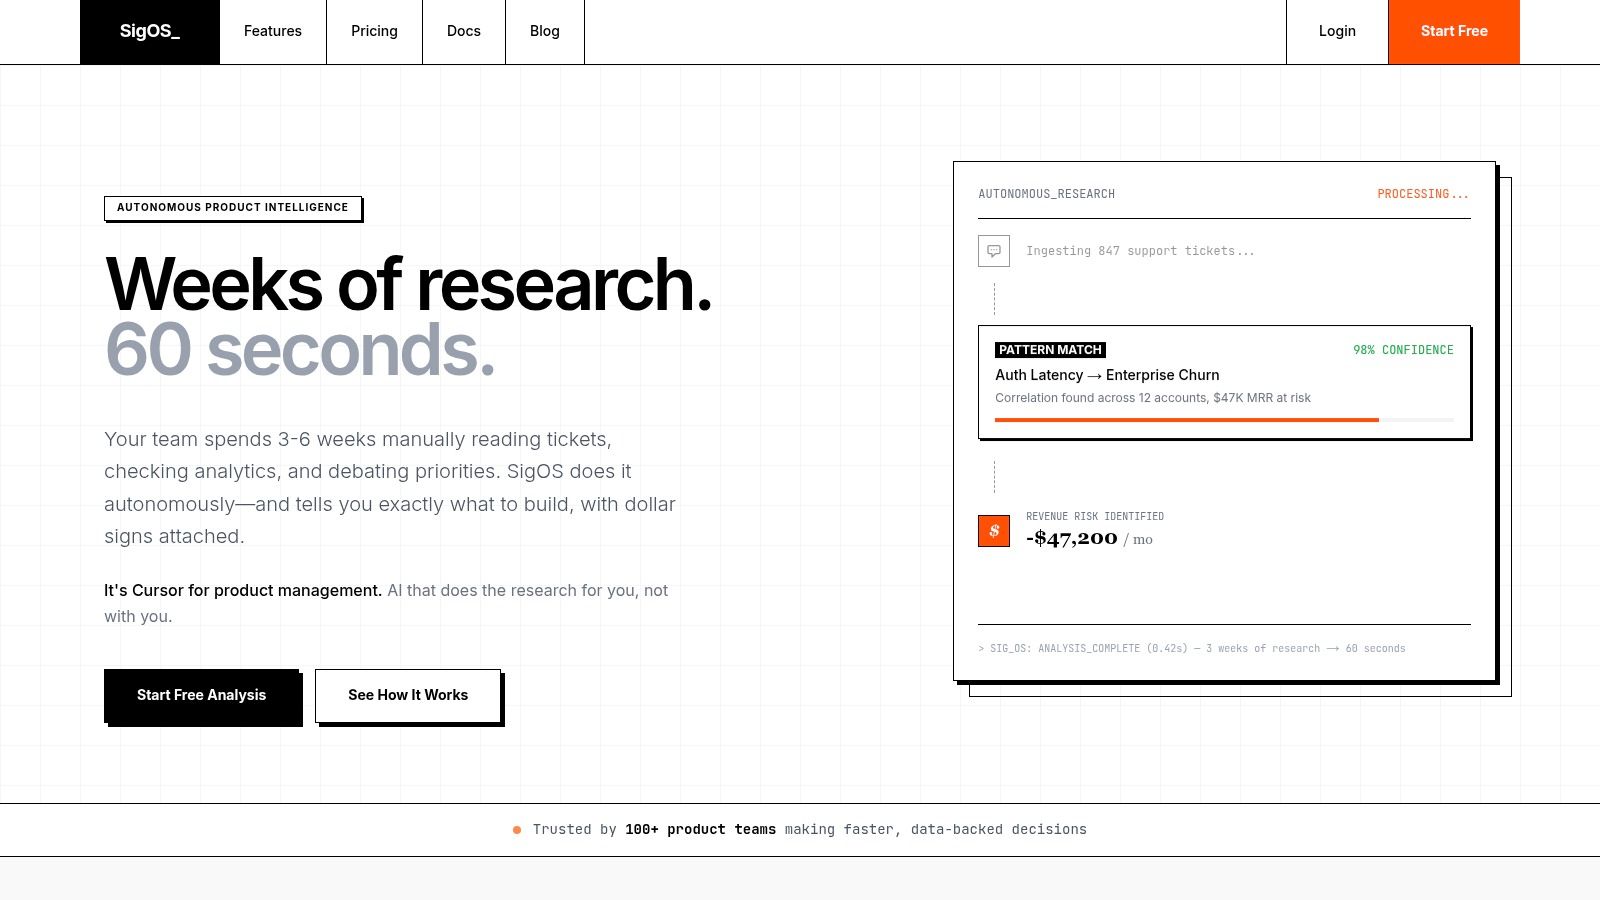
If your team wants to turn customer lifetime value analysis into a daily operating system instead of a backward-looking report, SigOS helps connect support conversations, product usage, and revenue signals so you can see which issues are hurting retention, which requests matter most, and where product work is likely to change customer value before the numbers show up in finance.
Keep Reading
More insights from our blog


Ready to find your hidden revenue leaks?
Start analyzing your customer feedback and discover insights that drive revenue.
Start Free Trial →