How to Measure Product Success in SaaS That Drives Growth
Learn how to measure product success in SaaS with a practical framework for KPIs, retention, and revenue signals that turn data into action.
You shipped a feature, adoption looked decent for a week, and now the dashboard is giving you mixed signals. Active users are up, support complaints are louder, renewals feel less certain, and leadership wants one clean answer to a messy question: is the product succeeding?
That's where most SaaS teams get stuck. They collect plenty of metrics, but they don't have a method for connecting user behavior to business value. So they end up celebrating activity, arguing over dashboards, and reacting too late when churn or contraction shows up in billing data.
The practical way to measure product success is to treat it as a causal chain. Start with the behavior that shows users are getting value. Then test whether that behavior connects to retention. Then confirm that retention expands into revenue. If that chain breaks at any point, the product isn't succeeding in the way that matters.
Why Product Success Needs More Than One Metric
A team ships a feature, sees active usage jump, and reports a win. Ninety days later, the same accounts are flat on expansion, support tickets are up, and renewal calls get harder. The usage spike was real. It just was not the outcome that mattered.
Single-metric reporting creates that kind of confusion. Monthly active users can rise while activation quality drops. NPS can improve while core workflow usage stays shallow. Trial conversion can look healthy even if those accounts never become durable revenue.
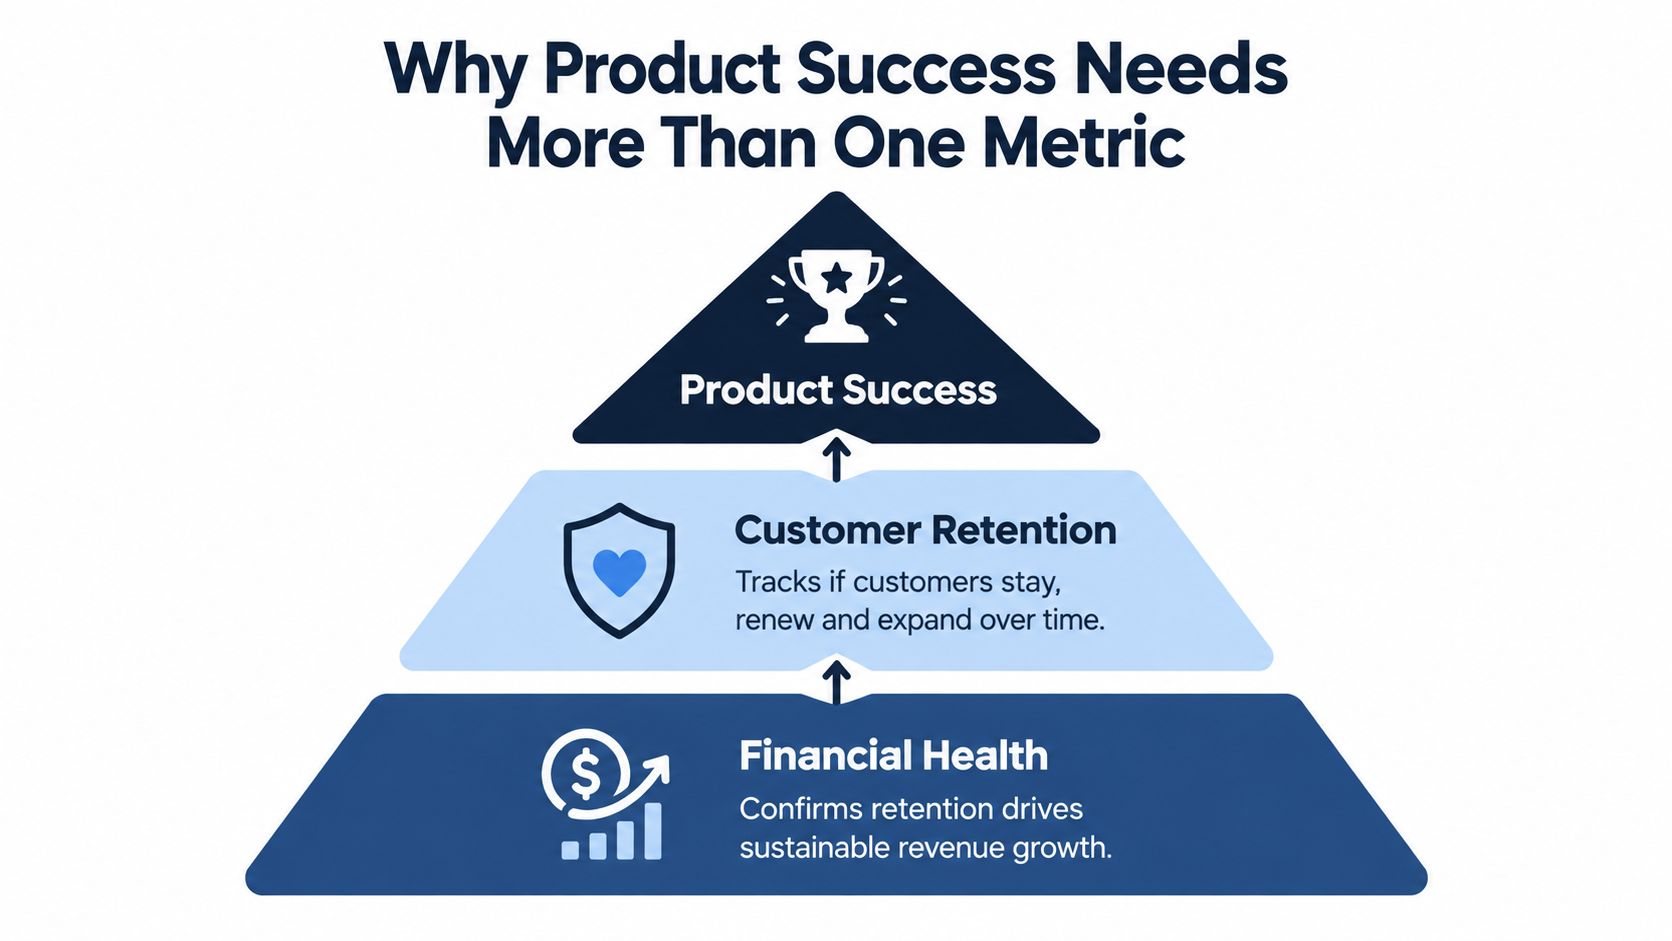
In SaaS, product success has to be measured as a chain, not a scoreboard of unrelated numbers. Start with the behavior that signals customer value. Check whether that behavior repeats at the account level. Then verify that retained usage shows up in renewals, expansion, or margin. Gainsight's enterprise product metrics guide is useful here because it separates the picture into three distinct layers: product and engagement, customer success and retention, and financial performance (Gainsight enterprise product metrics).
What single-metric thinking misses
The failure mode is not “using the wrong KPI.” It is collapsing different questions into one number.
Usage answers whether people showed up. Retention answers whether value held. Revenue answers whether that value matters enough for the business to keep and grow the account.
Those signals often diverge. I've seen products with heavy weekly usage from casual contributors and weak renewal rates because the buyer's core job was still unfinished. I've also seen lower seat-level activity paired with strong net revenue retention because a narrow workflow was embedded in the accounts that paid the most. If you only track surface engagement, both products can look similar. They are not.
AI features make this even easier to misread. Prompt volume and feature clicks are not proof of success. For AI, the stronger signals are task completion, acceptance rate, time saved in a repeated workflow, and whether usage persists after the novelty period. If an AI assistant gets tried once, edited heavily, and then abandoned, “adoption” is a vanity number.
Why recurring revenue changes the standard
Subscription products are judged over time. A signup, a login, or even a successful onboarding sequence only matters if it leads to repeated value in the use case that drives renewal.
That changes what “good” looks like. Early-stage behavior metrics still matter, but they only earn trust when they connect to account durability. Financial results are the final check, not the starting point. By the time contraction shows up in ARR or NRR, the product team usually missed an earlier behavioral signal.
That is why I prefer stage-based measurement. For a new user, the question is whether they reached first value. For an active team, the question is whether they built a habit around a core workflow. For a mature account, the question is whether that workflow spread to more seats, more teams, or a higher-value use case.
What a durable scorecard actually adds
A useful scorecard does not repeat the same story three ways. It assigns each layer a job.
| Layer | Primary question | Example signal | Typical owner |
|---|---|---|---|
| Product engagement | Did users complete the behavior that delivers value? | Activation to core workflow, repeat usage of key task, AI output acceptance rate | Product |
| Retention | Did that behavior persist at the account level? | Cohort retention, renewal rate, usage depth in paid accounts | Product and Customer Success |
| Financial performance | Did retained usage become durable revenue? | NRR, expansion rate, gross margin by segment | Leadership, Finance, Product |
That structure forces better conversations. If engagement is up but retained accounts are not expanding, the product may be useful without being important. If retention is stable but margins are weak, the product may be delivering value in a way that is expensive to support. If AI usage is high but acceptance is low, the feature may be creating activity instead of outcomes.
Practical rule: if a metric can improve while your best-fit accounts get less value, it is a diagnostic metric, not your definition of product success.
Aligning Goals to Metrics With North Star and OKRs
Teams don't usually fail because they lack metrics. They fail because their metrics don't reflect the job the customer hires the product to do.
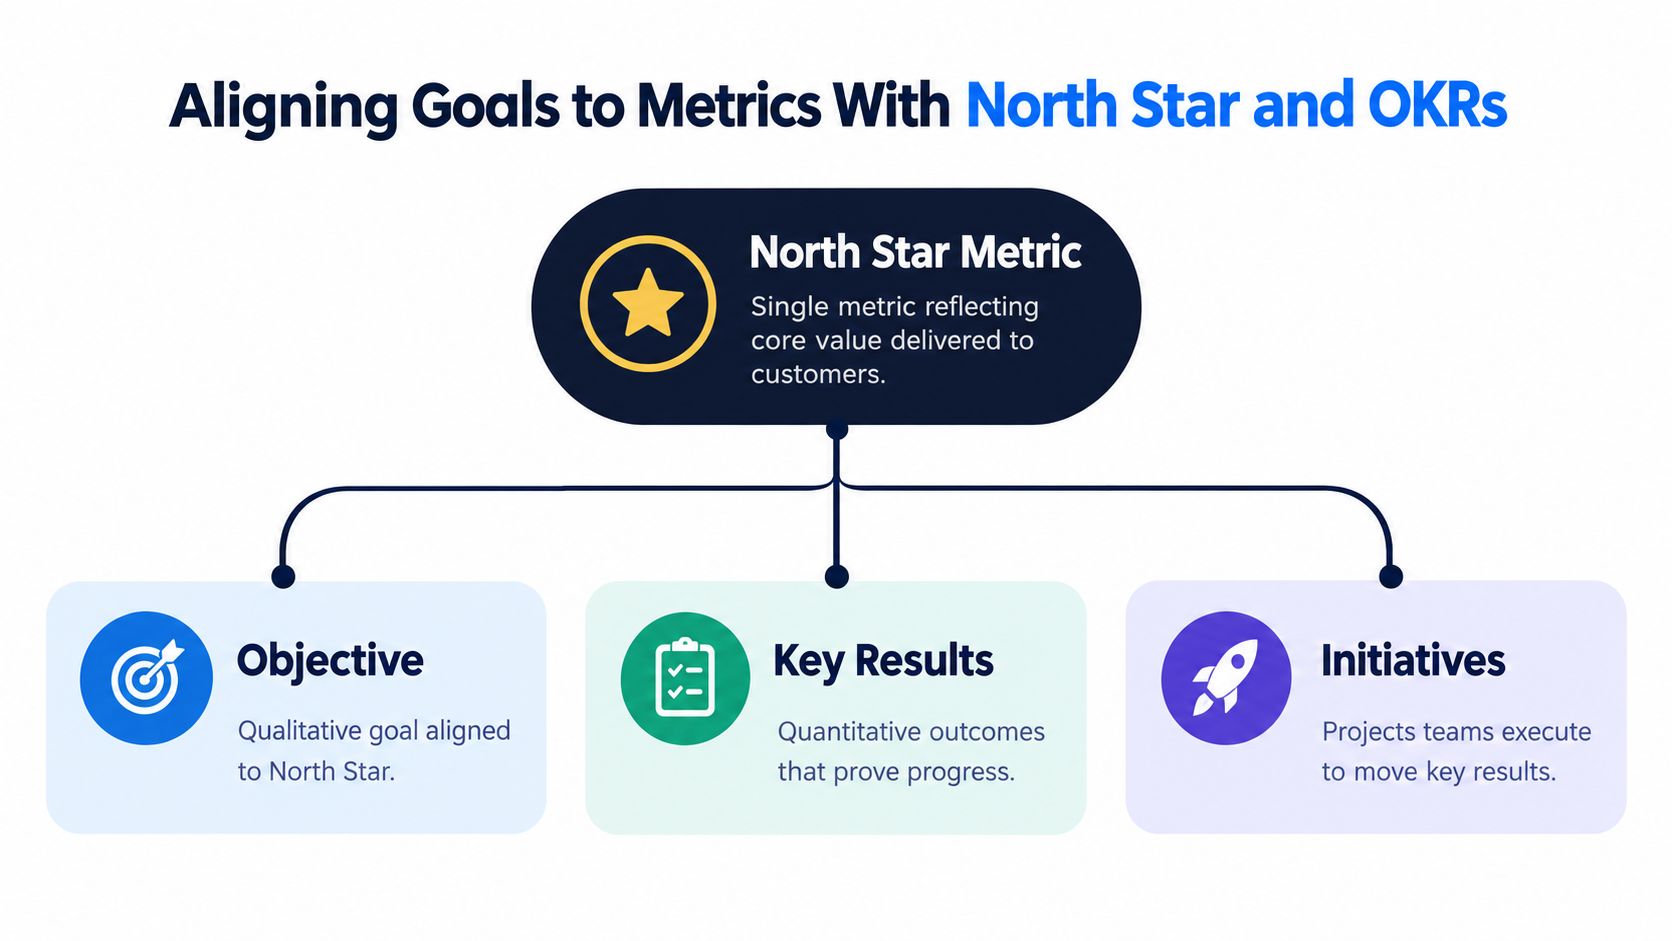
A North Star metric should sit at that intersection. It should capture recurring customer value in a way that teams can influence. Then OKRs turn that strategic signal into operating work across product, growth, customer success, and engineering.
Pick a North Star that reflects value, not motion
A good North Star isn't “more clicks” or “more logins.” It reflects a repeatable customer outcome.
For a collaboration tool, that might be teams completing shared workflows. For analytics software, it might be recurring report creation by active accounts. For a support platform, it could be resolved conversations through the product's core workflow. If you need inspiration, these north star metric examples are useful because they show how teams tie value to specific motions instead of defaulting to broad activity counts.
A weak North Star has one of three problems:
- It's too shallow. Page views and logins often tell you people showed up, not that they succeeded.
- It's too lagging. ARR is vital, but as a team-level product North Star it's often too far from daily decisions.
- It's too easy to game. If a team can inflate the number without increasing customer value, the metric will eventually mislead you.
For a deeper breakdown of what makes a usable North Star, SigOS has a practical piece on how teams define a North Star metric.
Turn strategy into OKRs people can act on
Once the North Star is clear, OKRs should make the causal chain visible. The objective states the customer or business outcome. The key results measure movement. Initiatives are the bets.
Here's the pattern that tends to work:
- Start with the value event. Define the action that proves the user got meaningful value.
- Map the upstream drivers. Identify the moments that lead users into that value event, such as activation steps, onboarding completion, or repeated workflow use.
- Set key results at different depths. Pair one leading metric with one retention-facing metric, then tie them to the broader business outcome.
- Assign initiatives to teams. Product might reduce setup friction. Success might launch enablement for underused workflows. Engineering might improve reliability on a critical path.
Later in the quarter, this gives you a cleaner read on whether a win was real or cosmetic.
A short explainer can help if you're aligning a broader team around the structure:
A simple validation checklist
Before you lock a North Star or OKR set, pressure-test it.
- Does it represent customer value? If the user hits the metric, have they succeeded?
- Can a team influence it directly? If not, it belongs higher up the reporting chain.
- Does it precede retention or expansion? If it doesn't help predict durable value, it's probably a supporting metric, not the core one.
- Can you segment it cleanly? You'll need to compare by plan, customer type, and acquisition source later.
A North Star should make roadmap trade-offs easier. If it creates more dashboard arguments than product decisions, it's probably the wrong metric.
Choosing the Right KPIs for Every Stage of Growth
A team ships a new workflow, sees usage spike in week one, and calls it a win. Sixty days later, retention is flat, expansion is weak, and support tickets show customers still rely on the old process. The mistake was not bad execution. The mistake was choosing a success metric that sat too far from business value.
The right KPI depends on stage, customer motion, and the job the product is being hired to do. A self-serve onboarding flow needs different proof than an enterprise feature sold into existing accounts. An AI assistant needs different proof than a reporting dashboard. Good KPI selection follows a causal chain: first behavior, then repeated value, then account health, then revenue.
Product School makes a useful point in its piece on product success measurement gaps. Many KPI frameworks stop at naming common metrics. The harder job is deciding which one should carry weight for a specific product decision.
Stage changes what counts as proof
Early on, the main question is simple. Can the right users reach value fast enough to come back on their own?
Later, the question changes. Does that value hold across segments, survive renewal, and expand inside accounts?
That shift matters because teams often borrow metrics from a later stage and apply them too early. ARR is not the metric to optimize when activation is still broken. Daily active users are not the metric to celebrate when enterprise accounts log in often but fail to renew. If you want a broader reference set, this guide to product management KPIs is useful, but the shortlist still has to match your product's current decision.
If you're still pressure-testing whether users care enough to make the product part of their workflow, the Formbricks product-market fit guide is a good complement because it stays close to actual user value.
KPI Selection by Product Stage and Goal
| Stage and Goal | Primary KPIs to Prioritize | What Success Looks Like |
|---|---|---|
| Early stage, proving first value | Activation rate, time-to-value, repeat core action | New users complete the core job quickly and come back without hand-holding |
| Post-launch, validating habit formation | Cohort retention, frequency of core workflow use, feature adoption by role | Usage repeats over time, and the right personas build the feature into real work |
| Growth stage, protecting account health | Gross revenue retention, net revenue retention, account depth of usage | Customers stay, healthy accounts broaden usage, and contraction is visible before renewal |
| Mature SaaS, driving efficient growth | NRR, expansion rate, ARR quality, gross margin by segment | Revenue growth comes from durable usage patterns, not one-off sales pushes |
| AI feature rollout | Task-completion rate, retry or fallback rate, output-verification rate, tool-invocation rate | The AI feature completes useful work with enough reliability that users trust it in production workflows |
The useful pattern here is progression. Early metrics ask whether users can do the thing. Mid-stage metrics ask whether they keep doing it. Later metrics ask whether the account is getting more value over time.
Match the KPI to the use case, not just the company stage
Company stage helps, but use case is often the better filter.
A collaboration feature may need breadth of adoption across a team before it affects retention. A workflow automation feature may show value through depth instead: fewer manual steps, more runs per account, stronger renewal among operations-heavy customers. The same product can have one feature measured on activation and another measured on expansion influence.
I usually split feature measurement into three questions:
- Did the user reach the intended outcome?
- Did they repeat the behavior in a real workflow?
- Did that repeated behavior show up later in retention, renewal, or expansion?
That sequence keeps teams from overvaluing surface activity.
Separate account retention from revenue retention
Reporting often goes wrong. A stable logo retention number can hide a shrinking business if larger customers are downgrading, reducing seats, or dropping high-value modules. A low-volume product line can also make revenue look healthy while masking poor retention in the core workflow.
As noted earlier in the article, retention and churn metrics need to be segmented by cohort, plan, and acquisition source, and revenue retention should be read separately from customer retention. That distinction changes roadmap priorities. If logos stay but revenue slips, the problem is often weak expansion, poor packaging, or shallow adoption in high-value accounts. If revenue holds because of a few expansions while new cohorts churn, the acquisition or onboarding motion is likely masking a product problem.
AI features need stage-specific success signals
AI features create a special version of the same mistake. Teams track adoption, see curiosity, and assume usefulness.
For AI, the KPI set should reflect where the feature sits in the user journey. Early in rollout, task-completion rate tells you whether the model can finish the job users gave it. Retry or fallback rate shows whether users had to re-prompt, switch methods, or abandon the AI path. Output-verification rate matters because heavy checking can signal low trust even when usage looks strong. Tool-invocation rate matters for agentic flows where the value depends on the system taking actions, not just generating text.
Those signals are more useful when tied to a concrete workflow. For example, an AI summarization feature may be healthy with moderate adoption if summaries are accepted with light editing and reused in downstream work. An AI support assistant can have high usage and still fail if agents repeatedly override answers or avoid the automation on complex tickets.
A feature is successful when the measured behavior leads to repeated customer value and then shows up in retention or revenue. Anything short of that is an intermediate signal, not proof.
Instrumenting Data and Analyzing Behavioral Signals
Monday morning usually looks the same when instrumentation is weak. The dashboard says feature adoption is up, success asks why renewals are flat, and the product team cannot explain which behaviors created value versus which ones were just clicks. I have seen that happen when event names change between releases, account IDs do not match across systems, or AI interactions get logged as generic page activity.
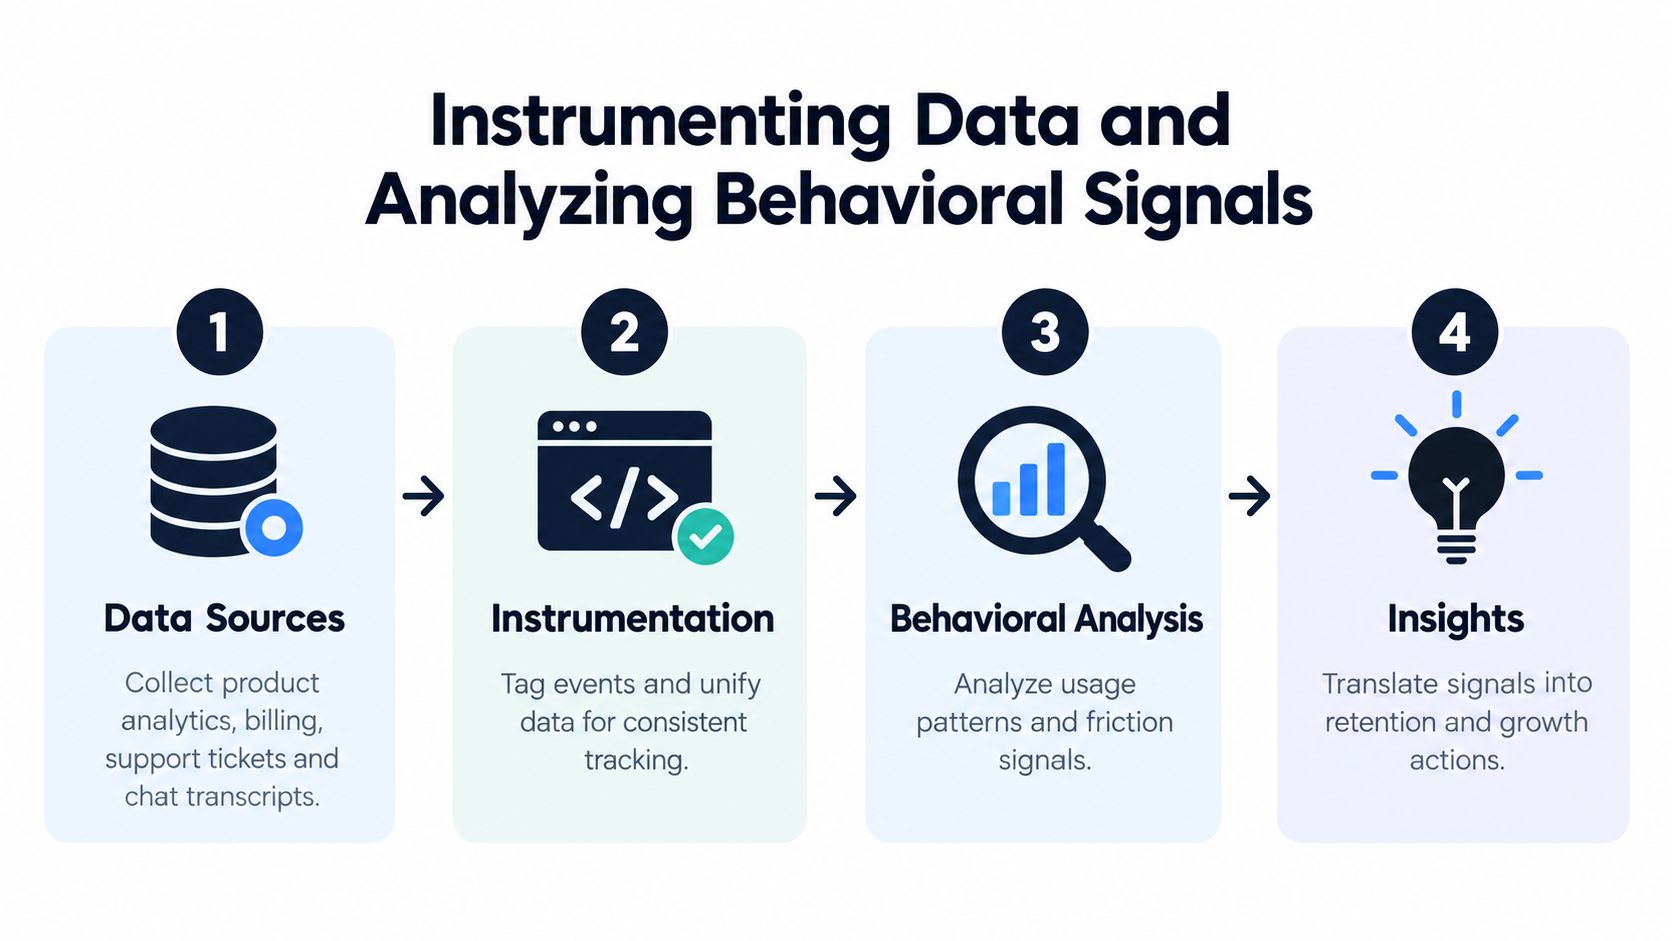
Reliable measurement starts with a data model that can trace a chain: user action, workflow completion, account value, business outcome. If that chain breaks at any point, teams start arguing from fragments.
Build a data model around customer behavior
The raw data usually already exists. Product events sit in Amplitude, Mixpanel, or PostHog. Billing lives in Stripe or a finance system. Support history is in Zendesk or Intercom. Sales context sits in Gong or the CRM. The job is not collecting more tools. The job is making those systems agree on who the customer is, what happened, and when.
A workable model usually starts with a few stable entities:
- Account ID ties usage to renewals, expansion, and churn.
- User ID separates broad account adoption from one power user carrying the workload.
- Role, plan, and segment metadata let you compare behavior across ICP tiers, pricing packages, and team structures.
- Acquisition source helps distinguish a product issue from poor-fit traffic.
- Workflow or job-to-be-done tags connect events to the customer outcome you expect the product to produce.
If your team needs tighter visibility into raw product behavior before layering on business analysis, this guide to monitoring user activities is a useful operational reference.
Instrument the moments that prove value
Logging every click creates noise. Instrument the points where value is created, confirmed, or lost.
For a collaboration product, that might include creating a workspace, inviting teammates, completing the first shared task, and repeating that workflow in the next week. For a data product, it might be connecting a source, producing a usable output, and exporting or sharing the result. For an AI feature, simple usage counts are rarely enough. You need events that show whether the model completed the task, whether the user accepted the output, whether they retried, edited heavily, or switched to a manual path.
Those signals should map to stages, not sit in one flat KPI list:
- Activation signals show first value delivered.
- Adoption signals show the workflow spreading across users, teams, or accounts.
- Depth signals show repeated use in the jobs tied to retention.
- Expansion signals show usage patterns that line up with seat growth, higher limits, or premium capabilities.
- Risk signals show failed tasks, abandonment, fallback behavior, support contacts, or usage collapse in key workflows.
For AI products, I usually separate curiosity from utility. Prompt starts and feature opens measure interest. Accepted outputs, low retry rates, successful tool invocation, and reuse in downstream work measure usefulness. That distinction matters because AI features often generate high early traffic without creating durable value.
Analyze behavior in cohorts and workflows
Average usage hides the mechanics of success. Cohort analysis shows whether a product is building repeat value or just creating a short spike after launch.
Track adoption, retention, churn, and feature usage together as part of the same account journey, not as isolated charts. In practice, the useful question is simple: which behaviors show up before renewal, expansion, or contraction for a specific segment?
A practical operating pattern looks like this:
- Group accounts by start period or release exposure. That separates product changes from seasonality.
- Break results out by plan, segment, and acquisition source. Self-serve behavior usually does not predict enterprise outcomes.
- Measure workflow completion, not just feature entry. Opening a feature is weaker than finishing the job it was meant to help with.
- Compare retained and churned cohorts on the same timeline. Look for behavioral divergence early.
- Tie product signals back to billing and support outcomes. A feature that drives more tickets or more manual intervention can look healthy in product analytics while hurting margins.
Product School has a useful piece on connecting usage patterns to customer engagement outcomes, but the hard part is operational, not conceptual. Teams need event definitions that survive releases, ownership for instrumentation quality, and a review cadence that checks whether behavioral signals still correlate with account health.
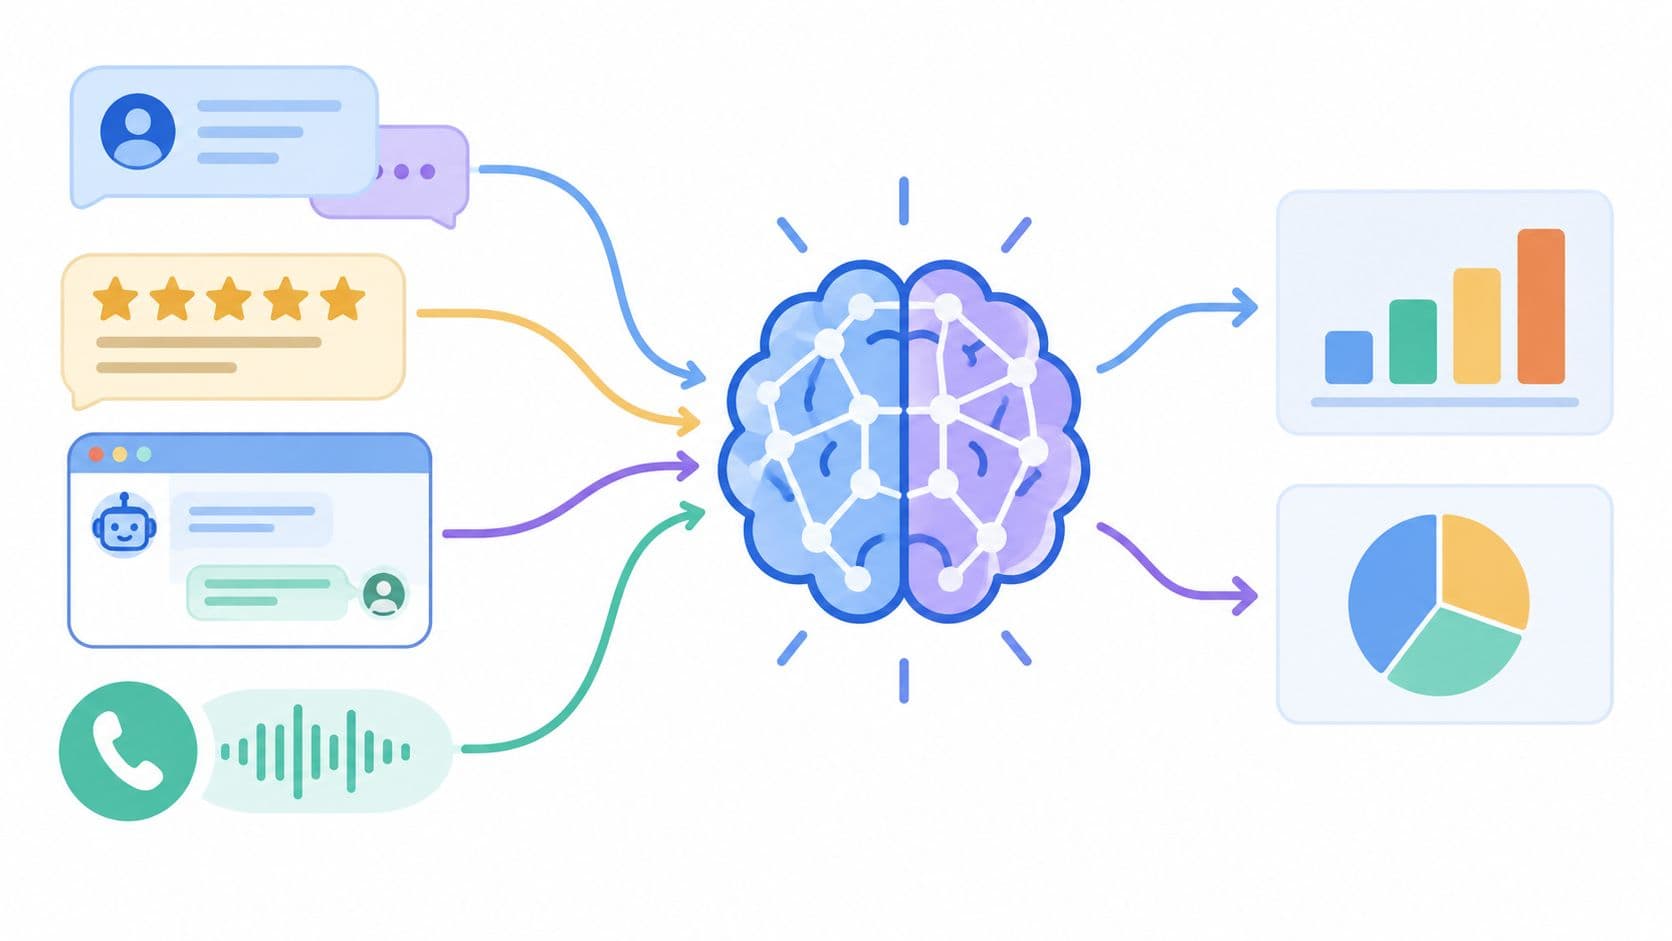
One tool category that helps here is revenue-aware product intelligence. SigOS ingests support tickets, chat transcripts, sales calls, and usage metrics to surface patterns tied to churn risk and revenue impact, then routes those insights into tools like Jira, Linear, and GitHub.
Operator's shortcut: If a behavioral signal cannot be tied to an account, a workflow, and a business outcome, treat it as a clue, not a decision metric.
Setting Targets Running Experiments and Turning Insights Into Action
A team ships a new onboarding flow, activation ticks up, and everyone wants to call it a win. Six weeks later, retention is flat and support volume is higher. The problem was not measurement volume. It was skipping the causal chain between behavior and business value.
Targets need to reflect that chain. Start with the business outcome you need to move, then work backward to the behavior that should cause it, for the specific segment and use case you care about. For AI features, that usually means separating trial behavior from successful task completion. Prompt starts, regeneration clicks, or time spent can rise while delivered value stays weak.
Use formulas the whole company will trust
Metric definitions need to stay stable across releases, teams, and board decks. I keep the core formulas simple and explicit:
- Customer retention rate = ((E − N) ÷ S) × 100
- Churn rate = lost customers ÷ starting customers × 100
- Net Revenue Retention = (Beginning MRR + Expansions − Contractions − Churn) ÷ Beginning MRR × 100
That split matters because customer count and revenue movement often tell different stories. A product can retain logos while losing expansion revenue, or lose a few small accounts while core customers grow.
Set targets by cohort, not by company average
Benchmarks can help frame ambition, as noted earlier, but they are a weak way to run product. Good targets come from a baseline, a time window, and a segment that can respond to the change you are making.
A practical example: say activation is already healthy for enterprise accounts, but new self-serve teams who connect a data source in week one retain better than those who do not. The target should not be “improve overall retention.” It should be more specific: increase the share of new self-serve accounts that complete the data connection workflow in their first seven days, then check whether that cohort shows better day-30 retention and lower support contact rates.
That kind of target does two jobs. It gives the team a near-term number they can influence this sprint, and it keeps everyone honest about whether the behavior leads to revenue protection later.

Run experiments against the full chain
A useful experiment does more than chase local lift. It tests whether a product change shifts the right behavior, for the right users, and whether that shift survives long enough to matter.
A solid setup usually includes:
- A clear treatment group. Define who saw the change and who did not.
- A stage-specific leading signal. For early lifecycle work, that may be workflow completion. For mature accounts, it may be depth of use inside a sticky job.
- A downstream business check. Retention, expansion, downgrade rate, support burden, or sales cycle impact.
- A decision rule. State before launch what result means ship broadly, revise, or roll back.
AI experiments need one extra layer. Measure output acceptance, task completion, or user correction rate. Usage alone is noisy because curiosity produces traffic. Value shows up when the model helps a user finish work with less friction or better quality.
Turn findings into operating decisions
Analysis has to end in execution. Otherwise the team learns something true and does nothing with it.
In practice, that means:
- Create tickets in Linear or Jira with the affected cohort, broken workflow, and expected business impact.
- Attach evidence in GitHub such as event sequences, session examples, and support excerpts.
- Notify customer success or sales when a pattern points to churn risk, stalled adoption, or expansion readiness.
- Review post-release results against the original hypothesis, not against whatever metric happened to move.
The teams that get real value from measurement treat every insight as a proposed cause-and-effect bet. Each bet needs an owner, a target cohort, and a follow-up check on whether the behavior change improved retention, revenue, or cost to serve.
Your Practical Playbook for Sustained Product Success
If you want a working system for how to measure product success, keep it simple enough to run every week.
Start with a balanced scorecard. Product engagement tells you whether users are getting value. Retention tells you whether that value lasts. Financial metrics tell you whether it matters to the business. Then choose one North Star that reflects recurring customer value, not generic activity.
After that, narrow your KPI set by stage. Early products need proof of activation and repeat use. Growth products need proof of retention and expansion. AI features need their own operating signals because curiosity can look like success when it isn't.
The part that separates serious teams from dashboard tourists is instrumentation. Tag the core value event. Connect product behavior to account, segment, and billing data. Read metrics through cohorts, not blended averages. Then run experiments that test whether behavior changes improve downstream outcomes.
A useful 30-day operating checklist
- Audit your scorecard. Remove vanity metrics that don't connect to retention or revenue.
- Rewrite your activation definition. If “login” still counts, tighten it.
- Segment your retention view. Split by plan, acquisition source, and account type.
- Identify one expansion-linked behavior. Track the workflow that strongest customers use before they grow.
- Review AI features separately. Measure completion quality, retries, and fallbacks instead of adoption alone.
- Push insights into execution systems. Every important signal needs an owner and a next action.
Common mistakes to avoid
A few patterns show up over and over:
- Reporting activity as success. Usage spikes don't prove value.
- Blending customer counts with revenue health. You need both.
- Using broad averages. Cohorts and segments tell the story.
- Treating launch as the finish line. Success shows up later, in retention and expansion.
The most effective habit I've seen is a daily or weekly dashboard that is revenue-weighted. Not just what users clicked, but which problems are tied to contraction risk, which workflows correlate with renewal, and which requests are attached to accounts that matter. That's the operating view that changes roadmap decisions.
When teams ask how to measure product success, they usually want a list of KPIs. What they really need is a system that shows whether customer behavior is turning into durable business value. Build that system, and the right metrics become much easier to recognize.
SigOS helps teams connect product behavior, support signals, and revenue outcomes in one place, so measurement doesn't stop at dashboards. It ingests usage data, tickets, chats, and sales conversations to highlight the issues linked to churn risk and the requests tied to expansion opportunity, then pushes those insights into the tools teams already use. If you want a tighter loop between product measurement and roadmap action, visit SigOS.
Keep Reading
More insights from our blog

Ready to find your hidden revenue leaks?
Start analyzing your customer feedback and discover insights that drive revenue.
Start Free Trial →