Behavioral Pattern Recognition Guide for Product Teams
Learn how behavioral pattern recognition helps product teams detect churn, expansion and revenue signals early with practical techniques and real use cases.
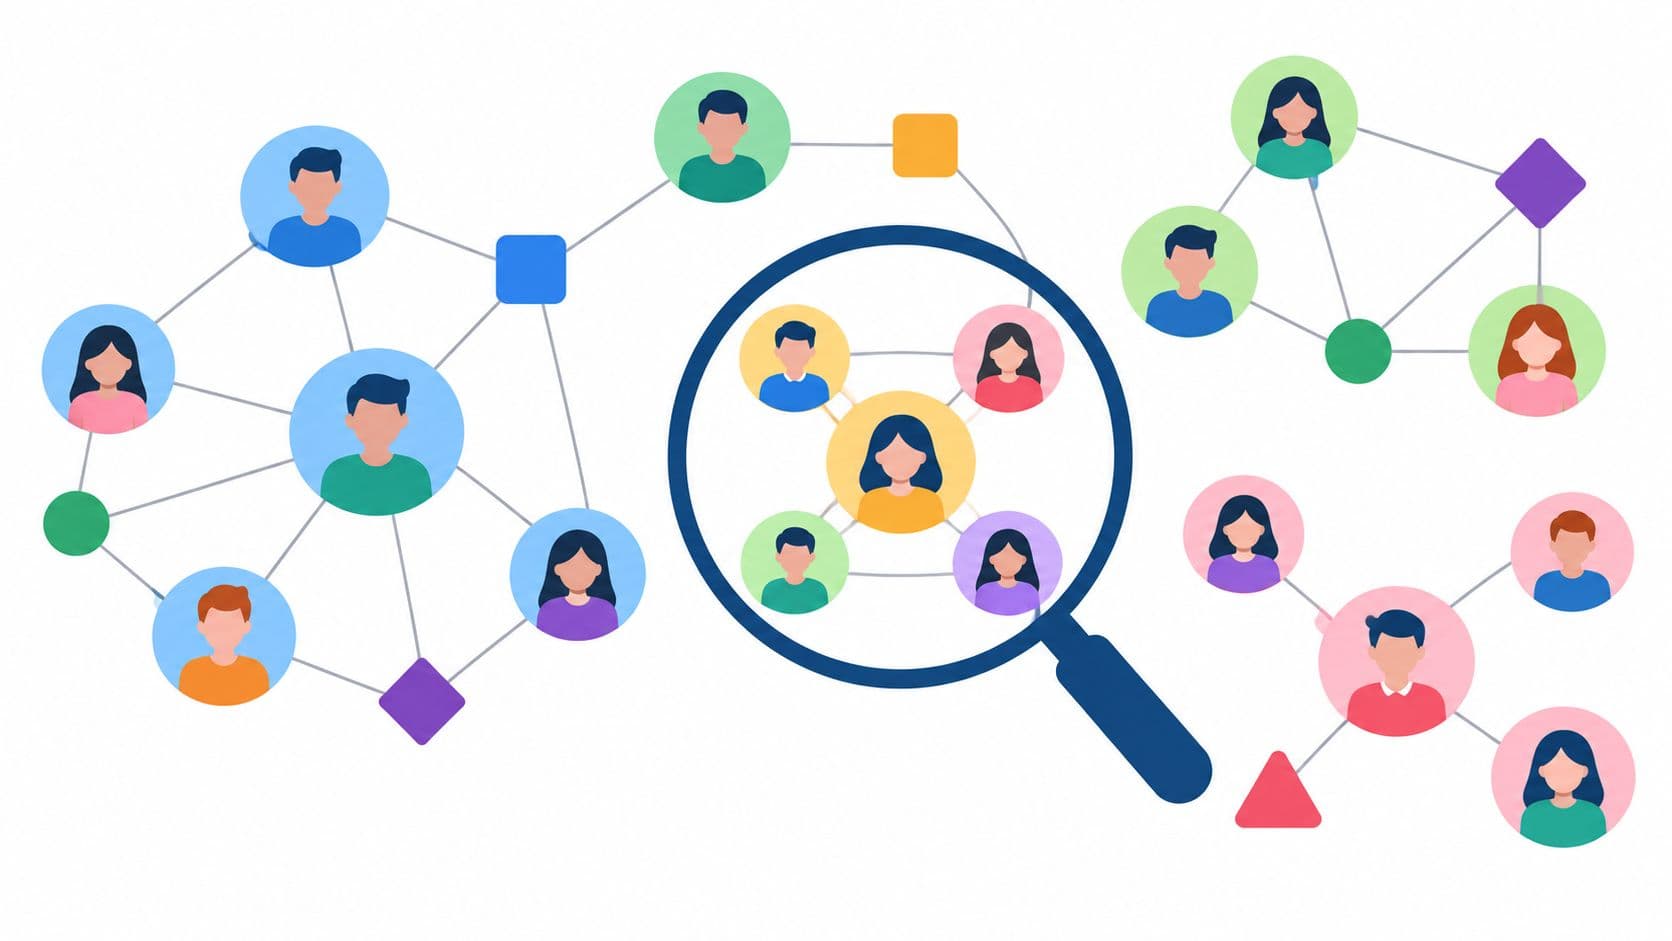
By the time most SaaS teams realize they have a behavior problem, they're already looking at the symptom pile instead of the pattern. Support sees ticket volume. Product sees feature drop-off. Success sees renewal risk. Finance sees churn after it lands. Nobody is wrong, but each team is staring at one slice of the same motion.
Behavioral pattern recognition fixes that only when it's treated as an operating system for decisions, not a dashboard ornament. The point isn't to prove that users behave in clusters or sequences. The point is to help a PM decide what gets fixed this sprint, help a CSM decide which account needs intervention now, and help a revenue team separate a noisy spike from a real expansion signal.
The field itself isn't new. Its roots go back to mid-20th-century pattern recognition research on “learning machines,” with major institutional milestones including the first international joint conference on pattern recognition in 1973 and the creation of the International Association for Pattern Recognition in 1978. A historical review also notes that the United States spent $80 million in 1985 on visual and speech recognition systems, which shows how fast the discipline moved from theory into funded application (historical review of pattern recognition). What's changed is that product teams now have dense digital exhaust from usage logs, support systems, billing systems, and customer conversations.
The Monday Morning Every Product Team Recognizes
A PM opens the laptop on Monday and gets the usual stack of bad news. Support has a wall of new Zendesk tickets. Engineering is sorting through a weekend spike in P1 bugs. An executive wants an explanation for churn movement. Three CSM messages are waiting in Slack, each marked urgent.
Nothing in that queue looks connected at first.
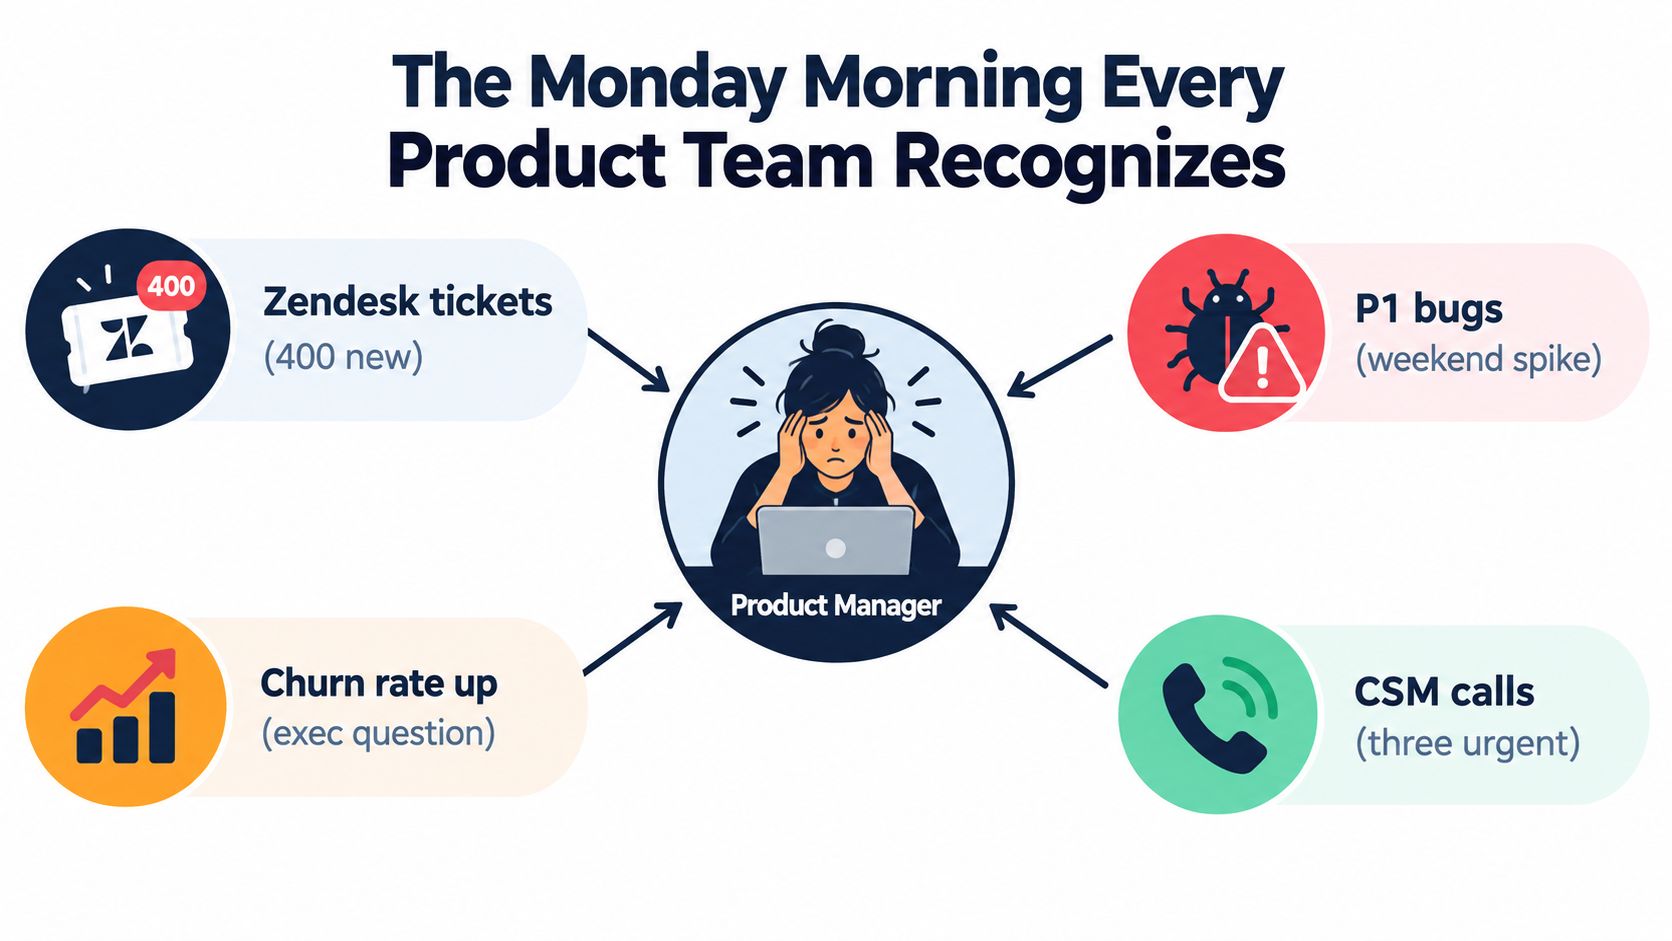
What the queue hides
One account says exports failed twice. Another says the reporting page feels slow. A third hasn't complained at all, but its weekly active users dropped and the admin stopped using a core workflow. Seen one by one, these are separate tasks for separate owners.
Seen together, they often describe a coherent behavioral pattern.
A subset of accounts may have reduced logins, skipped a core feature, shifted into read-only behavior, and opened urgent tickets inside the same short window. That isn't “noise volume.” That's an account-level change in behavior with likely revenue consequences.
Behavioral signals become useful when the team stops triaging artifacts and starts connecting actions over time.
The practical reframe
Behavioral pattern recognition earns its keep. Instead of treating four hundred tickets as a support backlog, the team treats them as weighted evidence. Some tickets map to churn risk. Some map to an expansion blocker. Some map to a product defect affecting a specific cohort with real contract value attached.
In practice, the morning view changes:
- Left side: accounts or workspaces ranked by behavioral risk or opportunity
- Right side: the sequence that triggered the score, such as declining session depth, stalled feature breadth, then support escalation
- Owner path: CSM follow-up, PM review, or engineering handoff based on business impact
That shift matters because patterns have revenue weight. The hard part isn't spotting them after the quarter closes. The hard part is detecting them early enough, and reliably enough, that the team can still act.
What Behavioral Pattern Recognition Actually Means
A better analogy comes from healthcare. An experienced nurse doesn't look at one vital sign in isolation. They read pulse, temperature, history, and recent change together. They aren't guessing. They're noticing a pattern that suggests a patient is drifting toward a problem before the worst outcome arrives.
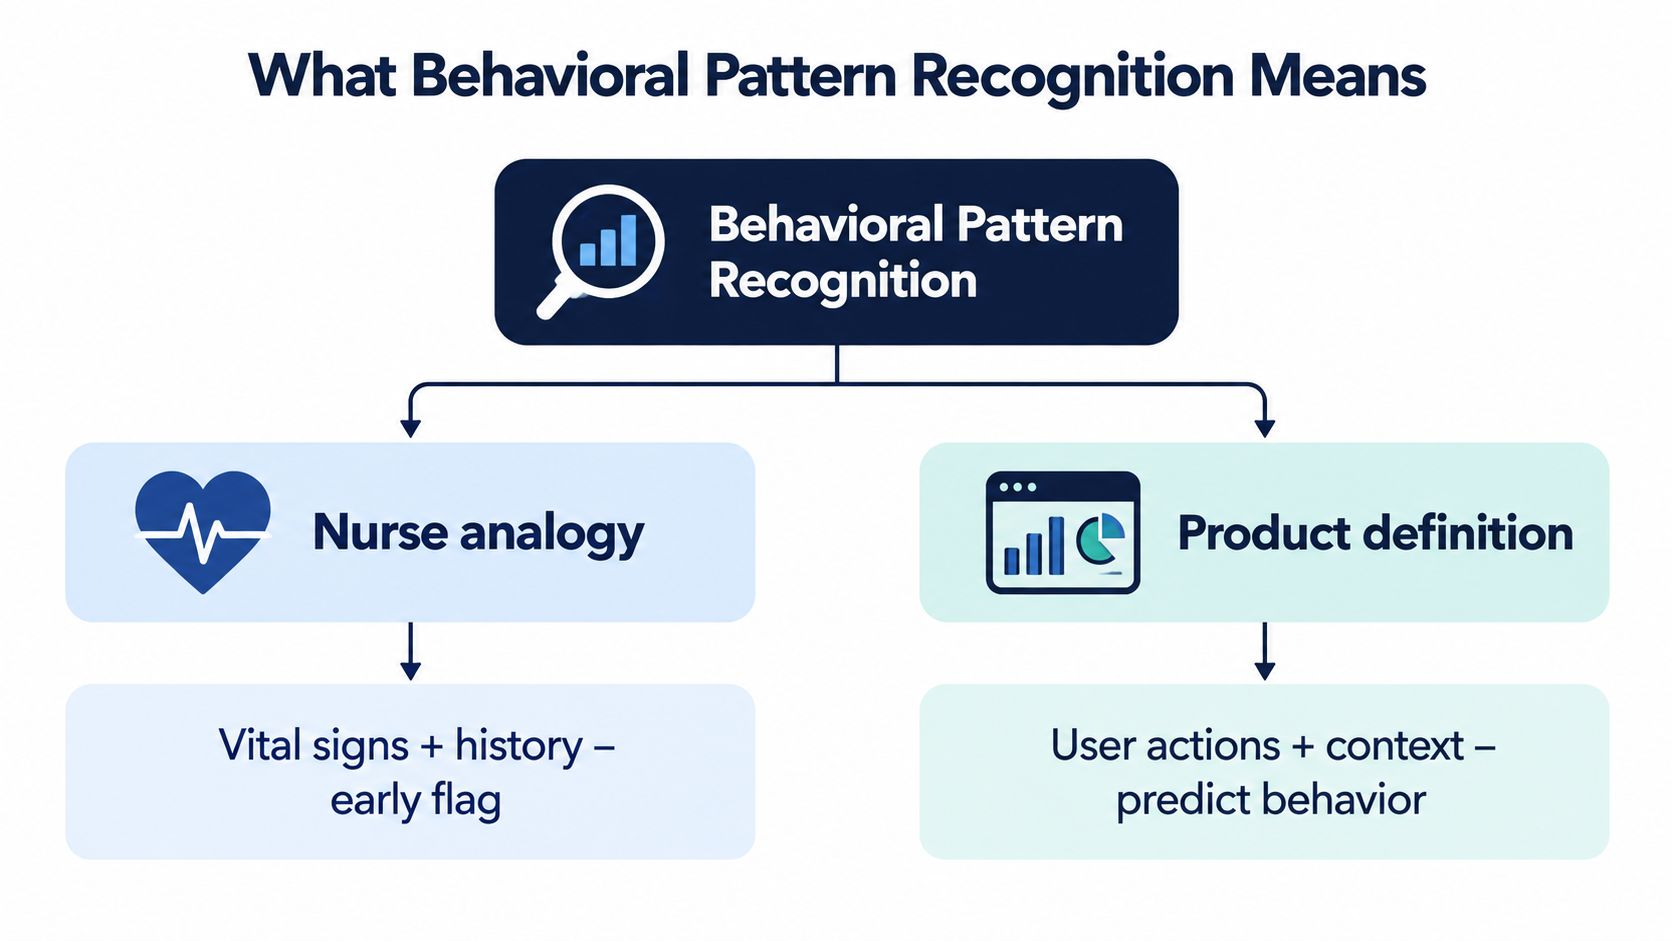
Behavioral pattern recognition does the same thing in product work. It reads user actions and customer context together, then surfaces recurring, predictive, or anomalous patterns tied to outcomes like churn, expansion, or product pain.
The formal version
In product terms, behavioral pattern recognition is a set of methods that ingest sequences of user and account events, derive structured behavioral features, and apply models that map those features to business-relevant outcomes.
If you want a quick primer on the raw material behind this, SigOS has a useful overview of behavioral data in product systems.
The market interest around this category is no longer niche. One market estimate values the behavior analytics market at 1.5 billion in 2025 and projects ****7.63 billion by 2034 with a 17.81% compound annual growth rate, while saying North America held 42.98% of the market in 2025 (behavior analytics market projection). You don't need to treat market reports as gospel to see the direction. Teams are buying this capability because they need account-level decisions from messy digital behavior.
After the analogy, the mechanics matter more than the label.
The three components teams need to internalize
**Data comes first.**You need timestamped event streams from product usage, support, customer conversations, CRM stages, and billing systems. If the data isn't temporal and joinable, the model won't understand behavior change.
A short walkthrough helps:
**Features turn raw events into signal.**Examples include session depth, feature adoption velocity, change in ticket tone over time, gap between key actions, or the drop from collaborative usage into admin-only usage.
**Models map signal to decisions.**That can mean a classifier scoring churn risk, a clustering model grouping usage archetypes, or a sequence model flagging a disengagement trajectory that isn't obvious in flat aggregates.
Practical rule: if the output doesn't change a queue, an owner, or a priority, you don't have a product system. You have an analysis project.
Core Techniques and Algorithms Used in Practice
The right algorithm depends less on fashion and more on two things: what labels you have and what decision you need to support. Product teams usually don't need a novel model. They need a model that survives dirty events, partial labels, and changing workflows.
Four technique families that actually ship
| Technique | Algorithm Families | Best Product Use Case |
|---|---|---|
| Clustering | K-means, DBSCAN | Segmenting accounts by usage archetype when you need fast cohorts without churn labels |
| Sequence models | Markov chains, transformer-based recommenders such as BERT4Rec | Predicting next actions, detecting disengagement trajectories, spotting order-dependent behavior changes |
| Anomaly detection | Isolation forests, autoencoders | Surfacing unusual usage or support shifts when labels are weak or absent |
| Supervised classification | Logistic regression, gradient boosted trees | Scoring churn-versus-stay, escalation risk, or expansion likelihood from engineered behavioral features |
Clustering is the fast starting point when the team wants structure before prediction. If you engineer useful behavioral vectors, clustering can separate “heavy evaluators,” “silent power users,” “ticket-heavy strugglers,” and “low-activation accounts” without needing outcome labels.
Sequence models matter when order carries the signal. An account that logs in less, then stops using a core feature, then opens support tickets tells a different story than an account that opens tickets while increasing feature breadth. Aggregates flatten that difference.
Anomaly detection is useful when no one trusts the churn labels yet. If your CRM stages are messy or your cancellation reasons are incomplete, anomaly methods can still surface abrupt shifts in usage, ticket volume, or account behavior for human review.
Supervised classification is the first model most product teams operationalize. With a decent event model and reliable labels, logistic regression and gradient boosted trees are often enough to rank accounts by risk and expose the feature drivers behind the score.
What usually works better than a single model
The strongest production setups are often hybrid:
- Discovery first: use unsupervised methods to find behavior modes or emerging issue clusters
- Scoring second: apply supervised models once outcomes are labeled and workflows are clear
- Sequence overlay: add temporal modeling only where lead time matters enough to justify added complexity
A common mistake is choosing the model before cleaning the event logic. If feature quality is weak, a fancier architecture just fails with more confidence.
Another production reality is that sequence-aware systems can recover patterns feature-only models miss. A 2026 churn prediction study reported 87.6% accuracy and 0.94 ROC-AUC for a feature-based model, while a sequence-based model reached recall as high as 96.1% by modeling temporal disengagement (sequence-based churn modeling study). That doesn't mean every team should jump to sequence models on day one. It means time order often contains the early warning your flat feature table threw away.
Data Inputs and Feature Engineering for Behavior Models
Teams usually don't have a modeling problem at the start. They have a shape problem. Their data is trapped in different systems, summarized too early, or missing the event order that makes behavior legible.
The four input streams that matter most
| Data Source | Raw Form | Engineered Features | Product Signal |
|---|---|---|---|
| Product usage logs | Click paths, sessions, feature events | Session depth, feature adoption velocity, action gaps, sequence transitions | Engagement, activation, friction, workflow abandonment |
| Support interactions | Zendesk tickets, Intercom chats, CSAT notes | Ticket volume trend, repeat issue patterns, topic clusters, sentiment over time | Friction, urgency, blocked workflows |
| Qualitative signals | Gong summaries, call notes, NPS verbatims | Objection themes, renewal concern markers, request recurrence, language shifts | Churn intent, expansion intent, unmet needs |
| Account context | Plan tier, seats, renewal timing, billing state | Revenue weighting, maturity bands, lifecycle stage, change-adjusted baselines | Commercial priority, expected usage pattern |
The event model has to preserve sequence. “Three report opens, then a shift into read-only activity” carries more signal than “five report actions this week.” Flat daily counts erase the path.
For teams working through this translation layer, SigOS also has a solid explainer on signal feature extraction.
Features that tend to matter in production
Longitudinal feature engineering is where raw exhaust becomes useful:
- Rolling windows: short-term and medium-term usage movement side by side
- Decay functions: older actions count less than fresh ones
- Session-to-session gaps: widening intervals often show cooling intent
- Ratio features: changes in core-user share, admin-only activity, or support-heavy usage
- Transition features: movement between behavioral states, not just totals inside one state
This is also where many churn programs finally improve. A MIT study found that spatio-temporal and choice-pattern features were significantly better than demographic features across all evaluated datasets, with especially strong signals from diversity and regularity in customer activity and entropy of financial choices (MIT research on churn features). The practical implication is simple. Demographics tell you who might be more likely to churn. Behavior tells you when the account is moving toward churn.
The leak that ruins offline wins
Feature leakage is still one of the easiest ways to fool yourself. If you train on inputs like cancellation-click events, renewal-save outreach, or post-escalation support metadata, the model will look smart in offline validation and fail the minute it faces a real future state.
If a feature only exists after the business outcome becomes obvious to a human, it probably shouldn't be in the training set.
Evaluation Metrics and Validation Strategies
Most product leaders don't need a lecture on metrics. They need to know whether the alert feed will waste their team's time or help them intervene early enough to matter.
Precision and recall in product terms
Precision answers one question: when the model flags an account, how often is that account at risk?
Recall answers another: of the accounts that were at risk, how many did the model catch?
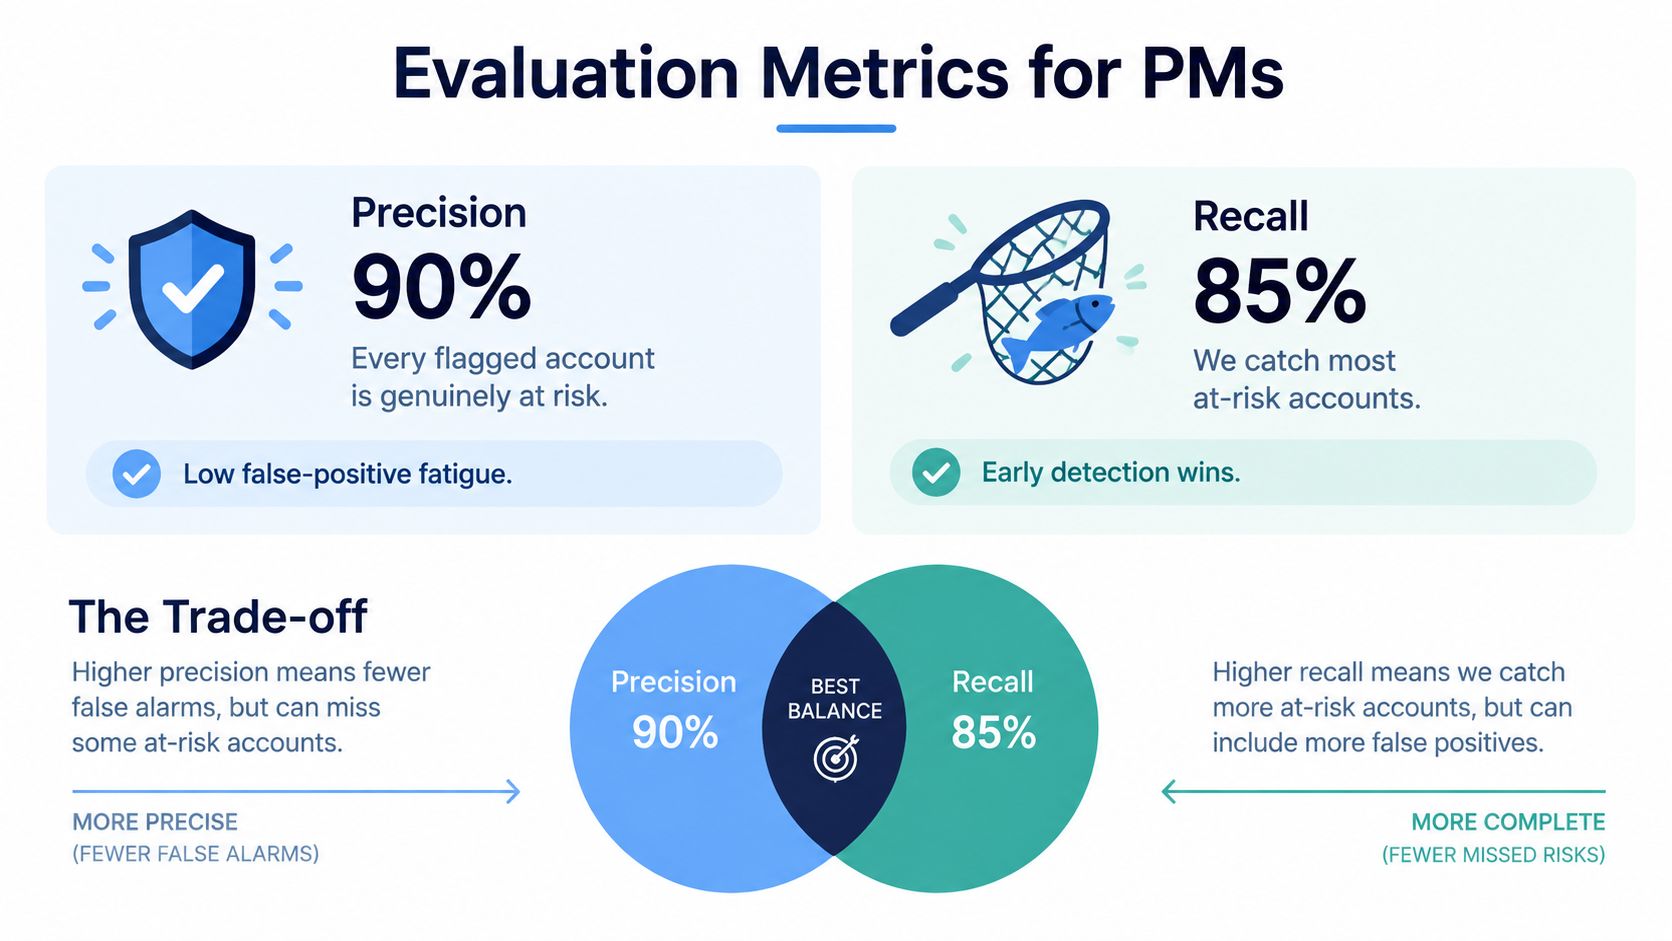
A support-heavy CSM team with limited capacity may prefer higher precision so reps don't burn cycles on weak alerts. A strategic retention team may accept lower precision if higher recall means they catch more early-stage churn paths.
Lead time matters more than leaderboard metrics
For churn and expansion workflows, the operational question isn't “what was the ROC score?” It's “how many days before the event did we know enough to act?”
Recent industry guidance suggests behavioral change often appears 30 to 90 days before cancellation, and the same reference reports linguistic markers can predict churn risk with 76% accuracy when detected 60+ days before cancellation (early-warning churn diagnostics guide). That's the kind of framing product and success teams use. Not just whether a model is right, but whether it's right with enough lead time to change the outcome.
This is also why sequence models often beat feature-only systems in disengagement work. They detect the order of collapse, not just the size of decline.
Validation that matches production reality
Random train-test splits often create false confidence because they let yesterday's pattern bleed into tomorrow's prediction task. Better practice looks like this:
- Time-based holdouts: train on earlier periods, test on later ones
- Backtesting: evaluate against a meaningful stretch of historical churn outcomes
- Shadow mode: send scores to an internal review queue before routing them into CSM or PM workflows
- Capacity testing: make sure the number of alerts matches the number of humans who can act
If you're building the process around existing ML ops, this overview of model validation techniques is a useful operational reference.
A model with slightly weaker benchmark performance but stable lead time and manageable alert volume is usually better for the business than a prettier offline chart.
Product Team Use Cases That Move Revenue
Most writing on behavioral pattern recognition stops at “predict churn.” That's too abstract to help a product team on Tuesday morning. What matters is the dashboard view, the owner, and the action tied to the pattern.
Churn detection that arrives in time
A CSM opens the morning risk dashboard and sees a small set of accounts rising to the top. The signal isn't just lower usage. It's a specific sequence: fewer collaborative sessions, reduced use of a core workflow, then support activity around a blocked task. That sequence is very different from a seasonal slowdown or a one-week holiday dip.
The team doesn't need every flagged account to churn. They need a queue that is directionally right and operationally early.
Expansion signals that aren't just vanity engagement
Expansion models work best when they watch for behavioral broadening, not just volume. An account that starts using more modules, reduces support dependence, and brings in additional internal roles often deserves sales attention. An account with a sudden burst of clicks during onboarding probably doesn't.
A broader map of the tooling environment helps. If you're comparing categories around this workflow, Grou's analytics subcategories overview is useful because it shows how product analytics sits next to adjacent systems like feedback, attribution, and behavior tracking, which often end up feeding the same expansion motion.
Issue prioritization with business context
Support clustering is one of the fastest wins. A team may start the week with a flood of complaints that appear unrelated. After grouping tickets by behavior-linked pattern, the PM sees that many complaints trace back to one broken path inside one high-value workflow.
That changes the engineering conversation immediately.
Instead of saying, “support is noisy again,” the PM can say:
- This issue maps to a recurring behavioral sequence
- The affected accounts are concentrated in an important product segment
- The workflow break appears before churn risk and before upgrade hesitation
- Fixing it likely removes both support load and revenue drag
The dashboard shape that actually gets used
The most effective morning workflows tend to share a similar structure:
| View Element | What the team sees | Why it matters |
|---|---|---|
| Pattern score | Ranked accounts, workspaces, or issue clusters | Forces prioritization |
| Revenue context | Contract value, renewal timing, commercial weight | Prevents equal treatment of unequal problems |
| Sequence drilldown | Ordered actions, support events, and behavior shifts | Builds trust in the score |
| Owner action | CSM save play, PM review, engineering handoff | Connects insight to execution |
When behavioral pattern recognition works, it changes what gets attention before the quarter ends. That's the standard worth holding it to.
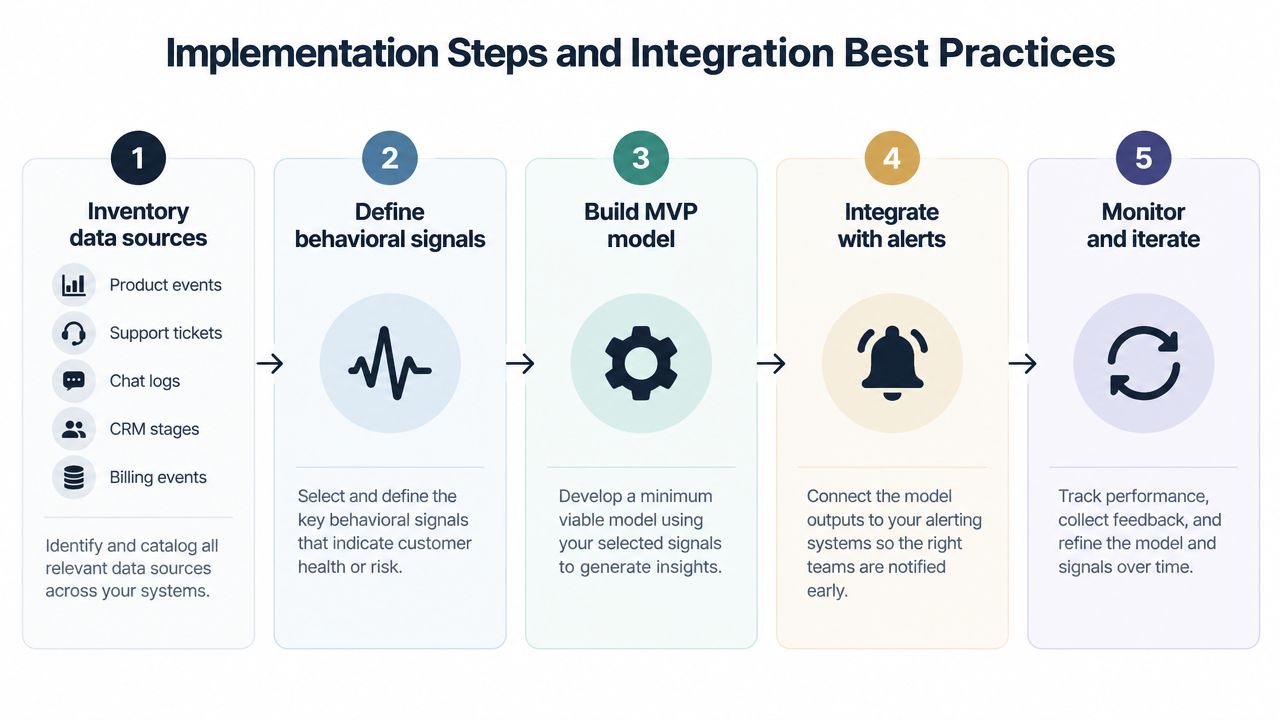
Implementation Steps and Integration Best Practices
A staged rollout works better than trying to build the full system before earning trust in the signal. Failure rarely stems from a flawed idea; instead, it comes from moving too fast without validating the approach.
Start with one behavioral event stream
Pull the key data sources into a common timeline:
- Product events from your usage instrumentation
- Support events from Zendesk or Intercom
- Commercial events from CRM and billing systems
- Delivery signals from tools like Jira, Linear, and GitHub
The goal isn't perfect centralization. It's a joinable account history with enough event integrity to reconstruct behavior over time.
Score in commercial order, not just model order
If two accounts look equally risky but one has much higher renewal weight or strategic value, the queue should reflect that. Behavioral scoring without revenue weighting creates elegant analysis and poor operations.
Thresholds matter too. Set alerting rules using a precision floor the business can tolerate, not a generic probability cutoff. Teams burn out fast when a model floods Slack with plausible but low-value alerts.
Fit the signal into existing tools
Behavioral systems get adopted when they land where people already work:
- Zendesk: attach pattern context to ticket clusters
- Intercom: trigger live outreach when behavior shifts
- Linear or Jira: open engineering issues with linked account evidence
- GitHub: connect regressions to recent changes when behavior anomalies appear
One option in this category is SigOS, which is built to ingest support, conversation, and usage signals and route prioritized outputs into those existing product and support workflows. That matters more than model novelty because unused alerts create no value.
Add feedback and a kill switch
Run new models in shadow mode before acting on them. Let CSMs, PMs, or support leads review predictions and label outcomes weekly. That feedback loop does two things. It improves retraining later, and it exposes where the model is consistently wrong before it enters production decisions.
A kill switch is just as important. If event quality drops, a connector breaks, or product behavior changes sharply after a release, the team should be able to mute a drifting signal without drama.
Challenges, Privacy, Operationalization and ROI
The most important truth about behavioral pattern recognition is uncomfortable. A model can look convincing in a paper or a holdout set and still break in the wild.
Recent research on smartphone-tracked behavioral markers for depression and anxiety found that passive GPS and app-use signals showed limited discriminant ability, even while retaining some future diagnostic potential. The same 2026 survey also points toward hybrid, smaller-data, and privacy-preserving approaches because small samples and device constraints still limit generalization (research on real-world reliability and privacy-preserving approaches). The lesson for SaaS teams is direct. A benchmark isn't the same thing as a reliable production signal.
Where production systems usually fail
| Challenge | Mitigation | Typical ROI Impact |
|---|---|---|
| Distribution drift after product changes | Monitor feature stability and pause unstable signals | Protects trust in alerts and avoids wasted intervention time |
| Missing or broken event collection | Add event QA and fallbacks before scoring | Prevents false spikes and false silence |
| Label bias from human attention patterns | Audit by outcome, not by which accounts got rep attention | Improves who gets flagged, not just who got noticed |
| Privacy overreach | Aggregate at account or workspace level, respect consent, minimize sensitive exports | Reduces compliance risk and increases internal adoption |
| Dashboard abandonment | Push signals into tools with clear owners and action paths | Turns insight into actual workflow change |
Privacy and operational discipline
The cleanest pattern system isn't the one that surveils individuals most aggressively. It's the one that uses enough behavioral detail to support decisions while minimizing unnecessary sensitivity. Account-level or workspace-level aggregation often gives teams what they need without creating avoidable privacy exposure.
Operationalization is the other frequent weak point. If alerts live in a dashboard nobody checks, the system is dead on arrival. Teams need owners, escalation rules, and obvious next actions inside the tools they already watch.
Keep the model honest by asking one question every week: which alerts changed a decision, and which ones only created noise?
SigOS helps product teams turn support tickets, chat transcripts, sales calls, and usage signals into behavioral patterns tied to churn, expansion, and revenue impact. If you want a system that fits into the tools your team already uses and surfaces the signal behind noisy customer behavior, visit SigOS.
Keep Reading
More insights from our blog
Ready to find your hidden revenue leaks?
Start analyzing your customer feedback and discover insights that drive revenue.
Start Free Trial →