What Is a Good Churn Rate Benchmarks and Fixes
What is a good churn rate? See B2B SaaS benchmarks by segment, how to calculate churn and interpret it with NRR and cohorts.
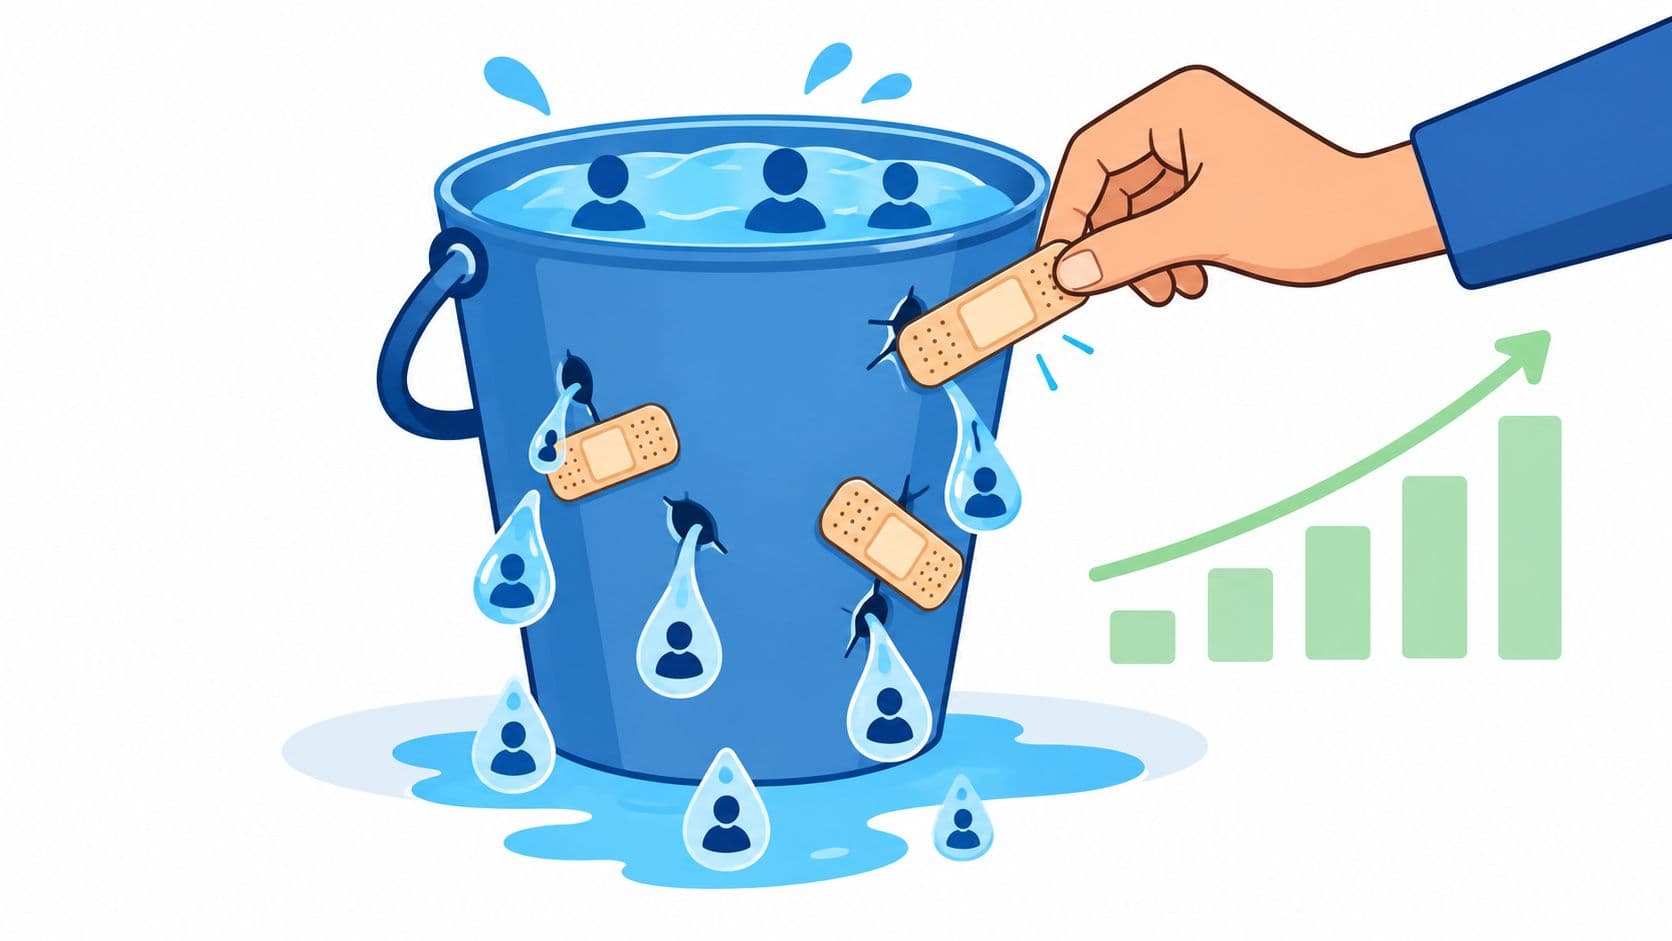
Your acquisition dashboard looks healthy, new trials keep arriving, and sales is closing enough deals to satisfy the forecast. Yet the recurring revenue line still feels unstable. Each month, familiar customers cancel, downgrade, or disappear after a failed payment, forcing the team to replace revenue it thought it had already won.
That's why the question “what is a good churn rate?” matters more than a single growth percentage. Churn measures how reliably your product keeps the revenue and relationships it has already earned. It influences customer lifetime value, CAC payback, forecasting confidence, and the amount of new business required just to stand still.
The useful answer isn't one universal cutoff. A healthy rate depends on customer segment, average contract value, contract length, company stage, and the metric you're measuring. Enterprise software has different retention economics from an SMB or prosumer product, and logo churn can tell a very different story from revenue churn.
This guide builds the answer progressively. You'll learn how to calculate churn, compare your result with the right benchmark, interpret it alongside MRR, ARR, cohorts, and NRR, identify the drivers behind cancellations, and prioritize fixes according to revenue at risk.
Introduction Why Churn Rate Defines SaaS Health
A SaaS team can add customers while losing ground. Suppose marketing delivers a steady stream of qualified accounts and sales closes new contracts every month. If existing customers leave at a similar pace, the company may report acquisition progress without creating dependable recurring revenue.
That pattern is easy to miss because acquisition metrics arrive quickly. A new signup appears in a dashboard almost immediately, while churn often emerges later through a cancellation, a renewal decision, a downgrade, or a payment failure. The result is a business that looks active but struggles to compound.
Churn is a stability signal. It tells you how much of your installed customer base or recurring revenue survives a defined period. A low rate generally means customers continue receiving enough value to justify staying. A rising rate can point to weak onboarding, poor adoption, service friction, product gaps, pricing misalignment, or customers who were never a strong fit.
Practical rule: Judge retention by the revenue relationship you're trying to protect, not by a headline percentage copied from another SaaS company.
The financial connection is direct. If customers leave sooner, the revenue lifetime attached to each acquisition becomes shorter. That can make sales and marketing payback harder to achieve, especially when contracts are complex or implementation requires significant effort. Longer retention gives teams more time to recover acquisition costs, deliver outcomes, and create expansion opportunities.
The right question, then, isn't whether churn is "low." Ask four questions:
- Who is leaving? Enterprise, mid-market, SMB, or prosumer customers may have structurally different behavior.
- What are you measuring? Logo churn counts accounts, while revenue churn measures recurring revenue lost.
- What is the trend? A rate moving downward can be healthier than a temporarily low rate that is rising.
- What happens after expansion? Upsell and cross-sell can offset losses, which is why NRR belongs in the same review.
By the end, you'll have a practical benchmark, a clean calculation method, and a prioritization workflow for turning churn signals into retention work.
Understanding Churn Rate and How to Calculate It
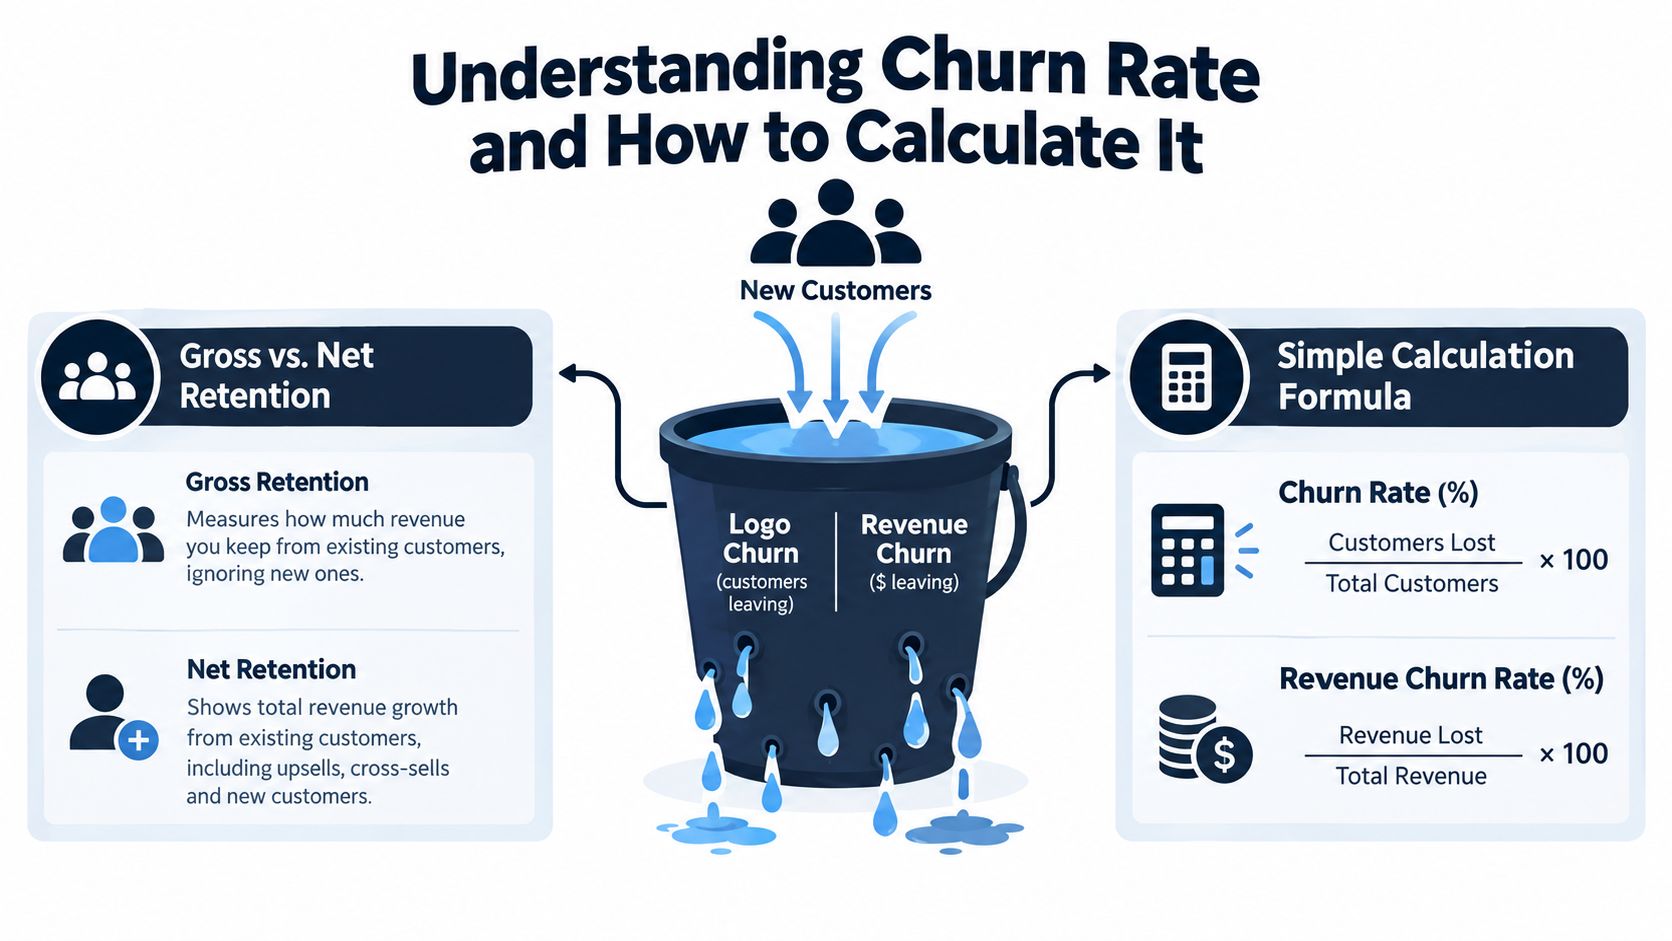
Calculating churn requires two related views: logo churn and revenue churn. Logo churn counts customer accounts, while revenue churn weights those accounts by the recurring revenue they represent. Together, they show whether customers are leaving and how much financial value leaves with them.
A logo means one customer account, regardless of size.
Logo churn rate = customers lost during the period ÷ customers at the start of the period × 100
For a monthly calculation, divide the accounts lost during the month by the account count on the first day. Apply the same counting rules every period. Consistency makes comparisons useful. Teams can review this guide to calculating customer churn correctly for a clearer calculation process.
Revenue churn applies the same logic to recurring revenue:
Gross revenue churn = recurring revenue lost from cancellations and downgrades ÷ recurring revenue at the start of the period × 100
Gross revenue churn excludes expansion. It answers, “How much starting recurring revenue disappeared before upsells or cross-sells?” Net revenue churn includes those gains:
Net revenue churn = (lost recurring revenue minus expansion revenue) ÷ starting recurring revenue × 100
A positive result means lost revenue exceeds expansion. A negative result means expansion offsets the losses. This distinction prevents a common mistake: a business can have modest logo churn while losing substantial revenue if the departing accounts have high ACV. The reverse can also happen when many small accounts leave but larger customers expand.
Choosing the right denominator
Beginning-of-period customers are easy to audit and work well for a stable base. An average-customer denominator can help when substantial new business changes the base during the period. Choose one method, document it, and do not switch because another produces a more favorable result.
Separate voluntary churn from involuntary churn. A customer who cancels after failing to achieve value needs a different response from one lost because a payment method expired. Track downgrades and contractions too. The logo remains active, but its revenue contribution falls.
Monthly churn should not be multiplied mechanically to create an annual figure. Retention compounds because each month starts with the customers who remained in the previous month. Vena Solutions' guide notes that 1% monthly churn becomes roughly 11.4% annually, showing why annualization is nonlinear (Vena Solutions' SaaS churn rate guide).
For consistent definitions across finance, product, and customer success, teams can review SaaS churn metrics. Use the resulting logo churn, revenue churn, and NRR views to identify which segment and contract type deserves attention first.
What Is a Good Churn Rate by Industry Segment and Stage
A good churn rate depends on who leaves, how much they pay, and how often contracts renew. For a practical B2B SaaS starting point, below 1% monthly churn is often associated with under about 5% annual churn for larger or more stable customer bases, according to Younium's SaaS churn benchmark. Use that range as a reference, not a universal pass or fail grade.
Enterprise products typically have higher ACV, longer contracts, deeper integrations, and more stakeholders. These conditions can lower logo churn, while making each lost account financially significant. SMB and prosumer products often have shorter commitments, lower switching costs, and more variable budgets, so higher logo churn may fit the business model.
| Segment | Healthy Monthly Logo Churn | Implied Annual Churn | Actionable context |
|---|---|---|---|
| Enterprise SaaS | Below 0.5% to 1% | About 6% to 10% annually for the 0.5% to 1% range | Audit renewal timing, executive sponsorship, and stakeholder coverage. Losing one account may materially affect revenue. |
| Mid-market SaaS | Roughly 1% to 2% | Varies with compounding and contract structure | Review onboarding completion, adoption by key users, and renewal risks before contracts enter their final period. |
| SMB-focused SaaS | Roughly 3% to 5% | Varies with compounding | Separate failed payments from product-driven cancellations, then improve activation and payment recovery. |
| Prosumer or SMB products | About 2% to 4% can be normal | Varies by model | Compare churn by plan, acquisition source, and usage level before changing pricing or limits. |
These ranges should not be blended without segmentation. A large SMB base can make the company-wide rate appear acceptable while an enterprise cohort loses important revenue. Vena Solutions' benchmark discussion and Livmo's SaaS churn benchmark discussion both illustrate why segment and stage affect benchmark comparisons, including broader B2B SaaS comparisons around 3.5% monthly churn.
Stage changes the comparison
Seed-stage companies may have limited customer history, changing positioning, and early adopters who tolerate product gaps. Growth-stage and scale-stage businesses usually have more established cohorts, larger revenue commitments, and stronger expectations for repeatable retention. Compare similar stages before treating a difference as a performance problem.
Recurly reports median annual churn of 1.78% or below in the top quartile of software businesses in its network, compared with an overall software median of 3.04% annually (Recurly's churn benchmarks). Treat those figures as directional because network composition and metric definitions affect comparability.
A useful decision sequence is: segment logo churn by customer type, compare revenue churn for the same groups, then check NRR and cohort movement. A low logo rate can conceal the loss of one high-ACV account. A higher logo rate may be manageable if smaller accounts leave while larger customers expand.
Your benchmark should match ACV, contract length, customer type, and expansion potential. A rate is good when it is defensible for the segment, explainable by cohort, and improving in the areas that matter most to revenue.
How to Interpret Churn Alongside MRR ARR and Cohorts
Churn becomes useful when it explains what happens to recurring revenue over time. A company can have stable logo churn and still lose substantial ARR if the departing customers are large. It can also have noticeable logo churn while maintaining or growing recurring revenue if existing accounts expand.
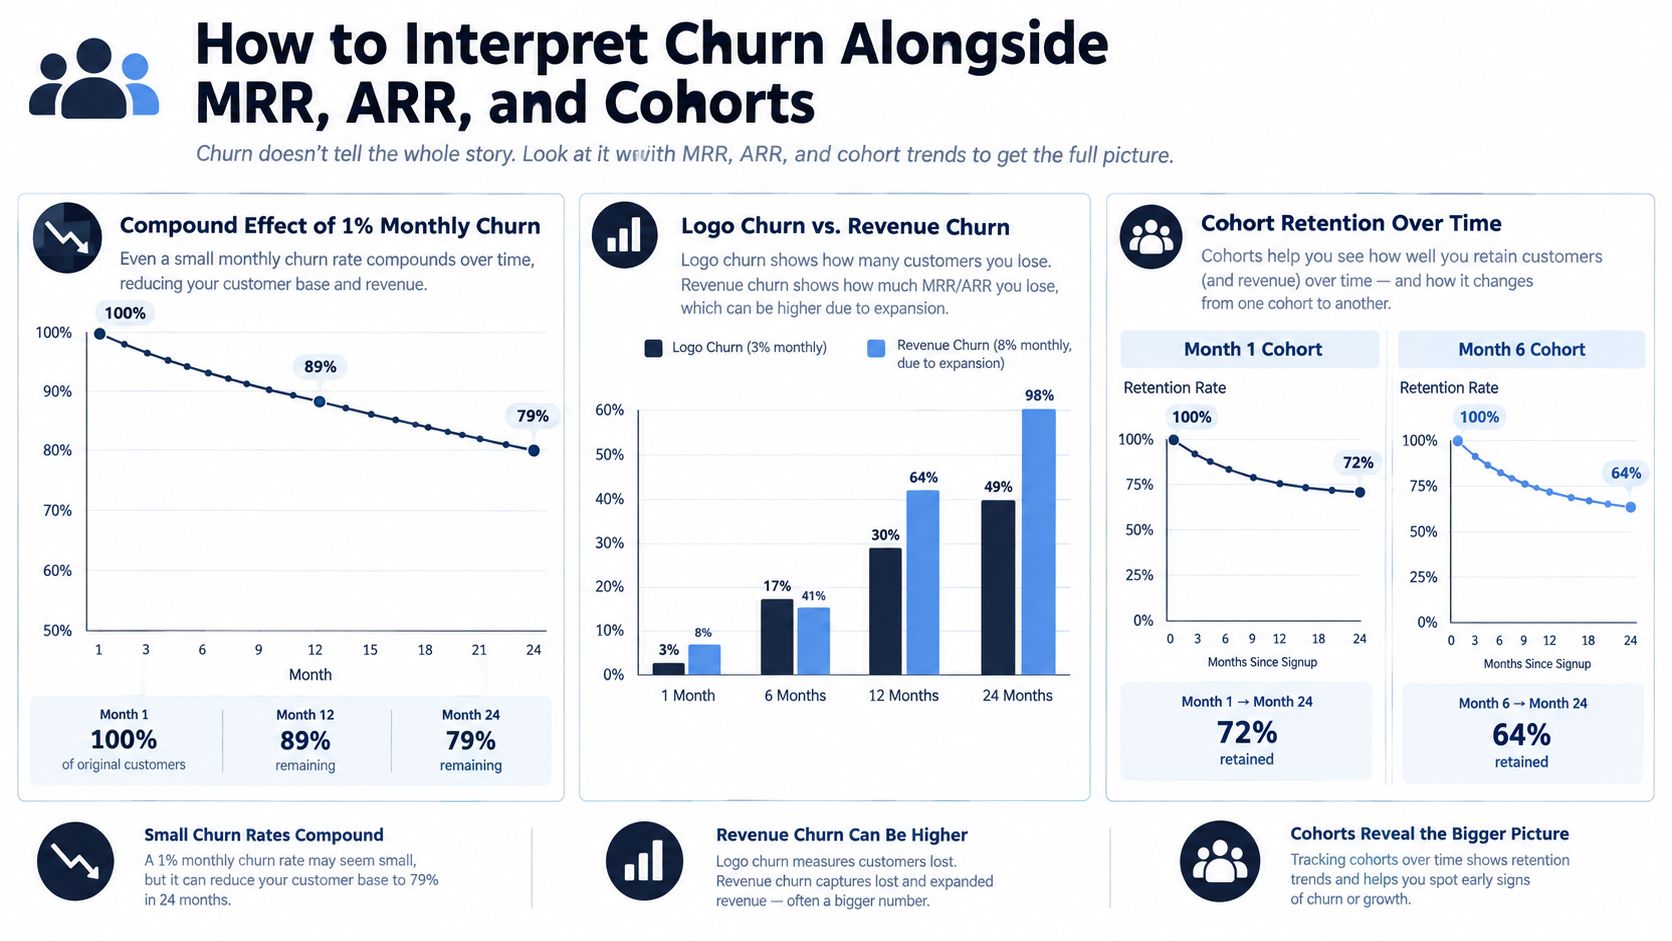
Start with the monthly compounding effect. At 1% monthly churn, retention is approximately 89% after twelve months, and the same pattern becomes approximately 79% after twenty-four months, as illustrated in the supplied cohort analysis visual. The underlying lesson is simple: small monthly movements create meaningful long-term differences because each month applies to the customers who remain.
Pair customer and revenue views
Use logo churn to understand account behavior. Use gross revenue churn to understand losses before expansion. Use NRR to see whether the existing customer base grows or contracts after cancellations, downgrades, upsells, and cross-sells.
This distinction prevents a common mistake. A company may lose smaller accounts while expanding larger customers, producing an acceptable or even negative net revenue churn result. That can be commercially healthy, but it doesn't mean the smaller-customer experience is strong. The team still needs to know whether those accounts are low-fit by design or revealing an activation problem.
MRR supports the monthly operating view, while ARR helps leadership understand the annualized effect of recurring revenue changes. Review churn by:
- Customer size: Separate SMB, mid-market, and enterprise accounts.
- Plan or product tier: A low-priced plan may show different usage and cancellation behavior.
- Acquisition cohort: Compare customers who joined during different periods.
- Contract type: Distinguish monthly commitments from annual or longer agreements.
- Lifecycle stage: Look for losses soon after onboarding versus at renewal.
Cohort analysis exposes patterns that a blended rate hides. If one signup cohort drops sharply after onboarding, activation or expectation-setting deserves attention. If usage declines near renewal, customers may not be seeing enough measurable value. If revenue expands in mature cohorts but not newer ones, the product may support growth only after customers overcome early friction.
Read churn as a pattern across cohorts, segments, and revenue, not as a pass-or-fail score on one dashboard tile.
A dashboard such as this churn prediction dashboard can help teams bring behavioral signals and revenue context into the same review, provided the underlying definitions remain consistent.
Common Drivers Behind High Churn and How to Spot Them
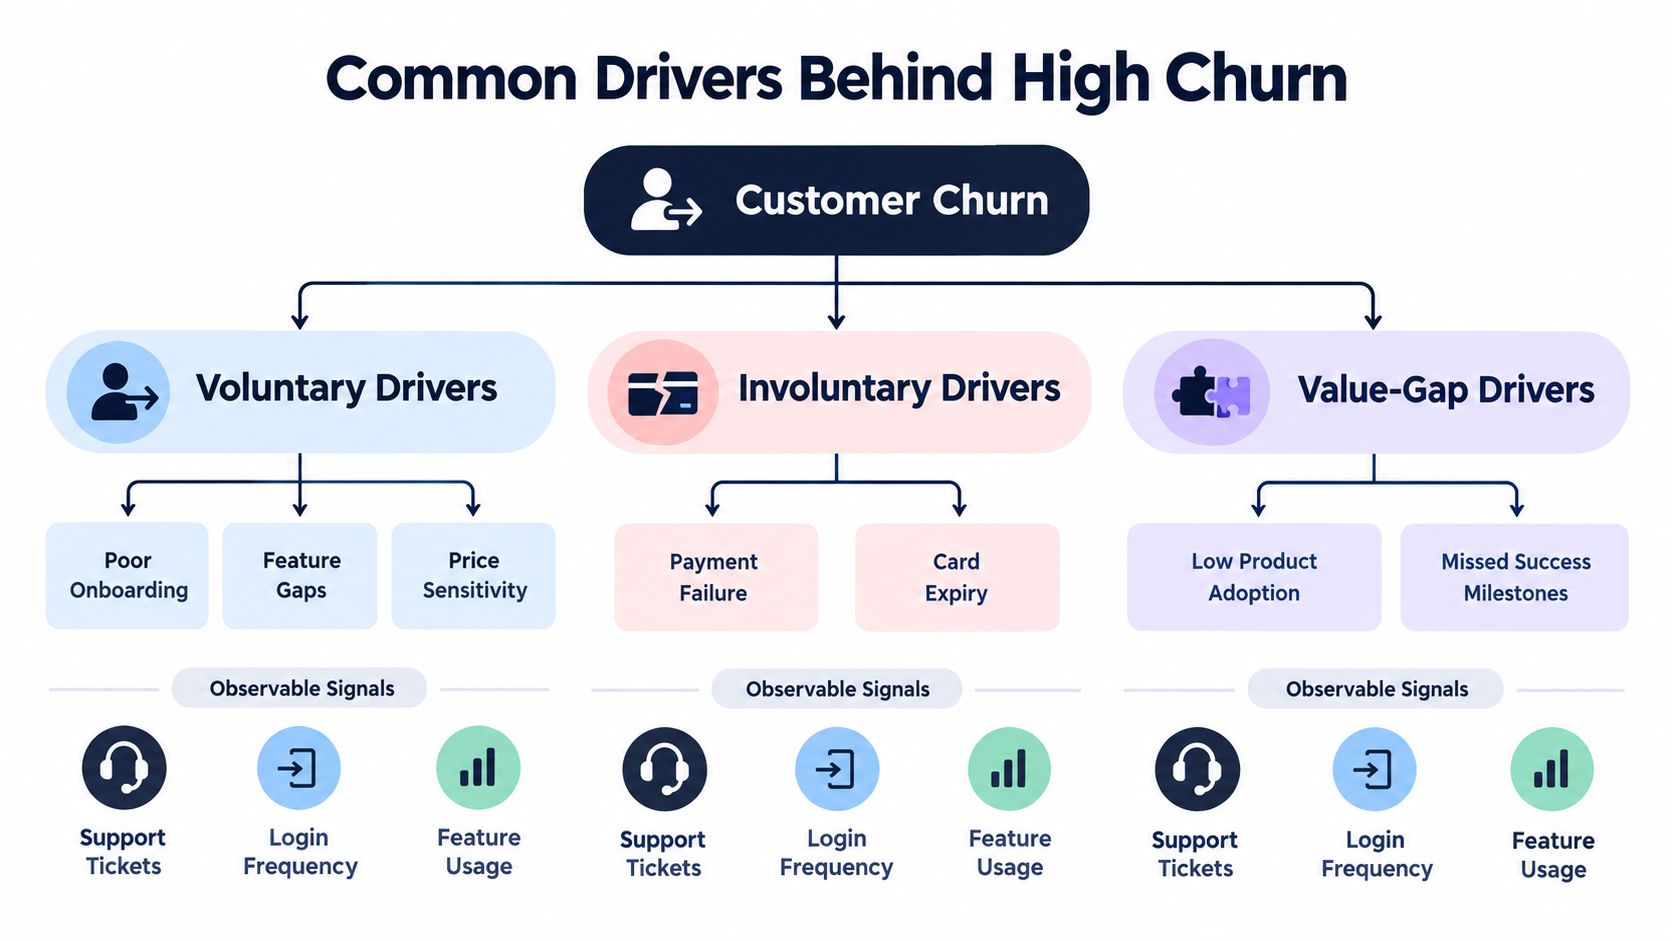
Customers rarely leave for one abstract reason called “churn.” They leave after a specific experience or a series of missed outcomes. The diagnostic task is to connect the cancellation to observable behavior before selecting a remedy.
Voluntary drivers
Voluntary churn happens when the customer chooses to cancel or not renew. Common causes include poor onboarding, missing features, price sensitivity, weak support, and a mismatch between the promised outcome and the delivered experience.
Look for a cluster rather than a single signal:
- Activation friction: Customers don't complete key setup steps or reach their first meaningful outcome.
- Feature gaps: Support tickets and sales calls repeatedly mention the same missing capability.
- Price pressure: Customers reduce usage, move to a smaller plan, or mention budget concerns without describing a product failure.
- Stakeholder disengagement: The original champion stops responding, while other users never adopt the workflow.
A product-market fit issue usually appears across a broad set of customers with similar use cases. An onboarding problem tends to concentrate in early lifecycle cohorts or around a particular setup step. That distinction changes the fix. The first may require repositioning or product investment, while the second may need better guidance, defaults, training, or ownership.
Involuntary drivers
Failed payments, expired cards, billing confusion, and administrative delays can remove a customer who still values the product. These accounts often show healthy usage until the payment event, making them easy to misclassify as product churn.
Billing workflows should identify payment problems, trigger timely reminders, and give customers a clear recovery path. If email data affects billing or lifecycle outreach, an Email Validation API can support cleaner contact records, but it won't replace clear ownership or a reliable dunning process.
Value-gap drivers
The customer may still log in but fail to connect activity with an outcome. Declining login frequency, reduced use of core features, unresolved support issues, and missed success milestones can all indicate that perceived value is weakening.
Ask what changed before cancellation:
- Did usage fall?
- Did support friction increase?
- Did the customer fail to reach a promised milestone?
- Did the account lose an internal champion?
- Did a competitor or internal alternative become easier to use?
Structured churn reasons make these patterns reportable. Free-text notes such as “not a fit” hide the difference between product gaps, pricing, service, and adoption.
Proven Strategies to Reduce Churn and Quantify Revenue Impact
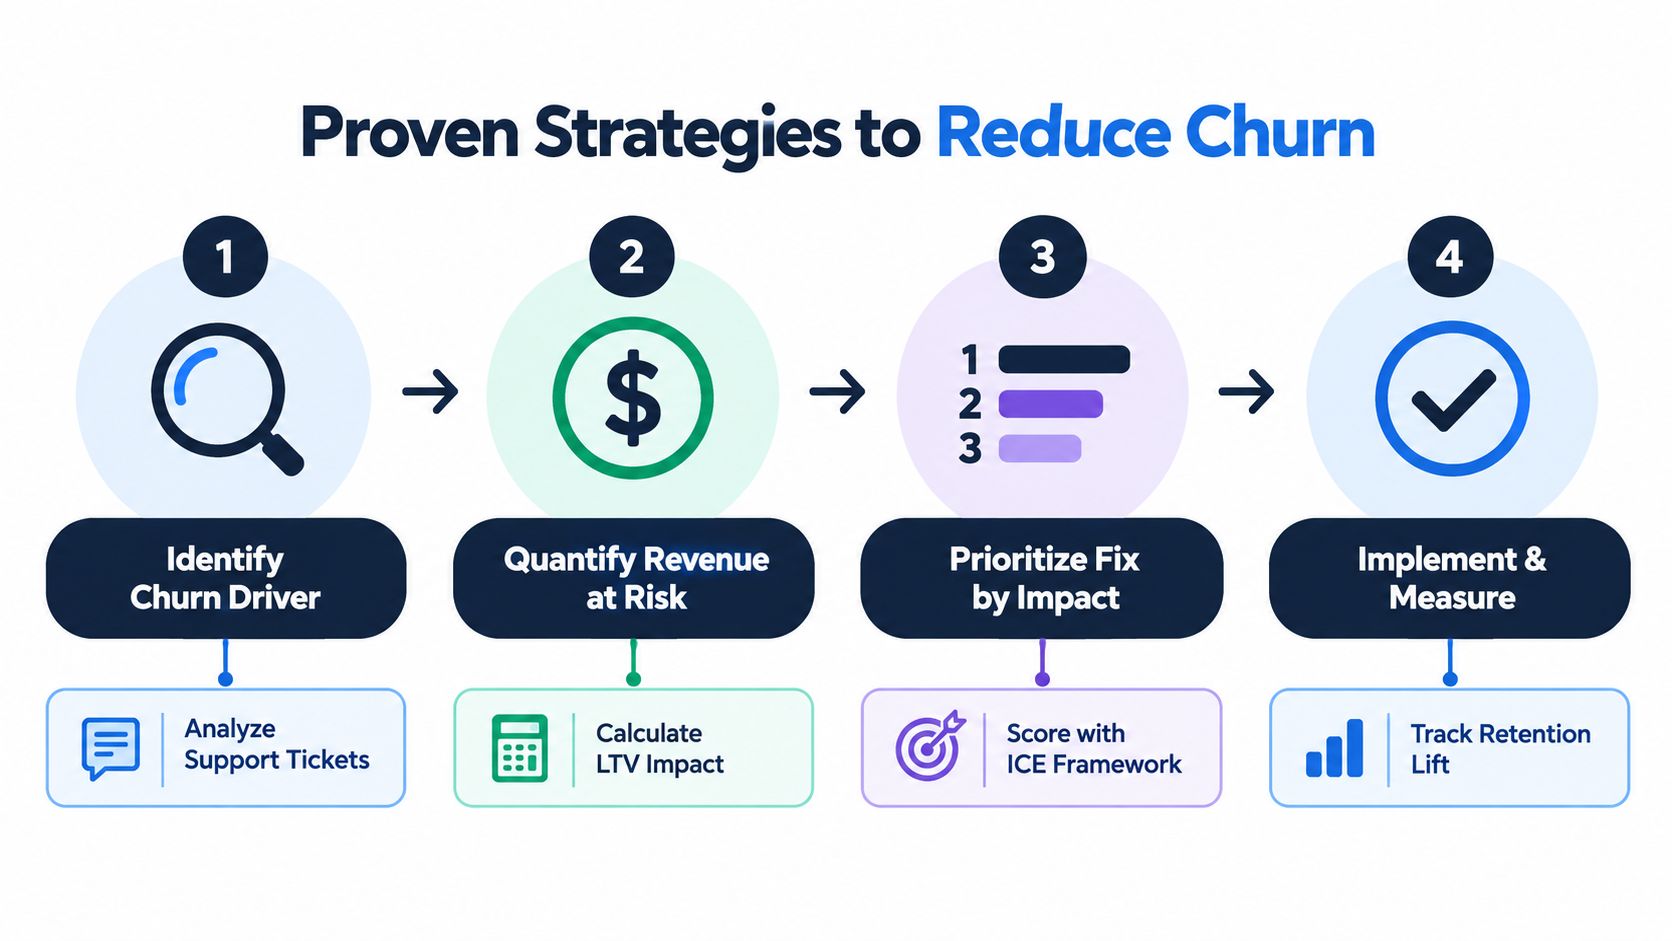
Retention work becomes easier to prioritize when the team stops treating every cancellation as equally urgent. The practical workflow is to identify the driver, quantify the recurring revenue exposed, rank the fix, and measure what changes afterward.
Identify the pattern
Combine cancellation reasons with support tickets, chat transcripts, sales calls, product usage, renewal dates, and payment events. Tag each account with a primary driver and preserve secondary context. A repeated issue across several accounts deserves more attention than an isolated complaint, even when the isolated complaint is louder.
Quantify the exposure
Estimate revenue at risk by account, cohort, plan, and driver. Include current MRR or ARR, contraction already observed, renewal timing, and expansion potential. You don't need false precision. A consistent directional score is more useful than an elaborate model nobody maintains.
For example, a missing workflow might affect many small accounts, while an integration gap might threaten fewer but larger customers. The right priority depends on the revenue exposed, the likelihood of churn, the number of customers affected, and the effort required to address the cause.
Prioritize the intervention
Use a simple scoring model such as impact, confidence, and effort. A retention issue rises when it affects high-value accounts, appears repeatedly in behavioral data, and has a plausible fix that the team can deliver.
Possible interventions include:
- Onboarding repair: Simplify setup, add role-specific guidance, and define the first success milestone.
- Proactive success outreach: Contact accounts after usage declines or important milestones are missed.
- Payment recovery: Improve reminders, billing visibility, and ownership of failed-payment follow-up.
- Product feedback loops: Convert repeated requests into structured issues tied to affected revenue.
- Expansion design: Help successful customers adopt adjacent workflows, plans, or capabilities.
Prioritize the fix that protects the most valuable recurring revenue, not necessarily the issue with the highest ticket count.
Implement and measure
Assign one owner, one next action, and one deadline to each retention issue. Track whether usage recovers, support friction declines, renewals improve, or NRR changes for the affected cohort. Review the result against a comparison cohort when possible, and keep the intervention only if the evidence supports it.
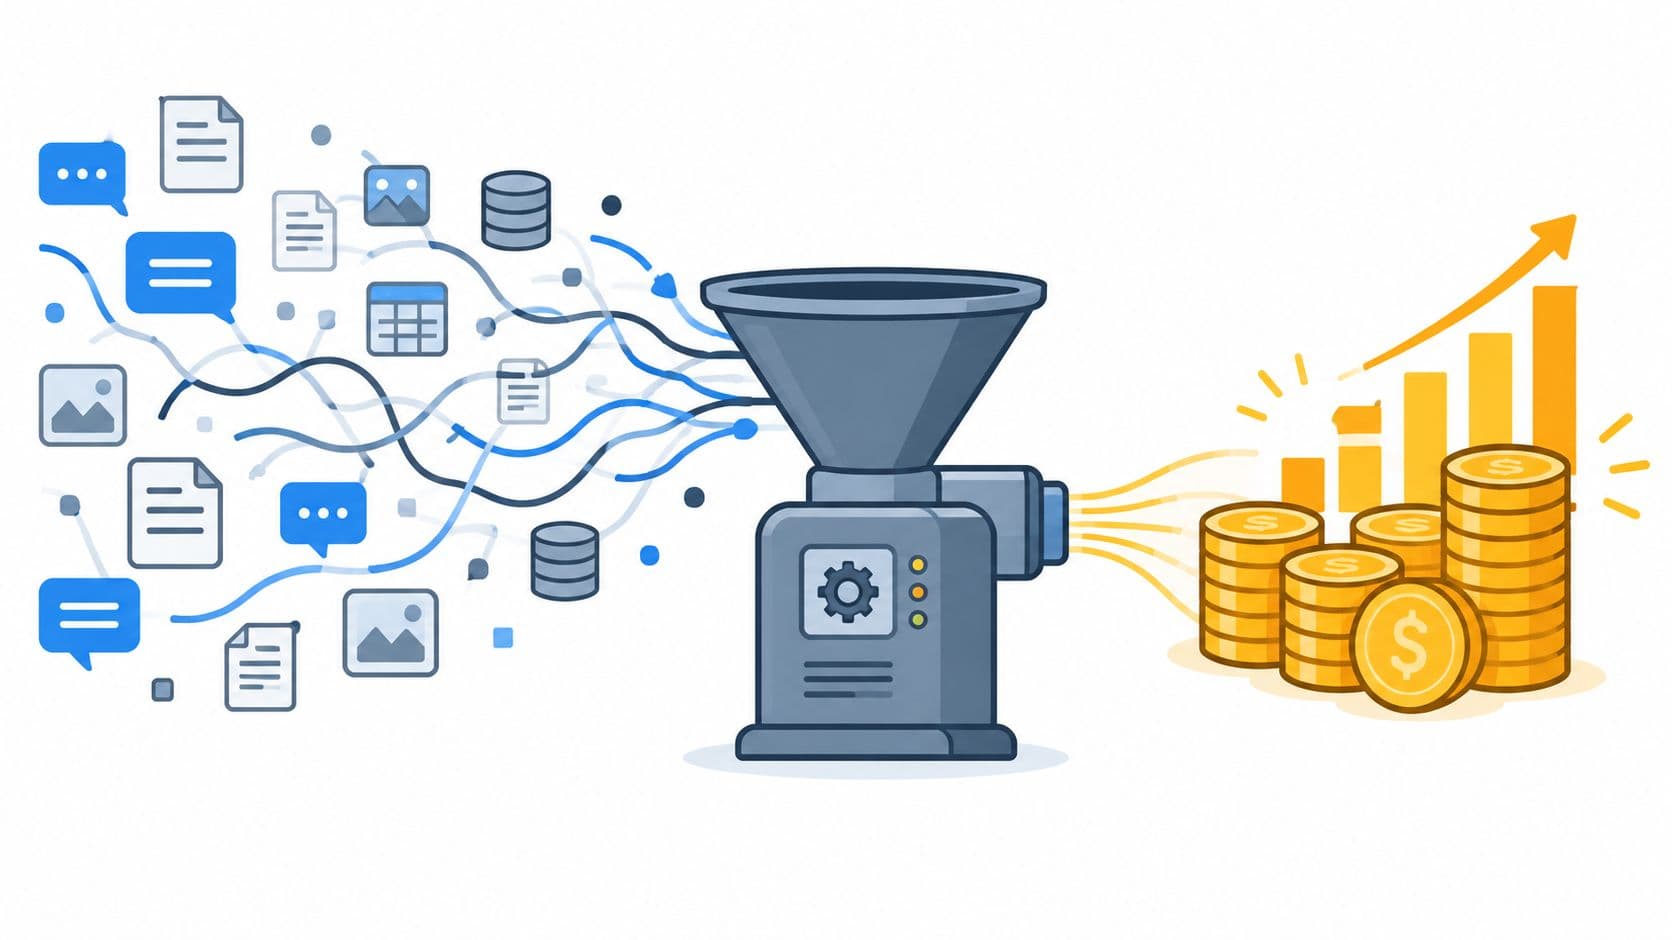
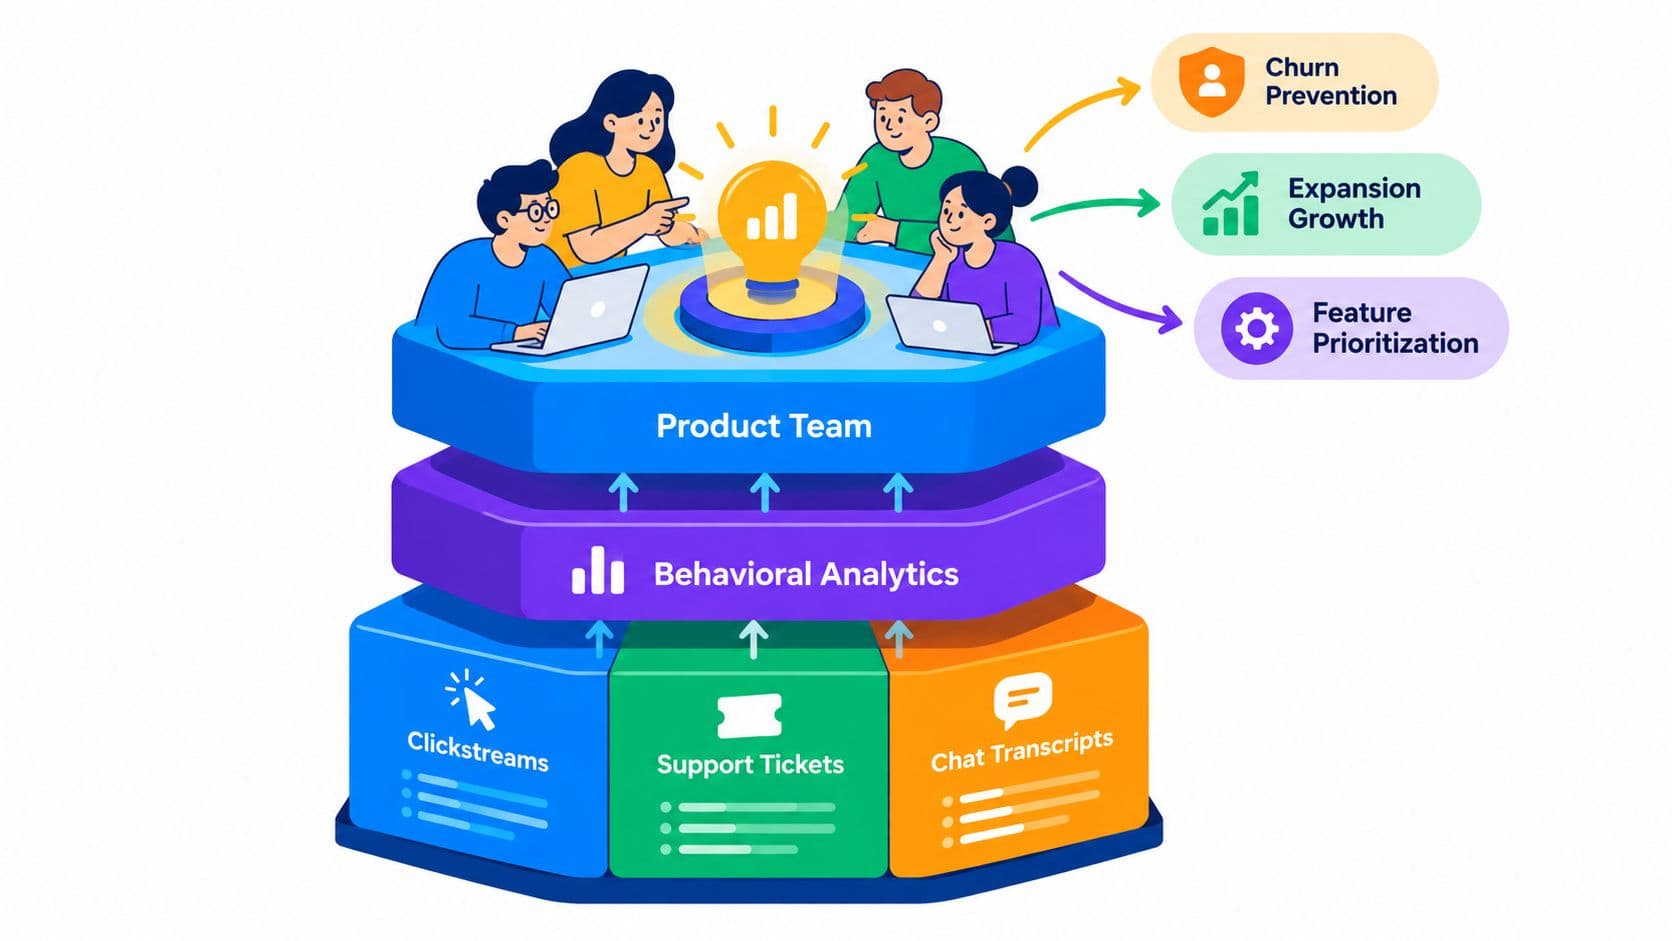
SigOS is one option for this workflow. Its product intelligence platform analyzes support tickets, chat transcripts, sales calls, and usage metrics to identify patterns associated with churn or expansion, then helps teams create issues with revenue impact scores. Teams can also use this customer churn risk resource to structure their risk review.
Conclusion Your Next Steps to Achieve a Good Churn Rate
A good churn rate is a decision threshold, not a universal percentage. Start with the customer segment, ACV, and contract length, then compare logo churn with revenue churn and NRR. A low logo churn rate can still hide serious revenue loss if a few high-ACV accounts leave. A higher logo churn rate may be manageable when smaller accounts leave and expansion from retained customers offsets the loss.
As covered in the segment benchmarks above, external ranges are useful for orientation, not as promises. Your own cohorts provide the better test because they show which customers leave, when they leave, and how much recurring revenue is exposed.
Use this audit checklist:
- Check the formula: Confirm the period, starting base, customer definition, and treatment of downgrades and failed payments.
- Separate the metrics: Review logo churn, gross revenue churn, net revenue churn, and NRR together.
- Segment the result: Compare customers by ACV, plan, contract length, industry, and lifecycle stage.
- Inspect cohorts: Identify whether churn concentrates during onboarding, after a product change, or near renewal.
- Rank revenue risk: Connect each driver to affected MRR or ARR, then assign an owner.
- Watch the trend: A rate below a peer reference is more reassuring when it remains stable or declines.
- Test expansion: Compare lost revenue with expansion from retained customers, while checking whether the remaining base stays healthy.
A practical review follows the money first. For example, a cluster of low-ACV cancellations may deserve a different response from one enterprise renewal at risk. Contract length also changes the signal: monthly churn can reveal friction quickly, while annual contracts may delay the visible result until renewal.
Give every priority issue one owner, one next action, and one deadline. Measure usage recovery, support friction, renewal outcomes, and NRR for the affected cohort. Use a comparison cohort when possible, and keep the intervention only when the evidence supports it.
Make churn a recurring operating review rather than a quarterly surprise. Each cycle, identify at-risk accounts, quantify exposed revenue, prioritize the highest-impact cause, and measure whether customer behavior changes.
SigOS helps product, customer success, and revenue teams connect support conversations, sales calls, and usage behavior to churn risk and revenue impact. Visit SigOS to see how your team can turn scattered customer signals into prioritized retention actions.
Keep Reading
More insights from our blog

Ready to find your hidden revenue leaks?
Start analyzing your customer feedback and discover insights that drive revenue.
Start Free Trial →