How to Prioritize Product Roadmap Using Revenue Signals
Learn how to prioritize product roadmap with a step-by-step framework using customer feedback, revenue impact scoring, and behavioral signals for SaaS teams.

Most product teams are taught to prioritize the features with the most votes. That advice is easy to explain, easy to put in a spreadsheet, and frequently wrong. A request count tells you how often people asked for something, not whether solving it will prevent churn, enable expansion, remove a sales blocker, or reduce an expensive operational burden.
The practical answer to how to prioritize a product roadmap starts with a different question: which customer problems have the strongest connection to revenue and retention? Feature requests, support conversations, sales objections, product usage, and customer sentiment all matter, but they don't carry equal business weight. A single repeated problem in a strategically important account can deserve more attention than dozens of requests from low-value users.
A 2021 grey-literature review identified 18 distinct roadmap-prioritization techniques, which is useful evidence that prioritization isn't one universal formula. The review found that most techniques prioritize outputs by weighing factors such as impact and effort, while others focus on risky assumptions or outcomes, and it concluded that cross-functional participation produces better decisions because product, engineering, sales, and customer-facing teams see different parts of value and risk. The review supports a practical conclusion: the framework matters, but the quality and diversity of the evidence matter more.
Why the Loudest Requests Rarely Deserve Top Priority
The loudest request often belongs to the person with the easiest access to your team, not the customer whose account is most exposed to churn. A sales executive may escalate a missing integration because it affects a live deal. A power user may repeatedly request an advanced setting because it improves an unusual workflow. A support team may see the same bug across many customers, but each ticket may represent a different level of commercial risk.
Treating those inputs as votes collapses important distinctions. Popularity is a signal of attention, not a measurement of value. Raw volume can overrepresent highly engaged users, customers who submit detailed feedback, or accounts with a particularly vocal internal champion. It can also hide silent failure. Customers who reduce usage or stop renewing may never submit a request at all.
Practical rule: Count requests to understand prevalence, but weight them to understand consequence.
A better roadmap conversation separates four questions:
- Who is affected? Identify the customer segment, account importance, use case, and role experiencing the problem.
- What behavior changed? Look for declining usage, abandoned workflows, repeated manual workarounds, support escalation, or reduced adoption after a release.
- What commercial outcome is exposed? Connect the issue to renewal risk, expansion potential, a blocked deal, implementation cost, or support burden.
- How strong is the evidence? Distinguish a direct observation in product data from a speculative statement in a sales call.
This approach changes the backlog from a popularity contest into an evidence map. A feature request from an enterprise prospect might matter because it blocks a high-value opportunity, while a heavily requested cosmetic improvement might have no clear effect on retention or expansion. Neither should be dismissed automatically. They should be evaluated against the same commercial definitions.
The operational need is substantial. Product-management coverage citing a 2024 industry report says 73% of product teams struggle with feature prioritization, making it the top product-development challenge in that report. The cited industry coverage also references a 2021 benchmark in which product managers spent an average of 19 hours per month articulating and prioritizing requirements and 12 hours planning and communicating the roadmap. Those figures show why a repeatable system matters. Teams can't afford to debate every request from scratch, especially when unstructured opinions keep overturning earlier decisions.
Building a Repeatable Prioritization Workflow
A useful prioritization process behaves like an operating loop, not an annual ceremony. The team collects evidence, converts it into comparable inputs, sequences initiatives, validates the decision, and reviews what happened after delivery. A 2021 review describes prioritization as a cross-functional activity, while practical guidance recommends gathering feedback, quantifying value and complexity, choosing an appropriate framework, and running retrospectives to improve the scoring system. The product-roadmap prioritization guide also warns against adding complexity before the organization's data and decision needs can support it.
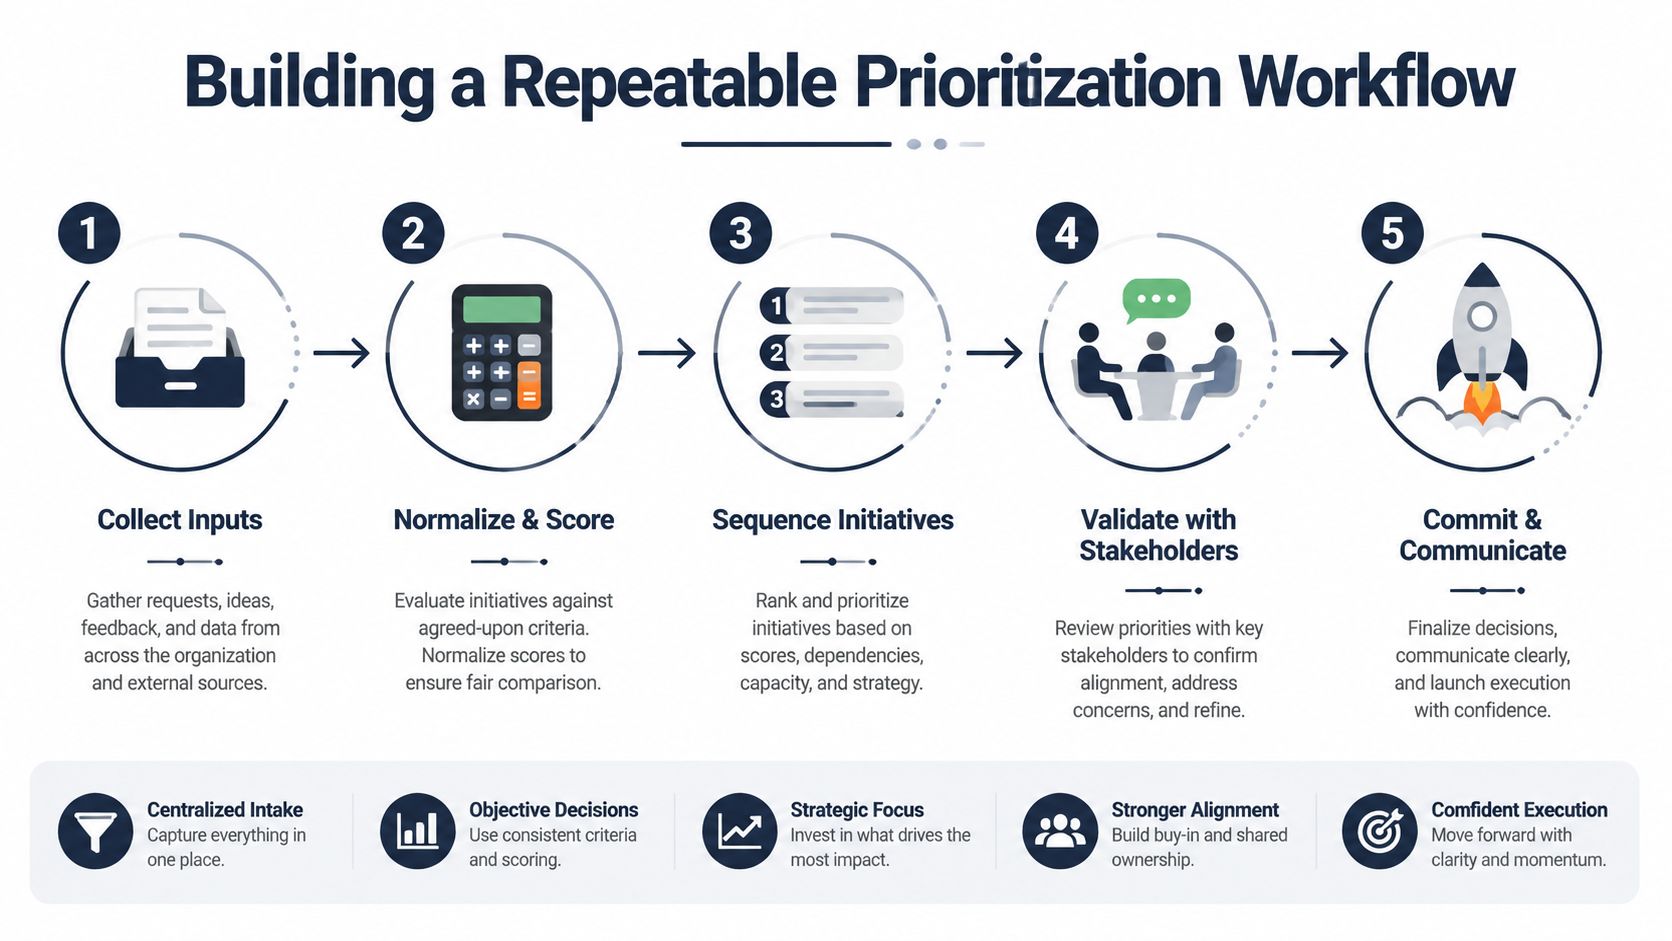
Start with one evidence backlog
Bring support tickets, sales notes, customer-success escalations, product analytics, survey responses, and existing roadmap ideas into a shared backlog. Don't let each department maintain a separate list that product must reconcile manually during planning. Every item should describe the customer problem, affected segment, evidence source, suspected business outcome, and current confidence level.
Normalize language before scoring. “Export is missing,” “customers need better reporting,” and “prospects require audit-ready data” may describe different problems, or they may be different descriptions of the same problem. Group them around the underlying need, then preserve the original evidence so stakeholders can inspect the reasoning.
Quantify value and complexity
Score business value before debating solutions. Capture direct revenue potential, churn exposure, support-cost reduction, strategic enablement, customer reach, and confidence in the evidence. Engineering should then estimate complexity, dependencies, technical risk, and discovery work.
Keep the scales explicit. If a value score means “likely to influence renewal,” document what qualifies and what doesn't. A score without a shared definition only creates the appearance of objectivity.
Choose a framework that fits the team
Early-stage teams often need a lightweight value-versus-effort view or a short weighted scorecard. More mature teams with cleaner behavioral data can use RICE, ICE, or preference research such as MaxDiff. A practical guide to building a product roadmap can help teams connect product goals, customer needs, and sequencing without turning the roadmap into a feature inventory.
Use the framework to rank initiatives, then sequence only the work the team can realistically support. A Now, Next, Later view is often clearer than a long ordered list because it communicates commitment levels without pretending that distant estimates are precise. For additional approaches, review backlog prioritization techniques and compare them with the evidence available to your team.
Run a retrospective after each cycle
After delivery, compare the original prediction with observed behavior. Did the target segment adopt the change? Did the suspected churn pattern stabilize? Did a sales blocker disappear? Did support volume change? The answers should update your scoring definitions and confidence, not just populate a post-launch report.
Scoring Revenue Impact Beyond Request Counts
Revenue impact rarely arrives in a clean column. A support ticket may reveal a broken workflow, a sales transcript may expose a deal blocker, usage data may show abandonment, and a customer comment may signal frustration without naming a solution. The product manager's job is to connect those fragments without pretending that every estimate is equally certain.
Start by scoring the problem, not the requested feature. A customer might ask for a new dashboard, but the underlying need could be proving value to an executive sponsor. Another customer might ask for an export, while their actual risk is that analysts can't incorporate your product into a recurring workflow. The requested solution is an input for discovery. It isn't automatically the roadmap item.
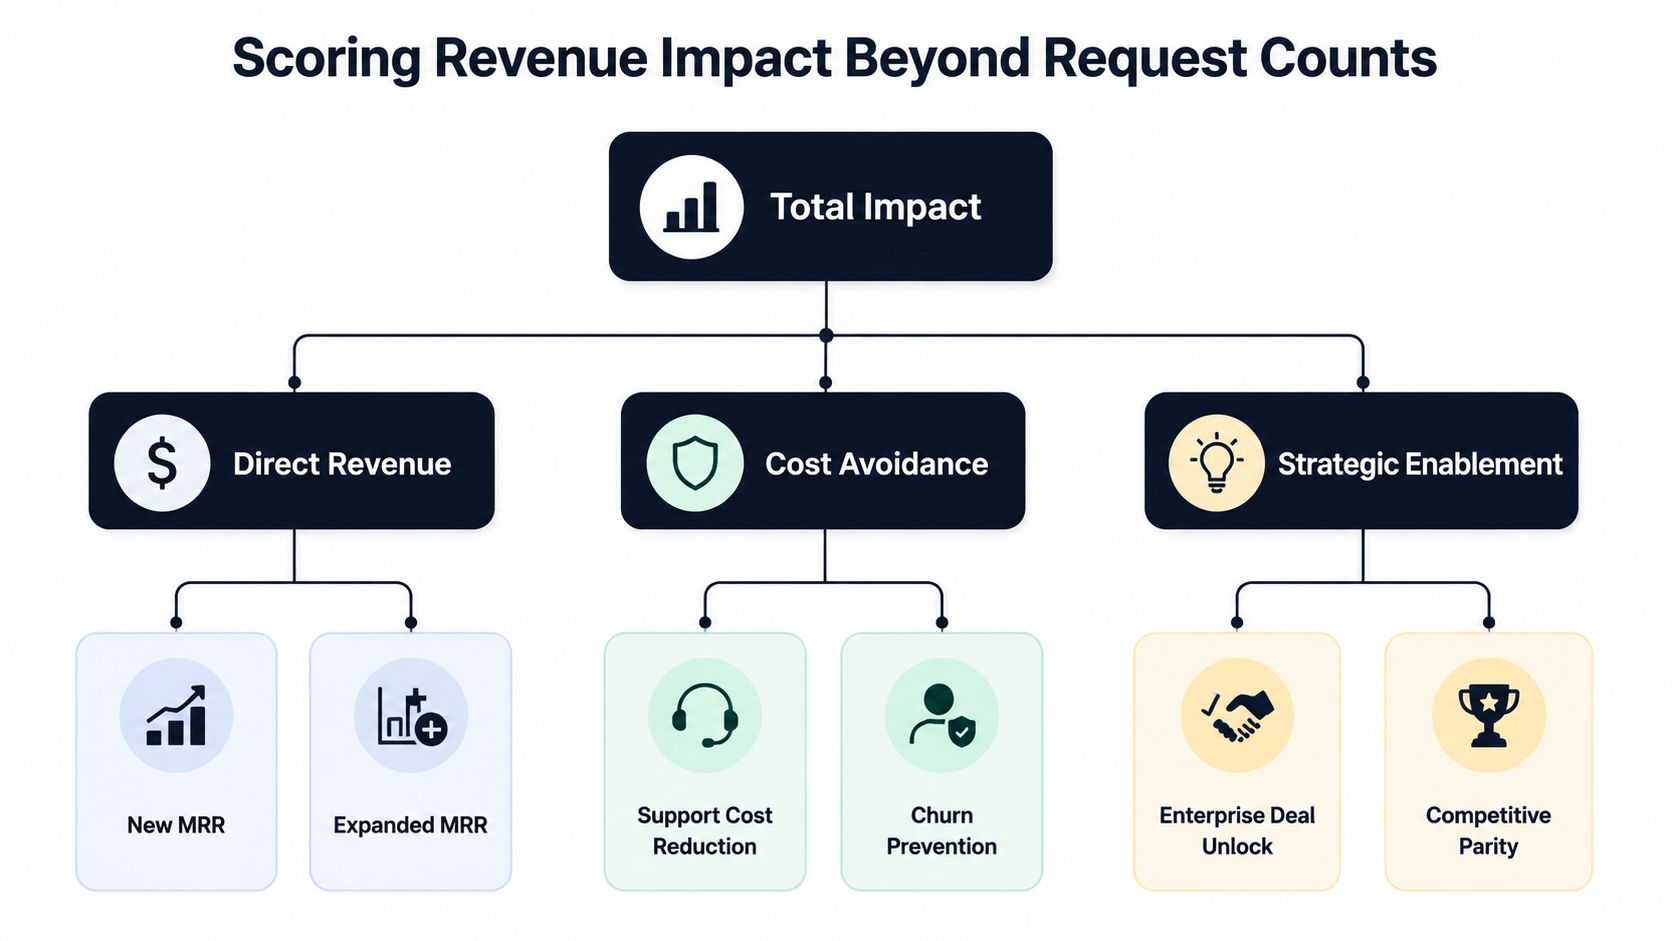
Build a revenue-impact rubric
Use separate categories so teams don't hide one type of value inside another:
- Direct revenue: Document new business or expanded usage that the initiative could support. Link the item to identifiable opportunities, account plans, or an existing monetization path.
- Cost avoidance: Estimate whether the problem creates recurring support work, implementation effort, or preventable service burden. Record the operational evidence rather than assigning value because a team believes the feature will save time.
- Churn prevention: Identify renewal exposure, declining usage, unresolved critical workflows, or repeated escalations in accounts that matter commercially. Mark the evidence as observed, inferred, or unvalidated.
- Strategic enablement: Capture enterprise requirements, competitive parity, platform dependencies, or capabilities that enable future expansion. Don't treat strategic language as a free pass. State the mechanism that connects the work to the business outcome.
The score should preserve uncertainty. For example, a confirmed renewal blocker can receive a high confidence rating, while a feature that “could help expansion” should receive a lower one until account evidence or behavior supports it. A high potential value with low confidence often deserves discovery or a targeted validation experiment rather than immediate full delivery.
Use behavior to test the story
Feedback tells you what customers articulate. Behavior tells you what they do when the problem remains. Review usage drops after a product change, repeated workarounds in valuable accounts, abandoned setup steps, low adoption of an adjacent capability, and increased support contact around the same workflow.
A practical record for each initiative includes:
| Evidence | Interpretation | Confidence |
|---|---|---|
| Repeated request from one segment | The problem may be concentrated, not broad | Needs segment validation |
| Usage decline in an affected workflow | The problem may be limiting realized value | Stronger behavioral evidence |
| Sales objection tied to an active opportunity | The gap may block acquisition or expansion | Validate with account context |
| Sentiment decline without usage change | The issue may affect perception before behavior | Monitor and investigate |
The point isn't to manufacture a precise dollar figure from weak evidence. The point is to make assumptions visible, rank comparable risks, and show stakeholders why one item outranks another. Guidance on prioritizing from user feedback recommends centralizing support, sales, usage, and sentiment data, then weighting it by customer value and business context rather than raw request counts. That guidance also highlights sentiment analysis and customer-demand modeling as newer ways to improve the signal.
Choosing the Right Framework for Your Team Maturity
Not every team needs RICE, and not every team has the research discipline to use MaxDiff well. A framework should reduce disagreement by making assumptions explicit. If it creates more arguments about the spreadsheet than clarity about the customer problem, the team has outgrown the process or adopted it too early.
RICE is useful when the team can estimate reach, impact, confidence, and effort with reasonable consistency. ICE removes reach and can be faster when the audience is narrow or reach data is unreliable. MoSCoW works well for communicating categories to a broad group, but teams must resist labeling everything a “Must have.” Value-versus-effort is excellent for early conversations and small backlogs, while MaxDiff is suited to structured preference research after the team has narrowed a large feature set. PlanBeyond's explanation of MaxDiff distinguishes simple feature counts from average feature utility, with utility providing a more precise basis for ranking ideas.
Prioritization Framework Decision Matrix
| Framework | Best For | Data Required | Team Maturity |
|---|---|---|---|
| RICE | Comparing initiatives with different reach and effort profiles | Reach, impact, confidence, effort | Growing teams with usable product data |
| ICE | Fast ranking of hypotheses when reach is difficult to estimate | Impact, confidence, effort | Early to growing teams |
| MoSCoW | Communicating scope and negotiating release boundaries | Shared definitions of necessity | Any team, especially cross-functional groups |
| Value-versus-effort | Quickly separating likely wins from expensive low-value work | Relative value and complexity | Early-stage or time-constrained teams |
| MaxDiff | Ranking customer preferences across a narrowed set of ideas | Structured preference responses and utility analysis | Mature teams with research capability |
Match complexity to evidence quality
A weighted scorecard can incorporate revenue exposure, churn risk, strategic fit, feasibility, and confidence, but the weights should reflect the current business objective. Don't assign elaborate weights when the underlying inputs are guesses. Start with a small number of criteria, audit how well predictions match outcomes, and add complexity only when the simpler model fails to separate meaningful choices.
Teams that mine feature requests from unconventional sources can improve discovery before scoring. For example, mining feature requests from YouTube may reveal recurring workflow friction in tutorial comments, but those requests still need segment, behavioral, and commercial validation. Pairing that research with a feature prioritization matrix gives the team a way to compare qualitative demand with business impact and delivery constraints.
Reprioritizing When the Evidence Changes
A quarterly roadmap creates useful focus, but it becomes dangerous when teams treat it as a promise to ignore new evidence. A sudden churn signal, a stalled enterprise opportunity, or a sharp sentiment change can alter the value of an initiative before the next planning cycle arrives. Static plans are especially fragile for SaaS products, where customer behavior, competitive pressure, and commercial context change continuously.
The answer isn't to let every stakeholder interrupt delivery. It is to define evidence-based review triggers before the crisis happens. A trigger should raise an item for assessment, not automatically send it into development.
Useful triggers include:
- A new cluster of escalations from strategically important accounts.
- A sustained drop in adoption for a workflow tied to renewal or expansion.
- A sales opportunity blocked by a missing capability, with the commercial context documented.
- A meaningful shift in customer sentiment around a recently changed experience.
- New evidence that invalidates the original confidence or impact assumption.
Separate review from interruption
When a trigger fires, product should first confirm the pattern, identify the affected segment, and compare the new evidence with the current roadmap score. Engineering should assess whether an incremental mitigation, configuration change, or discovery task can address the risk without abandoning work already underway.
This distinction protects stability. The team can keep committed delivery work moving while maintaining a clearly defined review lane for emergent risks. If the evidence materially changes the expected revenue impact, the product manager can revise sequencing and explain exactly which assumption changed.
Continuous analysis supports this operating model because teams can inspect fresh customer and product signals instead of waiting for a planning meeting. Real-time data analytics is most useful here when it feeds a defined decision process, not when it produces alerts that nobody owns.
A practical communication note should contain four facts: the new evidence, the affected business outcome, the decision made, and the work that moves as a result. Stakeholders don't need a promise that priorities will never change. They need confidence that changes follow a visible rule.
This short video can serve as a useful prompt for discussing how teams interpret changing evidence during roadmap decisions:
The strongest roadmap isn't the one that survives unchanged. It is the one that changes deliberately when the evidence changes, while preserving enough stability for teams to execute.
Aligning Product and Revenue Teams on Priorities
Alignment improves when each function brings evidence tied to a business outcome, rather than a louder request. Sales may report a demo blocker, customer success may flag a renewal at risk, support may show repeated failures, and engineering may identify a dependency that changes delivery cost. Product's role is to compare those signals using the same criteria and make the trade-off visible.
Create one evidence repository before the review. Each item should include the normalized problem, affected accounts or segments, observed behavior, dollar value or churn exposure, confidence, and complexity estimate. Request volume can provide context, but it should not outweigh evidence that a smaller group of high-value accounts is blocked or showing declining use.
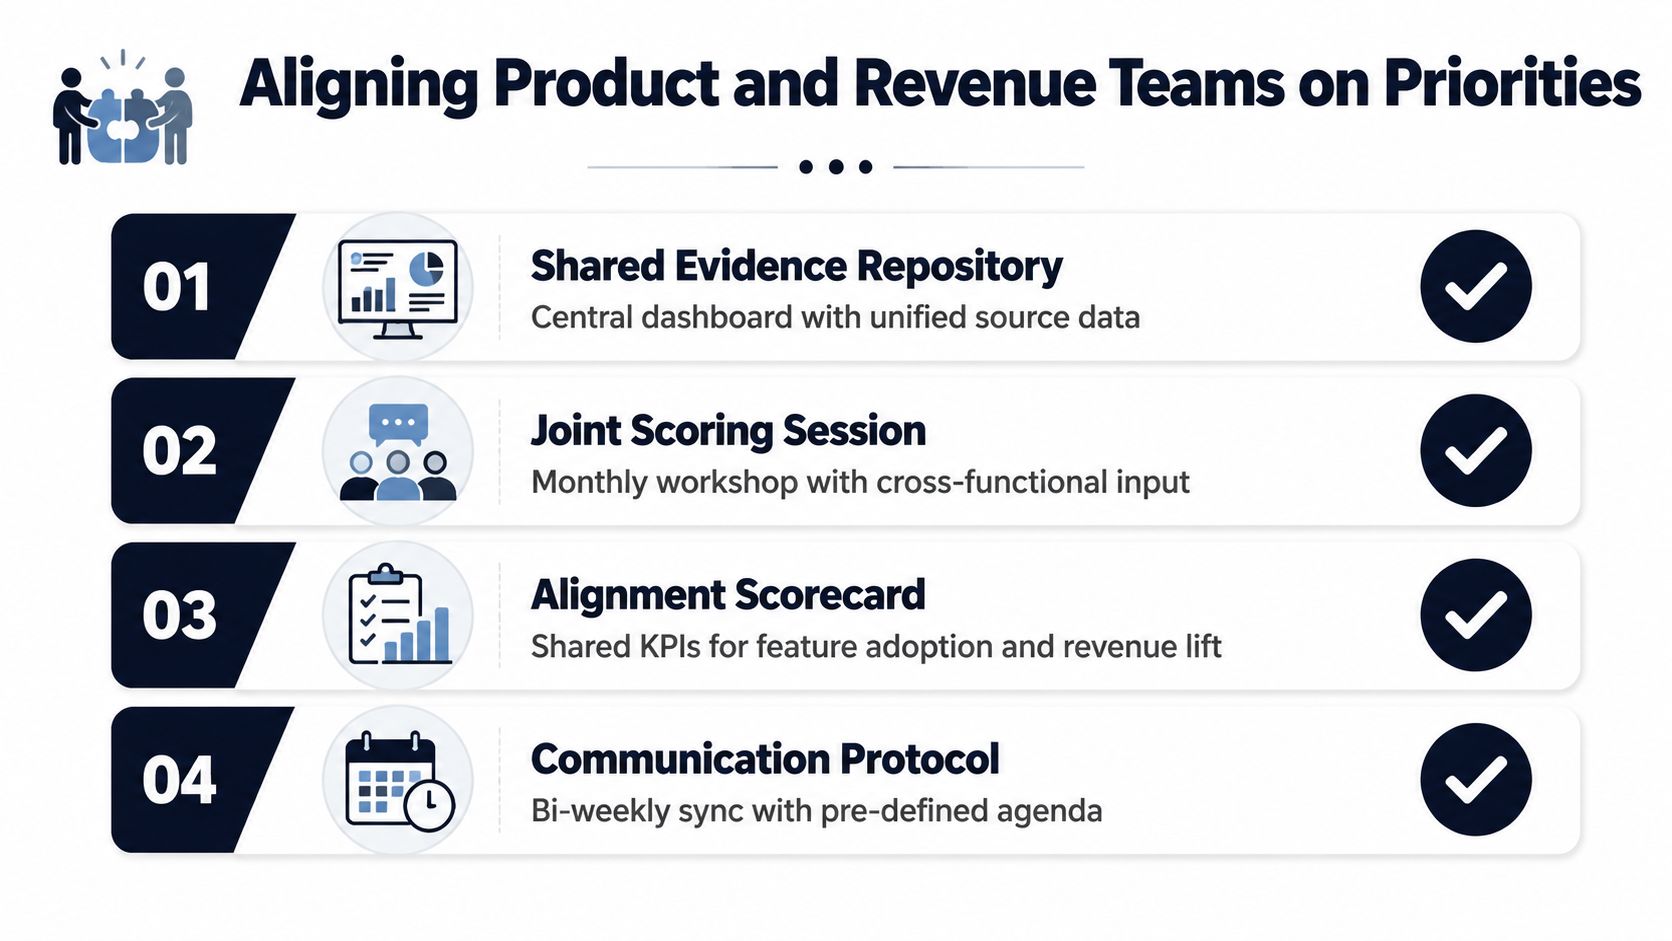
Run the review around evidence
Before the meeting, product publishes the evidence and identifies the assumptions behind each estimate. Participants challenge those assumptions, add missing account context, and separate observed behavior from forecasts.
A common conflict is a sales team pushing a demo-only feature for a visible prospect while customer success reports that several existing accounts may not renew because a core workflow remains unreliable. The demo request may have high visibility and low evidence of recurring value. The renewal issue may involve fewer voices but clearer usage, support, and dollar-value signals. The rubric should make that difference explicit.
Assign each function a defined responsibility:
- Sales: Document active deal blockers, opportunity value, and whether the request appears across target accounts.
- Customer success: Provide renewal exposure, adoption barriers, and account patterns.
- Support: Show incident frequency, workaround burden, and repeated workflow failures.
- Engineering: Estimate complexity, dependencies, reliability risk, and possible mitigations.
- Product: Compare the evidence, resolve trade-offs, and own the final sequence.
Use a conflict rubric
When initiatives compete, compare them in this order:
- Customer consequence: Which problem causes the greater loss of value?
- Commercial exposure: Which has stronger evidence of churn prevention, expansion, direct revenue, or cost avoidance?
- Evidence confidence: Which case rests on observed behavior rather than assumption?
- Strategic fit: Which supports the current product direction without treating strategy as a vague override?
- Execution path: Can the higher-risk item be tested or mitigated before full delivery?
If scores are close, avoid false precision. Choose the option that creates more learning, reduces irreversible risk, or supports a smaller commitment. Record the decision, the rejected alternative, and the assumption that separated them. That record prevents the same argument from restarting at the next planning meeting.
Stakeholder discussion should refine the evidence and definitions, not replace the scoring. Product can then explain why request popularity lost to measurable revenue exposure or churn risk.
Common Prioritization Mistakes and How to Avoid Them
Roadmap prioritization breaks in predictable ways. Teams collect evidence but don't normalize it, create scores but don't define them, and invite stakeholders into a ranking exercise before agreeing on what value means. The result is roadmap churn disguised as collaboration.
Use this checklist before committing an initiative:
- Don't equate volume with value: Record request frequency, then weight it by customer segment, behavior, revenue exposure, and confidence.
- Don't mix opinions with scoring output: Capture stakeholder context separately from the score so an executive preference doesn't override comparable evidence.
- Don't promote one vocal account without testing the pattern: Confirm whether the problem affects a broader segment, blocks a documented opportunity, or creates measurable renewal risk.
- Don't build a complex model on weak inputs: Start with a simple framework and add criteria only when better data or harder decisions justify them.
- Don't treat the roadmap as static: Define review triggers for changing usage, sentiment, support escalation, churn exposure, and expansion opportunities.
- Don't skip the retrospective: Compare predicted impact with observed adoption, retention behavior, support demand, or commercial outcomes.
Measure the process, not only the features
A prioritization system is working when decisions become easier to explain and execution becomes more stable. Track whether stakeholders reach alignment faster, whether roadmap changes have documented evidence, whether teams revisit stale assumptions, and whether shipped initiatives show a clearer relationship to the outcomes they were expected to influence.
No framework eliminates uncertainty. RICE, ICE, MoSCoW, value-versus-effort, and MaxDiff all organize judgment in different ways. The right system makes uncertainty visible, protects the team from popularity bias, and creates a repeatable path from customer evidence to commercial action.
As data quality improves, increase sophistication carefully. Add behavioral weighting, segment-level revenue context, and preference research when those inputs will change a decision. If the model becomes harder to maintain than the roadmap itself, simplify it and return to the evidence.
SigOS helps product and revenue teams consolidate support tickets, sales conversations, customer sentiment, and usage signals into revenue-oriented prioritization decisions. It can surface patterns associated with churn and expansion, assign revenue-impact context to issues, and connect prioritized findings with delivery tools. Visit SigOS to evaluate whether its product-intelligence workflow fits your roadmap process.
Keep Reading
More insights from our blog



Ready to find your hidden revenue leaks?
Start analyzing your customer feedback and discover insights that drive revenue.
Start Free Trial →