Incident Analysis Methods, Workflows, and Metrics
Learn incident analysis methods, workflows, metrics, tools, and real-world examples for connecting product incidents to churn and revenue impact.
At 10:14 a.m. on a peak traffic day, checkout fails. Engineers start rolling back the latest release while support receives refund requests, customer success managers add urgent notes to strategic accounts, and finance watches the day's forecast change in real time. The technical team may restore service quickly, but customers still have questions, sales conversations may pause, and executives need to know whether the failure was isolated or likely to return.
That's the practical challenge of incident analysis. An incident isn't only a broken service or security event. It's also a customer experience disruption, a trust question, an operating-cost signal, and a variable in revenue planning. A useful analysis connects those views, then turns verified evidence into engineering, product, support, and commercial decisions.
When an Incident Becomes a Business Problem
The checkout outage looks different from each team's position. Engineering sees errors, a failed dependency, and a rollback decision. Support sees customers who can't complete a purchase and wants a clear explanation. Customer success sees account risk, while product leaders ask whether the checkout flow has a design weakness that makes recovery harder than it should be.
Treating the event as a ticket creates a narrow definition of success: service is available again, the incident is closed, and the report is stored. That approach misses the evidence arriving outside the incident channel. Refund requests can reveal which workflows failed. Account notes can show whether high-value customers experienced the issue differently. Product usage data can show abandoned sessions, repeated retries, or a feature that customers stopped using after recovery.
Practical rule: An incident is operationally over when the service is restored. It's analytically over only when the organization understands the customer impact and has assigned prevention work.
The first 24 to 48 hours deserve deliberate attention, not because every consequence appears immediately, but because teams make important decisions while uncertainty is still high. Customers decide whether to retry, contact support, pause an expansion conversation, or evaluate alternatives. Account teams decide who needs outreach. Executives decide whether the event deserves a broader reliability investment. Those decisions can shape the eventual business outcome before a root-cause document is complete.
Historical practice supports this move toward structured analysis. ISO/IEC TR 18044 was first issued on October 15, 2004, formalizing guidance for detecting, reporting, and assessing security incidents across organizations and countries (ISO's record for ISO/IEC TR 18044). The broader incident-management framework also moved toward codified, multi-agency practice through Homeland Security Presidential Directive-5 in February 2003 and NIMS in March 2004, as documented in the same historical reference.
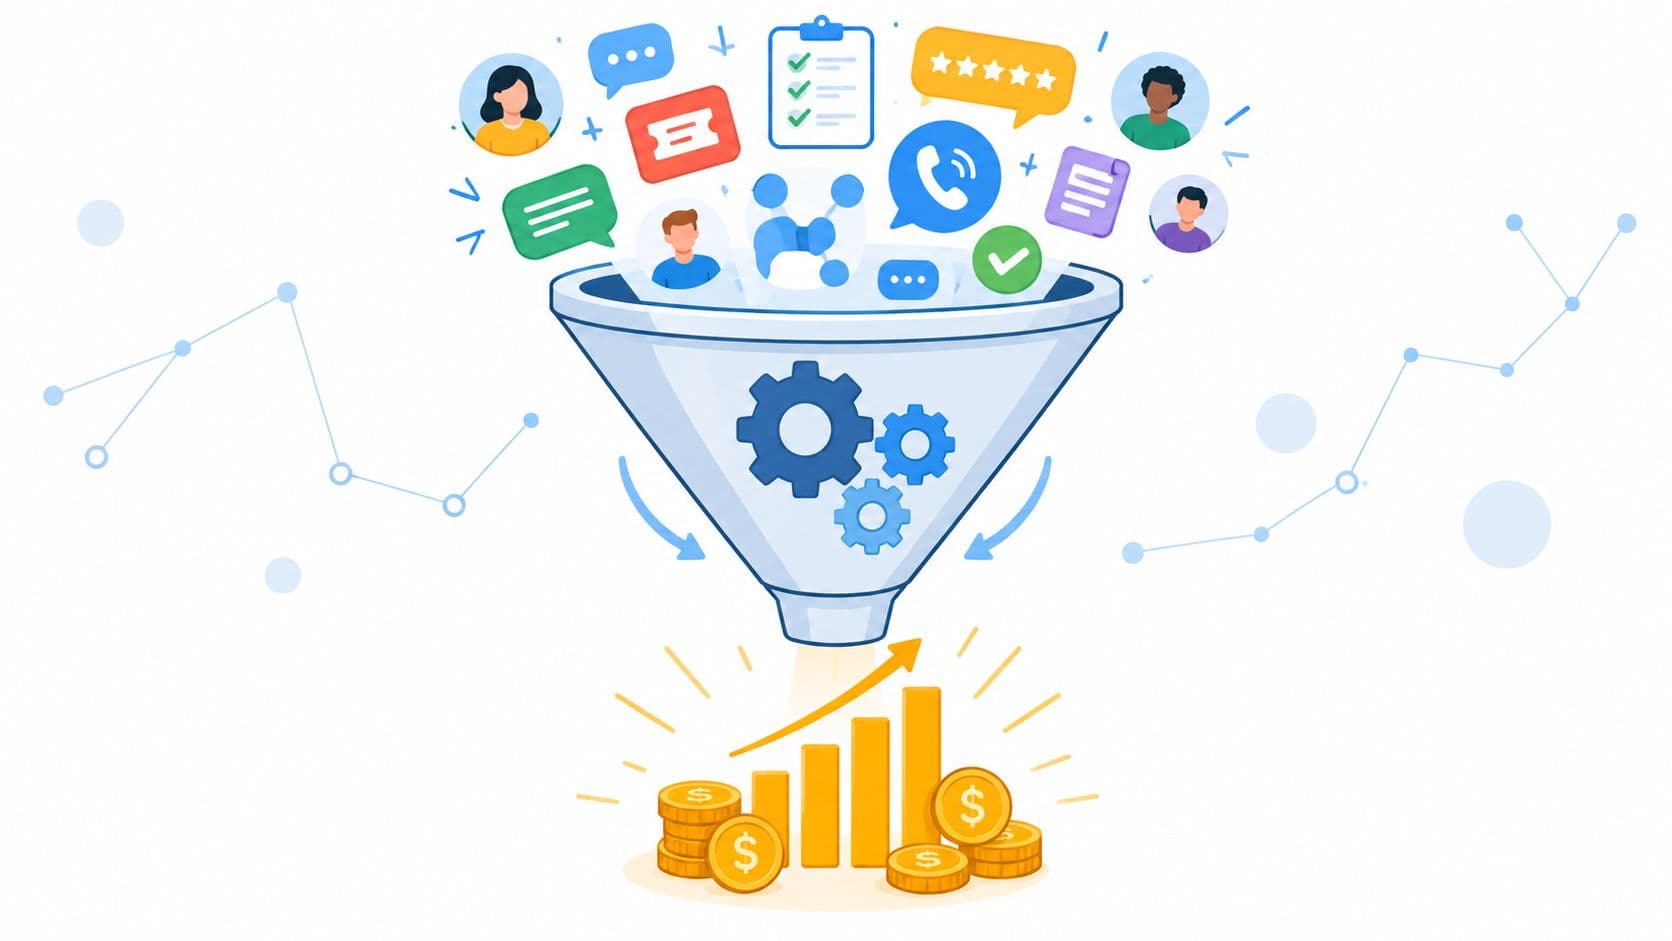
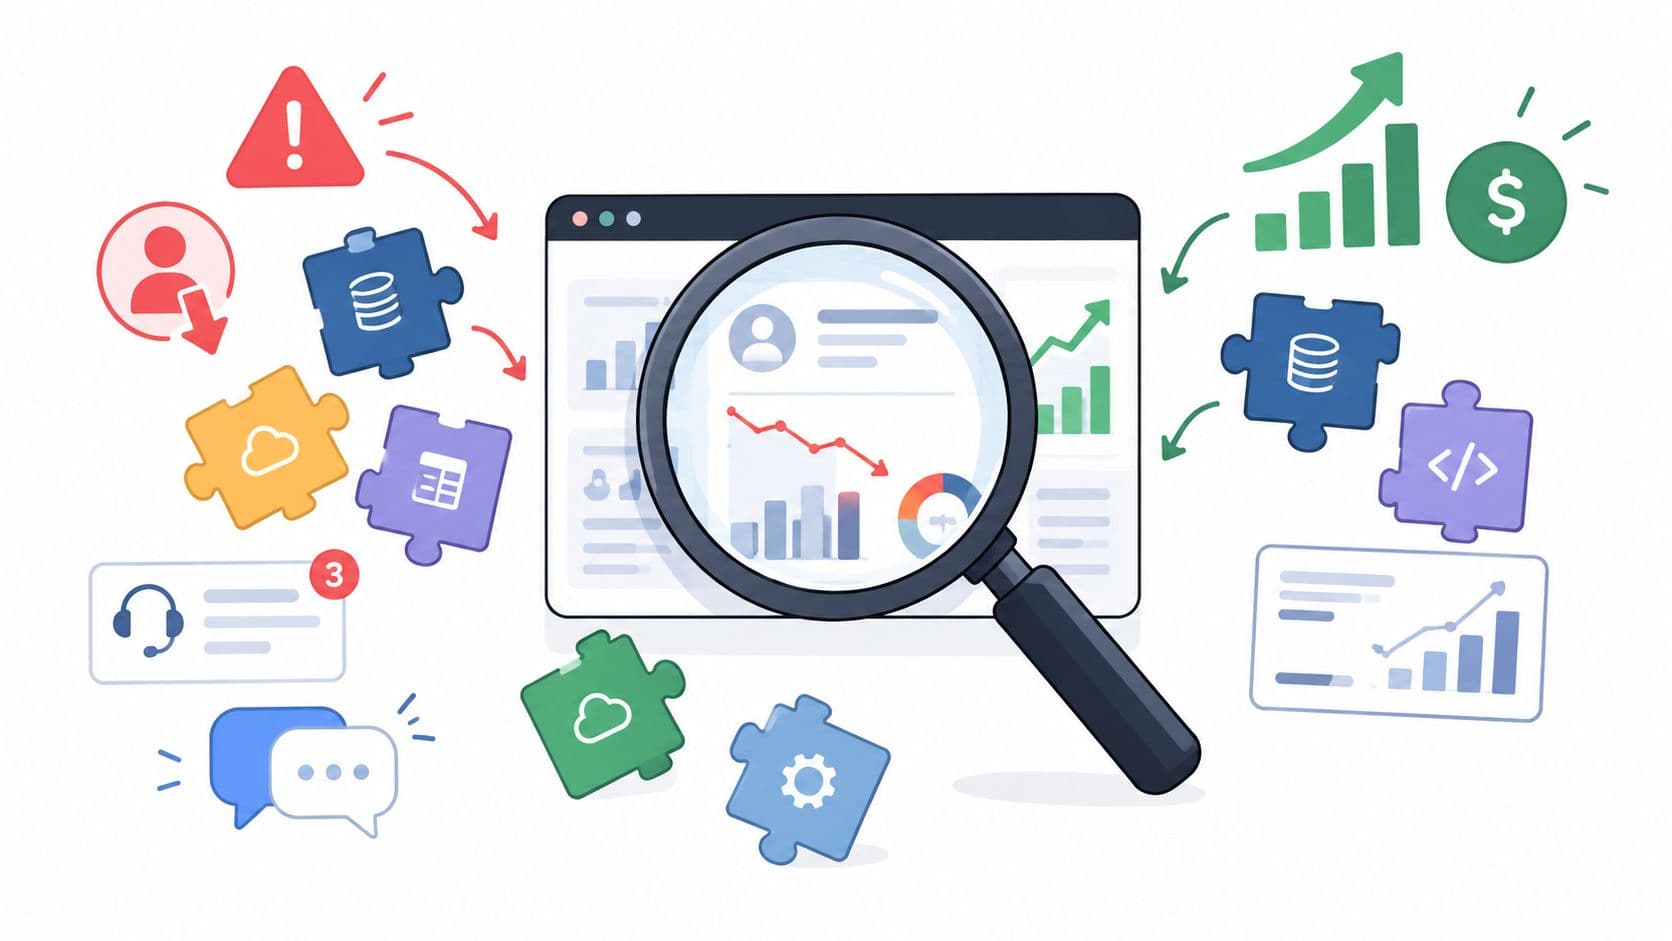
The product operations perspective is simple: incident analysis is the connective tissue between a technical timeline and a revenue conversation. It should tell the organization what failed, who experienced it, why detection or recovery worked the way it did, and which investment will reduce future customer harm.
Understanding Incident Analysis as a Learning System
A postmortem is a document. Incident analysis is a control loop. It senses a problem, tests explanations, records what the organization learned, and changes the system so the next signal becomes clearer or the impact becomes smaller.
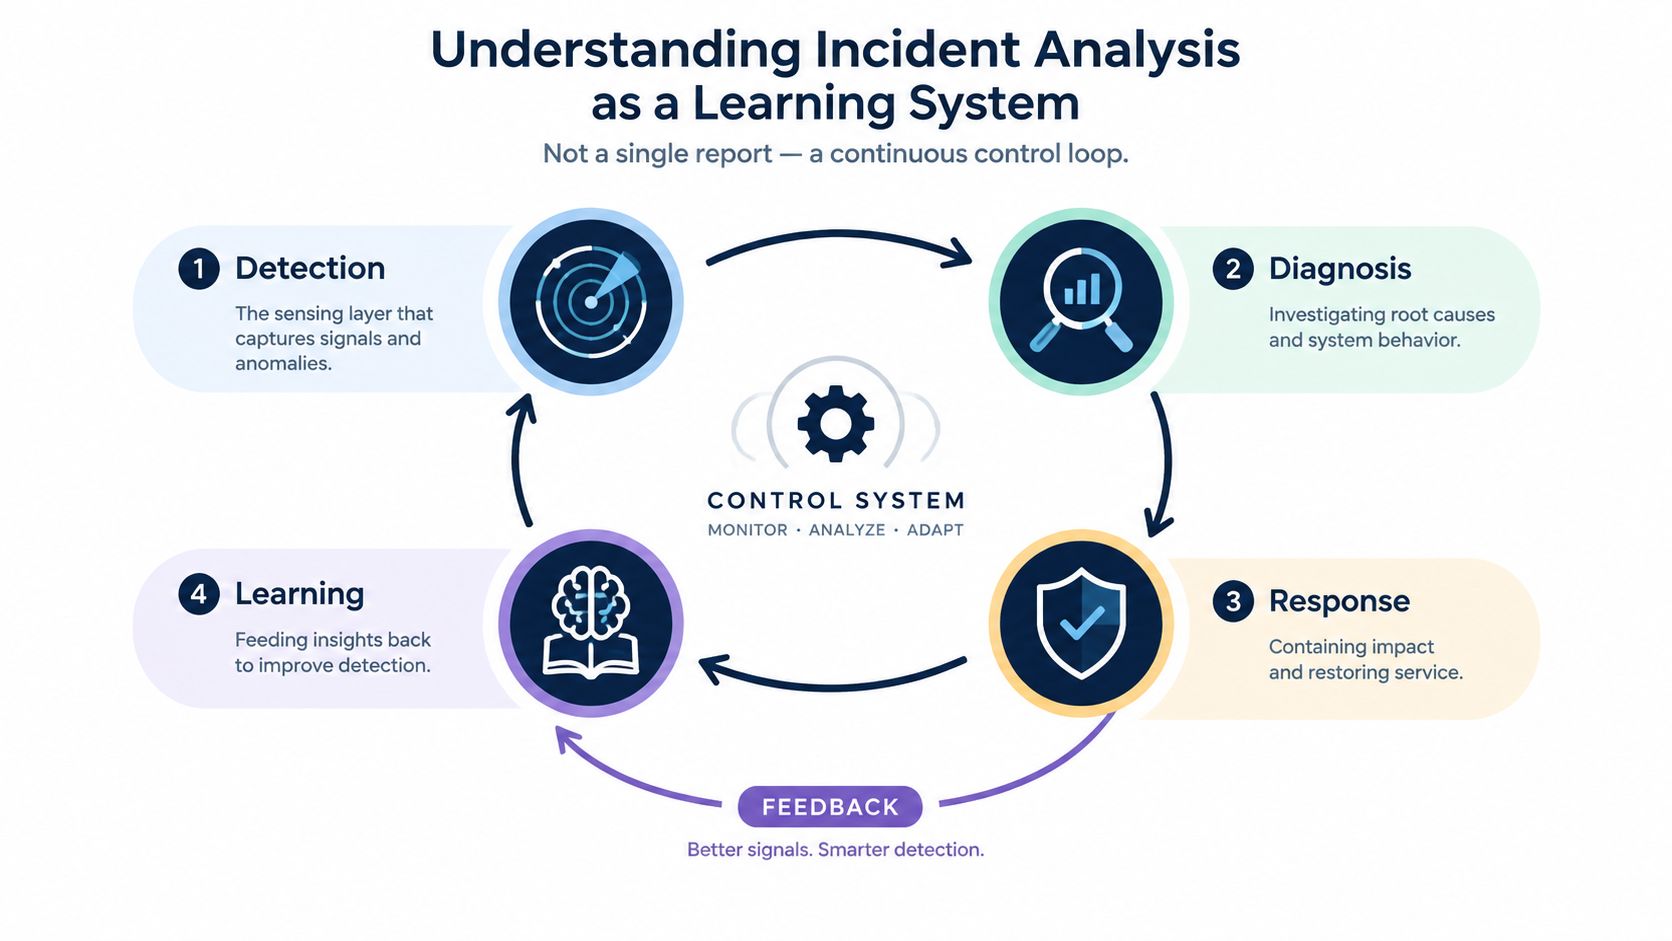
Detection is the sensing layer
Detection combines monitoring alerts with evidence that technical systems may not capture cleanly. Application performance monitoring, logs, traces, support tickets, chat messages, session behavior, and usage telemetry each provide a different view of the same event. A customer complaint may arrive before a threshold alert, especially when the failure affects a workflow without producing a dramatic infrastructure symptom.
The failure mode here is false confidence. A team may believe it has good detection because dashboards are full of data, while missing incidents in backups, secondary environments, or workflows that generate weak alerts. A Kaspersky compromise assessment found that 52% of high-severity compromises were discovered only after 90 days, the oldest incident remained undetected for up to four years, 60% were missed because existing tools didn't generate high-confidence alerts, and 40% of discovered web shells were in backups (Kaspersky's compromise assessment findings). The lesson applies beyond security: analysis must ask what remained invisible before the alert fired.
Diagnosis tests the story
Diagnosis reconstructs system behavior and pressure-tests competing explanations. Analysts should distinguish correlation from causation, preserve the original evidence, and record which hypotheses were rejected. If the first narrative says “the deployment caused the outage,” the investigation still needs to test dependency health, configuration changes, capacity, network behavior, and customer segmentation.
Learning turns verified findings into organizational memory through incident tags, searchable reports, runbooks, and pattern libraries. Prevention then feeds that memory into product safeguards, alert design, rollout policy, architecture, and customer communication. If a team records “database issue” but doesn't change a control, the loop stops at description.
The loop closes when prevention improves detection. A new alert may detect a known failure earlier. A product fallback may reduce customer impact. A support classification rule may identify a recurring symptom before engineering sees a dashboard change. The organization gets better not by writing longer reports, but by making each verified finding change how it senses and handles the next event.
Comparing the Main Incident Analysis Methods
No single method answers every incident question. Root cause analysis explains causal structure, timeline and ticket clustering reconstructs sequence and scope, while behavioral pattern analysis connects technical failures to what users did.
| Method | Primary Evidence | Strengths | Limits | Best Fit |
|---|---|---|---|---|
| Root cause analysis | System behavior, configuration changes, dependency relationships, and fault paths | Explains why a failure occurred and supports targeted controls | Can anchor too early on a single cause or ignore customer behavior | A technically bounded failure with a clear causal chain |
| Timeline and ticket clustering | Logs, traces, deployment records, incident messages, support tickets, and correlated timestamps | Reconstructs sequence, scope, and affected workflows across teams | Correlation can be mistaken for causation without validation | Complex incidents with multiple symptoms or delayed discovery |
| Behavioral pattern analysis | Product usage, session activity, support themes, account context, and cohort behavior | Surfaces recurring user-visible failure modes and commercial exposure | May reveal a pattern without identifying the underlying technical mechanism | Repeated incidents, ambiguous alerts, and prioritization decisions |
Classic root cause analysis often starts with the 5 Whys, then expands into fault tree reasoning when multiple contributing paths exist. Its strength is discipline. The analyst keeps asking what enabled the failure instead of stopping at the visible trigger. The weakness is that “root cause” can become a misleading singular label for a system with several conditions, such as a risky change, insufficient validation, weak rollback, and an unmonitored dependency. Teams looking for a deeper treatment of causal investigation can use this 2026 root cause analysis guide as a reference.
Timeline reconstruction works best when the incident is distributed across services or teams. It aligns deployment IDs, traces, alert timestamps, ticket creation, customer reports, and remediation actions. This method often reveals that the first alert wasn't the beginning of customer impact, or that recovery introduced a second failure. It's excellent for sequence, but it needs causal testing before the team declares an explanation proven.
Behavioral pattern analysis starts from the customer surface. It groups complaints, failed workflows, affected accounts, session paths, feature usage, and renewal context. The method can reveal that a technically minor defect affects an important activation step, while a larger infrastructure event has limited exposure for most users. Its risk is over-reading a pattern without confirming the system mechanism.
Use the methods together when stakes are high. Cluster the evidence to establish sequence and scope, apply causal reasoning to test the mechanism, then use behavioral analysis to decide which prevention work matters most.
Running an Evidence-First Analysis Workflow
An evidence-first workflow starts with the customer and product surface, before the first technical explanation appears in an incident channel. That sequence gives support, product, and engineering the same starting point, while reducing confirmation bias. It also turns incident analysis into a feedback loop: customer evidence shapes the investigation, and validated findings become engineering and product decisions tied to measurable business outcomes.
1. Triage the intake
Record a stable incident identifier, affected feature, suspected start time, customer-visible symptom, reporter, and current status. Prioritize customer harm and business exposure alongside alert severity. A failed internal dashboard and an unavailable payment workflow may generate similar error counts, yet demand very different responses.
Preserve the original report. Put interpretation in separate fields so later reviewers can distinguish observed evidence from assumptions.
2. Reconstruct one timeline
Build a minute-by-minute timeline from logs, traces, monitoring events, deployment records, feature-flag changes, support tickets, chat messages, and product telemetry. Preserve relevant logs, traces, metrics, deployment IDs, and configuration snapshots before analysis begins. Causal attribution depends on ordering events across services and testing hypotheses against durable telemetry, as described in this root-cause analysis workflow.
Include more than the outage window. Record the first customer symptom, first internal signal, escalation points, mitigation attempts, rollback, recovery, delayed effects, and closure of downstream work. Cluster related timelines and tickets here, so scattered records become a sequence that analysts can test.
3. Correlate customer and product evidence
Group support reports by symptom, feature, account type, workflow, and time. Compare those groups with usage behavior, failed requests, session exits, refunds, account notes, and feature adoption. Teams that need a practical method for structuring customer evidence can consult SigOS's customer feedback analysis guide.
Examine whether the incident affected self-serve customers, enterprise accounts, new users, or heavy users differently. Support volume is not a direct count of affected users. Some customers never report a failure, while others submit several tickets for one event.
4. Test the causal hypothesis
Write several plausible explanations before selecting one. Test them through controlled rollback, feature-flag comparison, dependency isolation, replay, or comparison with unaffected cohorts. Root cause analysis belongs after the evidence establishes scope and sequence.
For each hypothesis, record what would disprove it. If rolling back a deployment leaves a dependent workflow broken, the deployment may be a trigger rather than the complete cause. Prevention may therefore require changes to dependency contracts, fallback behavior, or detection, not only the release process.
5. Convert findings into prevention work
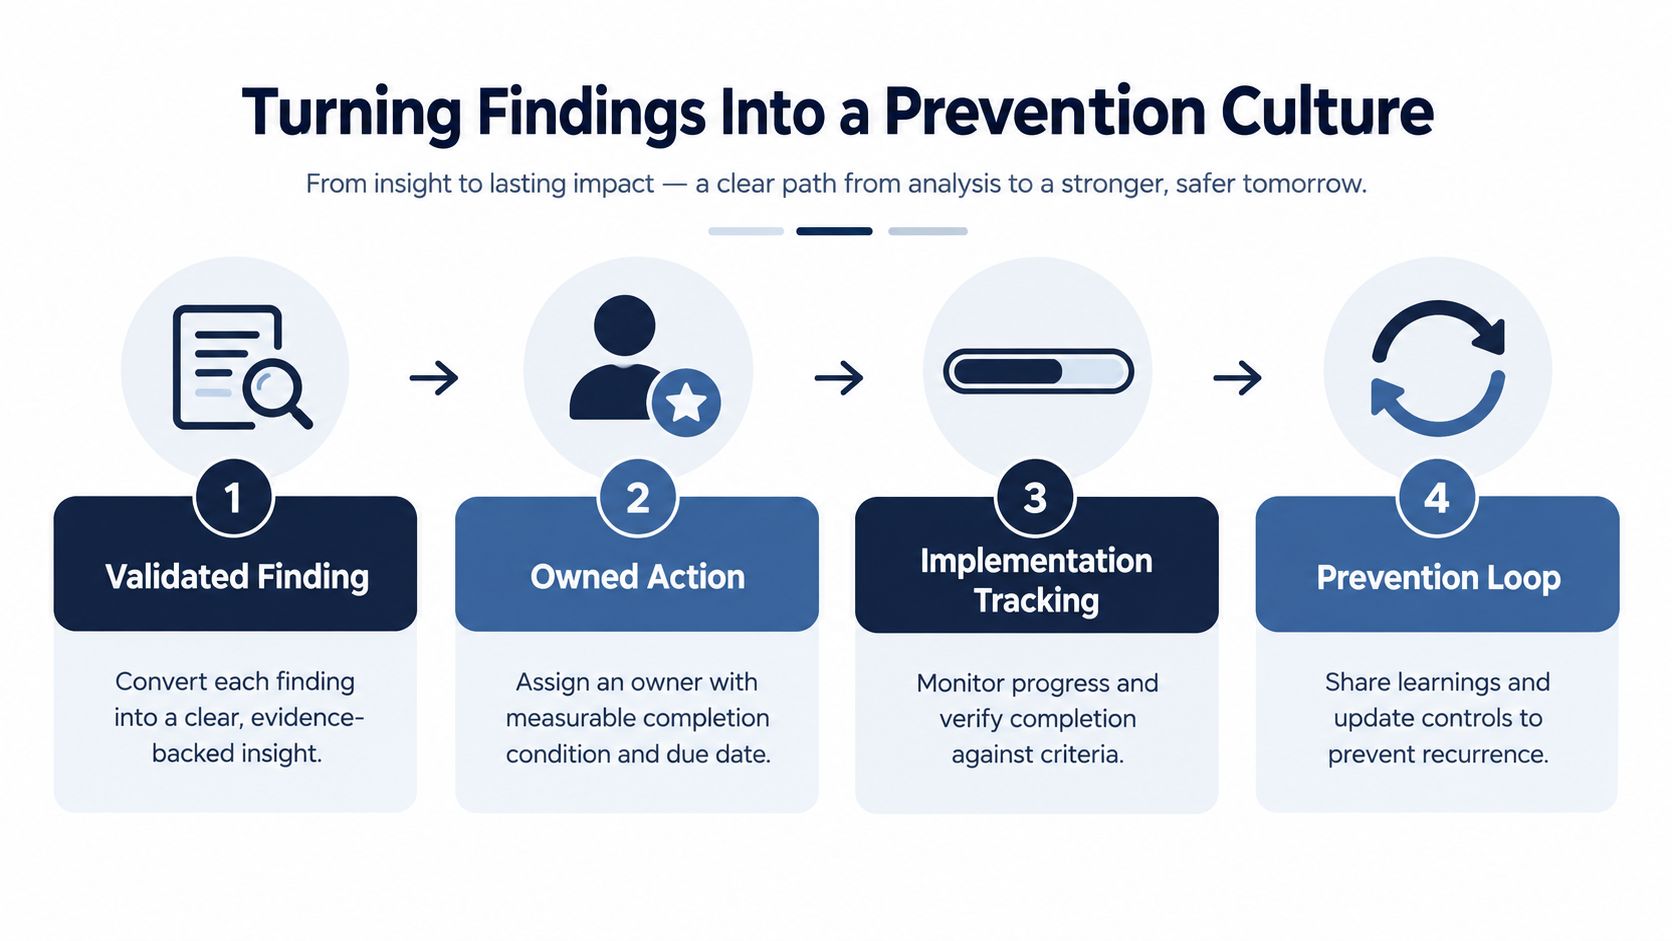
Every validated finding needs an owner, due date, completion condition, and expected effect. Possible actions include a code change, alert improvement, runbook update, product fallback, support macro, customer outreach, vendor control, or architectural change. Track these actions in the engineering and product planning system, not only in the incident report.
Before closing the analysis, verify:
- Evidence quality: Are timestamps aligned, sources preserved, and assumptions labeled?
- Scope: Which customers, workflows, features, and dependencies were affected?
- Causality: Did the team test alternatives instead of accepting the first narrative?
- Ownership: Does every action have one accountable owner and a verification condition?
- Follow-through: Will someone review completion and recurrence after the work ships?
Connect each prevention item to the outcome it should improve, such as fewer failed workflows, lower support demand, or reduced renewal risk. A completed report without completed prevention work is an archived explanation, not an operating control.
Tracking Signals That Guide Better Decisions
A dashboard can display incident metrics without changing what the team does. Each signal needs an owner, a decision rule, and a business question it helps answer.
Operational signals show how the system detected, contained, and recovered from failure. Business signals show what customers and commercial teams experienced. The useful feedback loop connects both, then carries the result into engineering and product planning.
| Signal Category | Example Metrics | Typical Source | Decision Trigger |
|---|---|---|---|
| Operational | Time to detect, time to mitigate, repeat-incident rate, postmortem completion, action-item completion, and on-call load | Monitoring, incident platform, engineering work tracker | Escalate detection gaps, reduce recovery friction, or fund reliability work |
| Business | Support volume by cohort, feature adoption change, NPS movement among affected users, expansion pipeline delays, churn-risk flags, refunds, and account notes | Support, CRM, product analytics, billing, and customer success systems | Prioritize outreach, adjust roadmap sequencing, or protect renewal and expansion work |
Reference targets can help teams set an initial baseline: faster detection and mitigation, fewer repeat incidents, and reliable completion of prevention work. They are working thresholds, not universal laws. A low detection time has little value if alerts lack confidence, while rapid mitigation can conceal a recurring product weakness.
A useful metric has an owner and a response rule. If repeat incidents cross the agreed threshold, reliability work enters prioritization. If affected enterprise accounts show renewal risk, customer success receives an evidence pack. If support volume rises among new users, product examines activation instead of treating the event as a general availability problem.
Signal detection should combine machine data with human reports. The guide to signal detection helps teams distinguish meaningful patterns from noise. Review leading indicators during and immediately after the incident, then use lagging indicators to assess retention, expansion, cost, and trust effects later.
Record the outcome of every decision. That closes the loop between incident evidence, prevention work, and product intelligence. Without it, the dashboard remains observation rather than management.
Connecting Incidents to Churn and Revenue
The same failure can produce different commercial outcomes because customers use products differently. Incident analysis should therefore connect frequency, severity, recovery time, workflow criticality, and customer segment rather than applying one impact label to everyone.
Consider a SaaS billing outage that primarily affects self-serve monthly subscribers. Some users may retry later, while others may interpret the failed payment experience as a trust problem and contact support. The response may require clearer status communication, refund handling, and a product fix in the payment path. The incident becomes more urgent when support evidence shows repeated failures during a customer's first purchase or renewal.
A B2B latency regression creates another pattern. An enterprise customer may still complete a request, but delayed responses can disrupt internal operations, weaken confidence before renewal, or prompt an account team to pause expansion discussions. The technical severity might look moderate, yet the affected workflow may sit inside a contractually important process.
A mobile crash cluster during a growth experiment can suppress activation without generating many support tickets. New users may abandon the app before they learn its value, so product analytics and session evidence become more informative than ticket count. The correct action could be to pause the experiment, restore a stable path, and investigate the release sequence.
Revenue impact isn't an appendix to incident analysis. It's part of deciding which prevention work deserves scarce engineering capacity.
The commercial link should be explicit. Map affected sessions or accounts to retention signals, expansion readiness, support effort, refunds, and renewal milestones. Then distinguish direct loss from delayed opportunity and increased service cost. A bug that generates low support volume but blocks a high-value workflow may outrank a noisy defect with little commercial exposure.
Teams can use a structured revenue impact analysis framework to connect customer evidence with prioritization. The output shouldn't be a dramatic estimate built on weak assumptions. It should be an evidence-backed decision record: which customers were affected, what behavior changed, what risk is emerging, which action protects the most important outcome, and when the team will reassess.
Designing Tooling and Integration Architecture
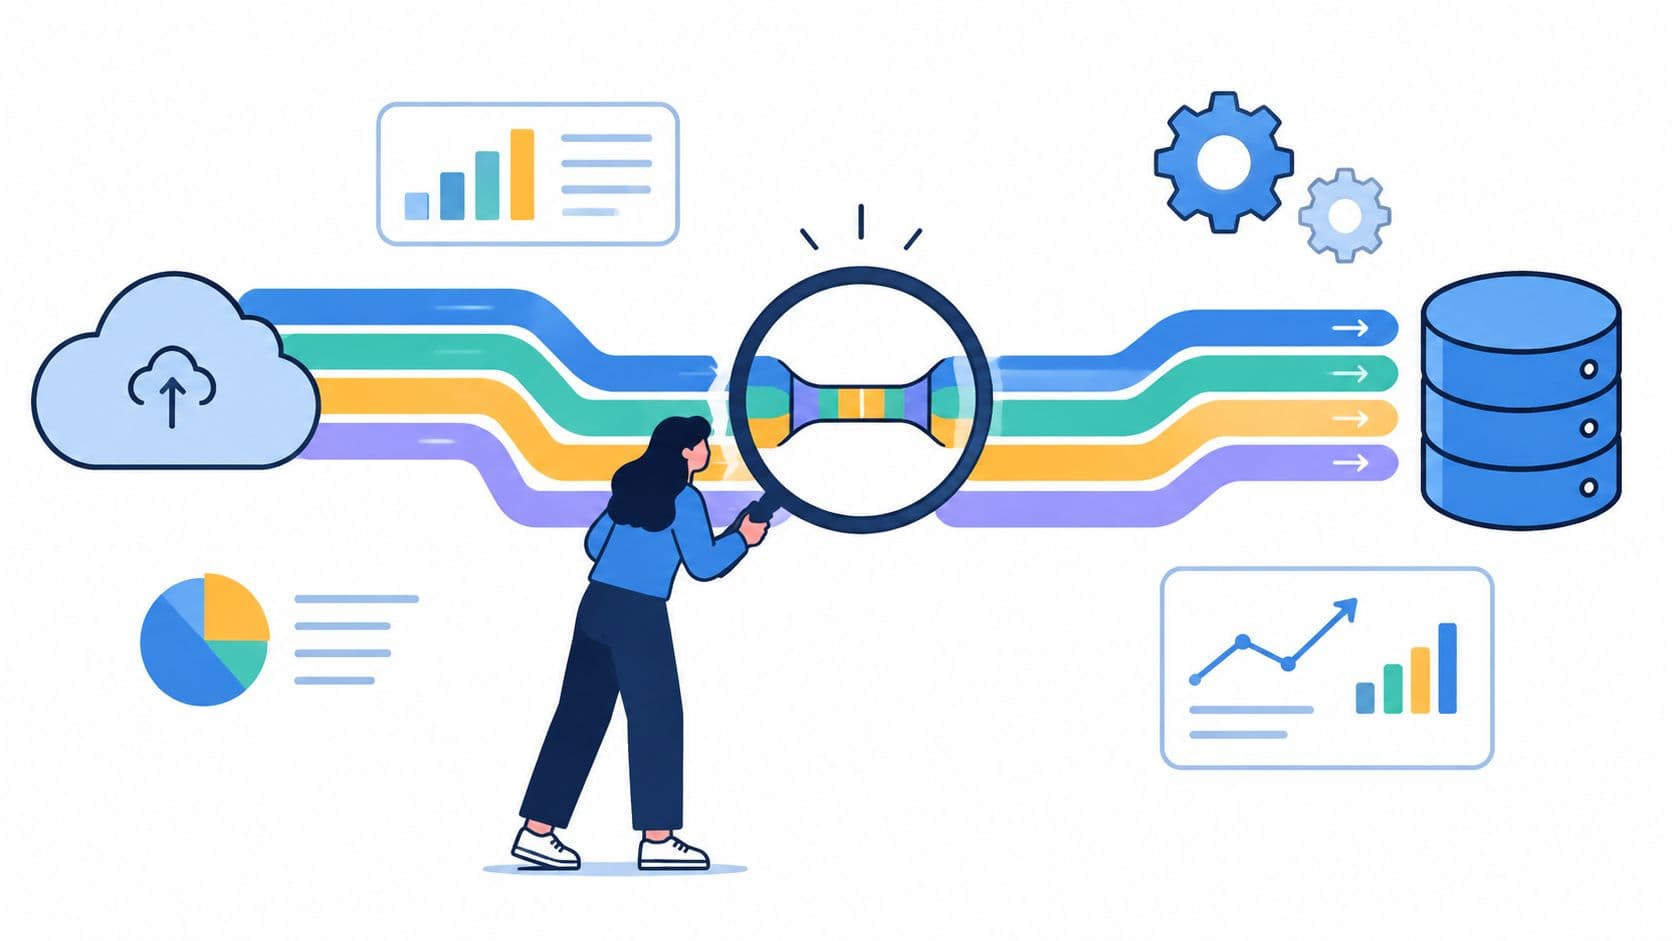
Incident evidence usually sits in three layers: operational telemetry, customer interactions, and business outcomes. The architecture should connect them with reliable identifiers instead of collecting every possible source without a trustworthy join.
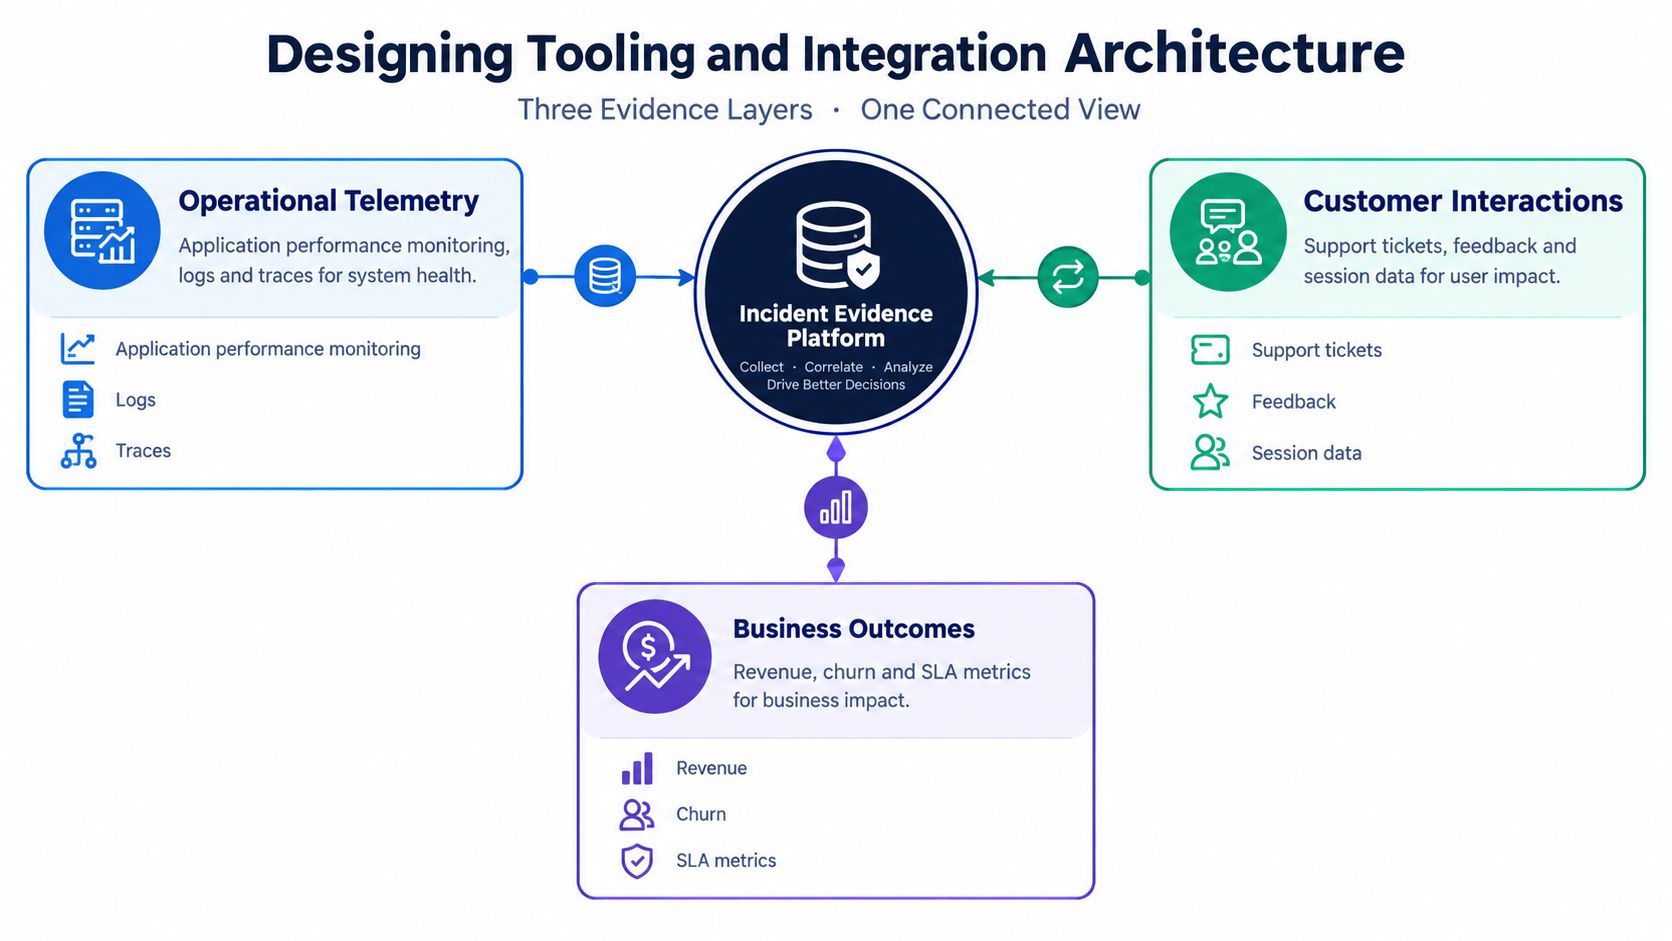
Operational systems provide application performance data, logs, traces, feature-flag states, deployment records, affected components, and remediation history. Customer systems add support tickets, call transcripts, account notes, severity, and user-described symptoms. Product analytics and billing systems connect incident windows to failed workflows, retention behavior, expansion activity, refunds, and revenue outcomes.
Use batch ingestion for historical analysis and event-driven ingestion for urgent signals. Standardize customer, account, incident, feature, and session identifiers before correlation begins. A broad integration that can't reliably match an account to an incident is less useful than a smaller integration with explainable joins.
Automation should handle repetitive work such as deduplication, clustering, timestamp alignment, and alert enrichment. Keep human review for high-impact reports, ambiguous causal patterns, and sensitive customer evidence. A product intelligence platform such as SigOS can correlate support feedback, product usage, and behavioral patterns to surface recurring issues and route them into issue workflows.
Data governance belongs in the design, not in a later cleanup project. Apply role-based access, masking, retention limits, and audit logs to customer and commercial data. Also account for timing differences. Monitoring may arrive immediately, while CRM and billing records can lag or change after the incident.
Before trusting an automated workflow, validate:
- Completeness: Did every expected source contribute data?
- Deduplication: Are repeated tickets or retries being counted once or many times?
- Time handling: Are time zones, delayed events, and status changes normalized?
- Definitions: Did an upstream team change the meaning of a feature, event, or severity field?
- Explainability: Can an analyst trace a conclusion back to the source records?
Reliable, reviewable evidence beats an impressive but opaque incident graph.
Turning Findings Into a Prevention Culture
The analysis report should start the prevention system, not end the investigation. Convert each validated finding into an owned action with a measurable completion condition, due date, and expected effect on recurrence or customer impact.
Classify the work so accountability doesn't default to engineering:
- Technical fixes: Change code, dependencies, capacity, or failure isolation.
- Detection improvements: Add coverage for weak signals, secondary environments, and known blind spots.
- Product changes: Improve fallback behavior, user messaging, retries, or workflow design.
- Runbook updates: Make escalation and mitigation steps easier to execute under pressure.
- Support enablement: Give frontline teams accurate guidance, account context, and recovery options.
Review incidents by risk and pattern, not only by severity or volume. Repeated low-severity failures can justify more investment than one isolated high-severity event if they affect a critical workflow or consume support capacity every week.
A lightweight cadence works well: immediate review for significant events, a monthly cross-functional pattern review, and quarterly prioritization of systemic risks. Share concise customer-impact evidence with product, support, success, security, and engineering leaders, while restricting sensitive details to the people who need them.
The organization should recognize teams for detecting weak signals and strengthening controls, not for producing more incident reports. Over time, the desired outcome is a shared prevention backlog that links technical findings to customer behavior and business priorities.
Start with the next significant incident. Preserve the evidence, add customer and business context, validate the causal story, and create prevention work that someone can verify. That's how incident analysis becomes product intelligence instead of a one-time postmortem ritual.
SigOS helps teams connect support feedback, product usage, and behavioral patterns so recurring incident themes can be tied to churn, expansion, and revenue impact. Visit SigOS to see how your team can turn customer evidence into prioritized product and engineering action.
Keep Reading
More insights from our blog
Ready to find your hidden revenue leaks?
Start analyzing your customer feedback and discover insights that drive revenue.
Start Free Trial →