Bottleneck Identification Framework for SaaS Teams
Master bottleneck identification in your product and processes with a step-by-step, revenue-focused framework tailored for SaaS teams.
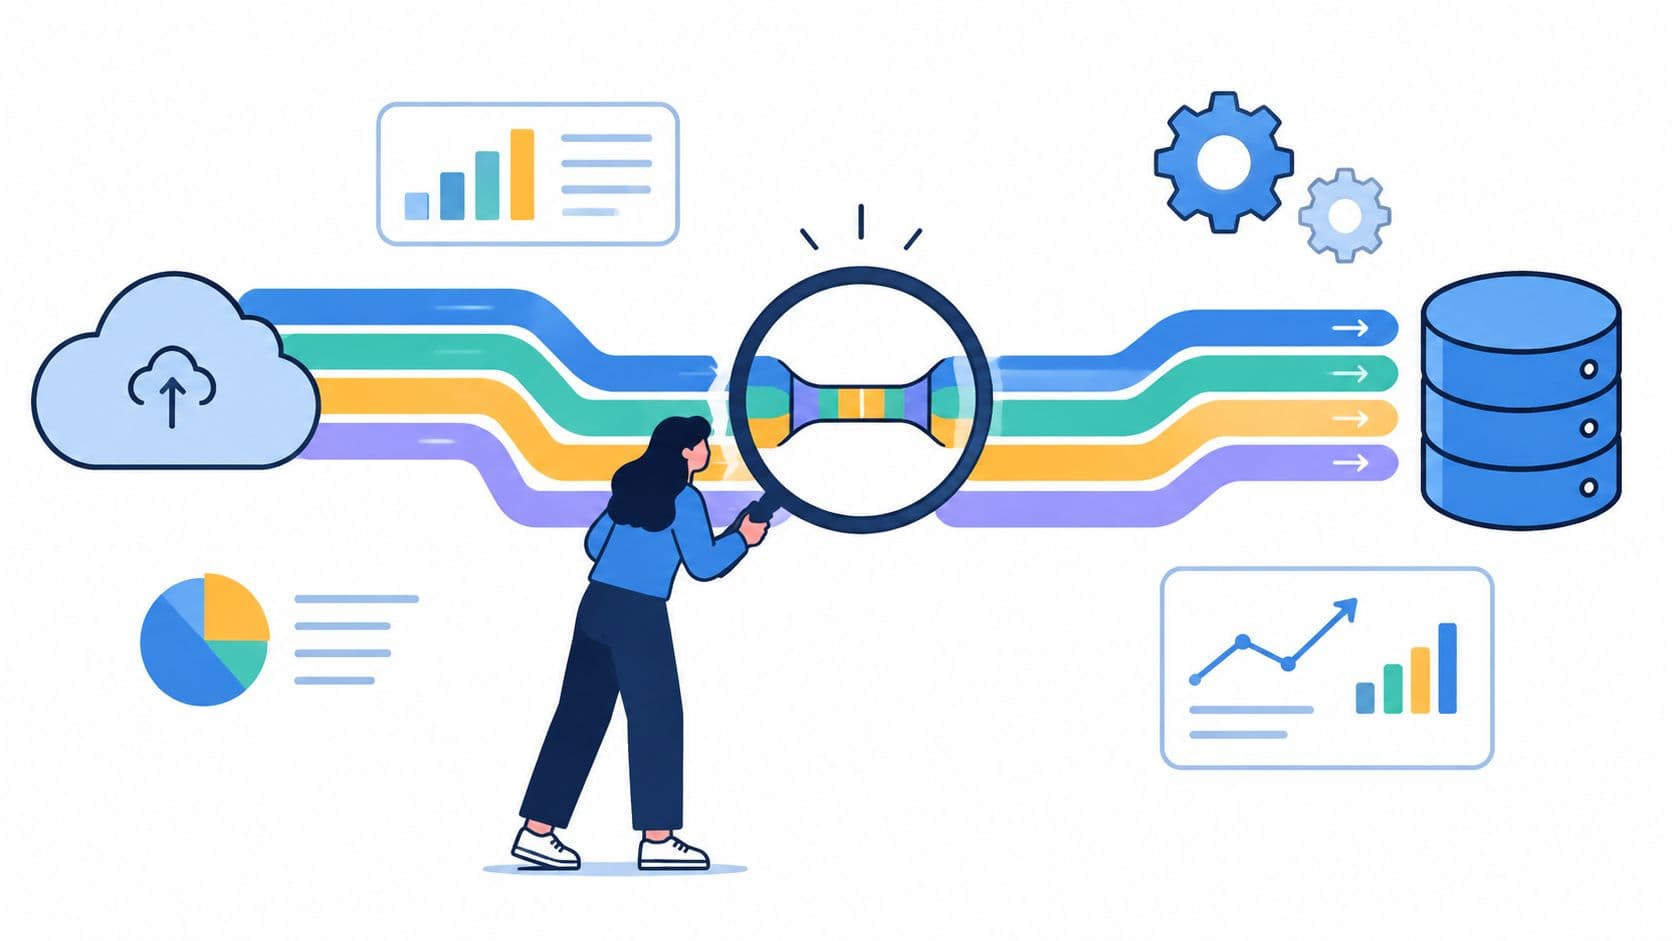
Your roadmap is full, sprint commitments are growing, and customers still report that the product feels slow to improve. Support keeps forwarding the same complaints, sales keeps asking for the same missing capability, and engineers appear busy without moving the outcomes that matter. The problem may not be a lack of effort. It may be a bottleneck hidden somewhere between customer demand, product decisions, engineering capacity, and revenue realization.
Bottleneck identification gives SaaS teams a disciplined way to find the limiting point, test whether it is restricting throughput, and prioritize action based on business consequences. The useful question isn't which team looks busiest. It's which constraint prevents the system from delivering more value, and what evidence would prove it.
Understanding Bottleneck Identification
A bottleneck is the part of a workflow that limits the system around it. In SaaS, it might be a slow review stage, an overloaded support queue, an unreliable integration, a product decision that requires one unavailable specialist, or an onboarding step that prevents users from reaching activation. The visible symptom often appears downstream, while the limiting condition sits elsewhere.
That distinction matters because optimizing non-constraints can create more work without increasing throughput. Adding features to an already crowded backlog doesn't help if discovery is producing unclear requirements. Recruiting more implementation staff won't solve an onboarding bottleneck caused by confusing configuration. A team needs to locate the narrowest point before investing in local improvements.
The modern foundational concept behind this approach is the Theory of Constraints, which Eliyahu M. Goldratt popularized in The Goal in 1984. Its five focusing steps begin with “Identify the Constraint,” making bottleneck identification the first step in a continuous improvement loop, as described in the Theory of Constraints overview. Earlier bottleneck-focused management ideas appeared in Germany as early as 1963, followed by Wolfgang Mewes' 1971 Energo-Kybernetic System, so the underlying idea predates Goldratt's formulation.
Start with the system, not the department
Map the path from customer signal to business result. For a product request, that path may include feedback collection, triage, product discovery, prioritization, development, release, adoption, and expansion. A constraint at any stage can reduce the value created by every stage after it.
A practical first pass should answer three questions:
- Where does work wait?
- Where does work return for rework or clarification?
- Which step, if improved, would increase completed customer value rather than merely increase activity?
Teams that need a broader process perspective can also review resources on metodologie e strumenti AI per BPM, especially when customer, product, and operational workflows cross multiple systems. The outcome you want is simple: a named constraint, an observable signal, and a clear next action.
Recognizing Symptoms and Metrics
Most SaaS bottlenecks announce themselves through symptoms before they appear in a formal analysis. A support backlog may indicate a product defect, weak self-service documentation, or insufficient escalation capacity. A drop in feature adoption may point to poor discoverability, a broken workflow, or an onboarding dependency that users can't complete.
Start by connecting each symptom to a measurable operational signal rather than treating the symptom as the diagnosis.
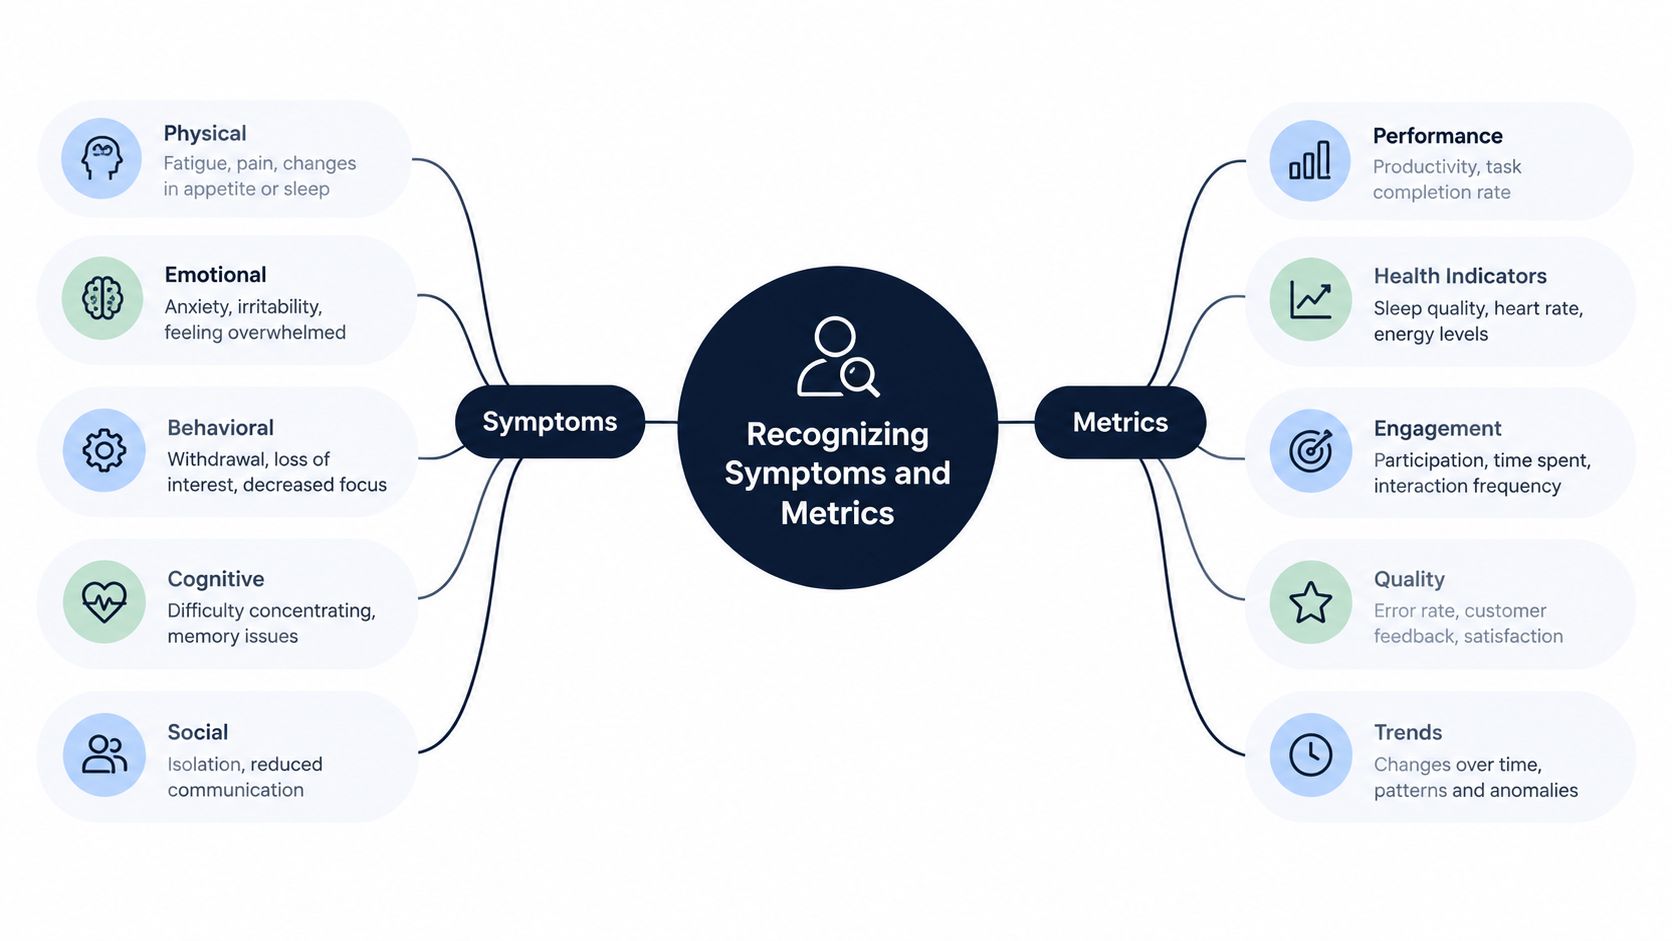
Build a symptom-to-signal map
| Symptom | Signals to inspect | Questions to ask |
|---|---|---|
| Repeated support complaints | Queue length, first-response time, reopen rate, topic clusters | Is one issue creating many contacts, or is the queue itself understaffed? |
| Stalled feature launches | Cycle time, review waiting time, blocked work, rework frequency | Where does work spend time without progressing? |
| Weak activation | Step completion, drop-off location, time between onboarding events | Which step prevents users from reaching the intended outcome? |
| Churn warnings | Complaint themes, usage decline, unresolved severity, account value | Are high-value accounts experiencing the same failure pattern? |
| Error spikes | Error frequency, affected workflow, release timing, recovery path | Is the incident isolated, or does it block a critical customer journey? |
Queue length alone can mislead. A queue may be large because demand is seasonal, because requests vary in complexity, or because a team is processing low-value work ahead of urgent customer-impacting work. Utilization has the same limitation. A heavily occupied team isn't automatically the constraint if increasing its capacity won't improve end-to-end throughput.
Product mix and human skill variation make this harder. A 2026 study found that these factors can create pseudo-bottlenecks, while macro-micro verification improved identification accuracy to 93.8% and kept pseudo-bottleneck misjudgment below 5%, according to the study on pseudo-bottlenecks in manual production. The operational lesson transfers well to SaaS: segment metrics by plan, workflow, product type, agent skill, and issue complexity before declaring a structural constraint.
Practical rule: If a bottleneck disappears when the customer mix changes, investigate the mix before redesigning the whole process.
Use leading and lagging signals together
Leading indicators include rising wait times, growing blocked work, repeated handoffs, and increasing error recurrence. Lagging indicators include missed expansion opportunities, downgrades, churn, and delayed launches. A useful dashboard pairs them, so the team can see both the operational pressure and the commercial consequence.
Implementing Data Collection and Instrumentation
Good bottleneck identification depends on event context. A ticket count tells you that work exists. It doesn't tell you where the customer journey failed, which account was affected, how long resolution took, or whether the same issue appears in product usage data.
Set up instrumentation around a specific decision first. If the question is why onboarding stalls, collect account creation, configuration, invitation, integration, first-value, support contact, and cancellation events. If the question is why releases queue, capture pull requests, review requests, CI failures, deployment events, rollback events, and issue status changes.
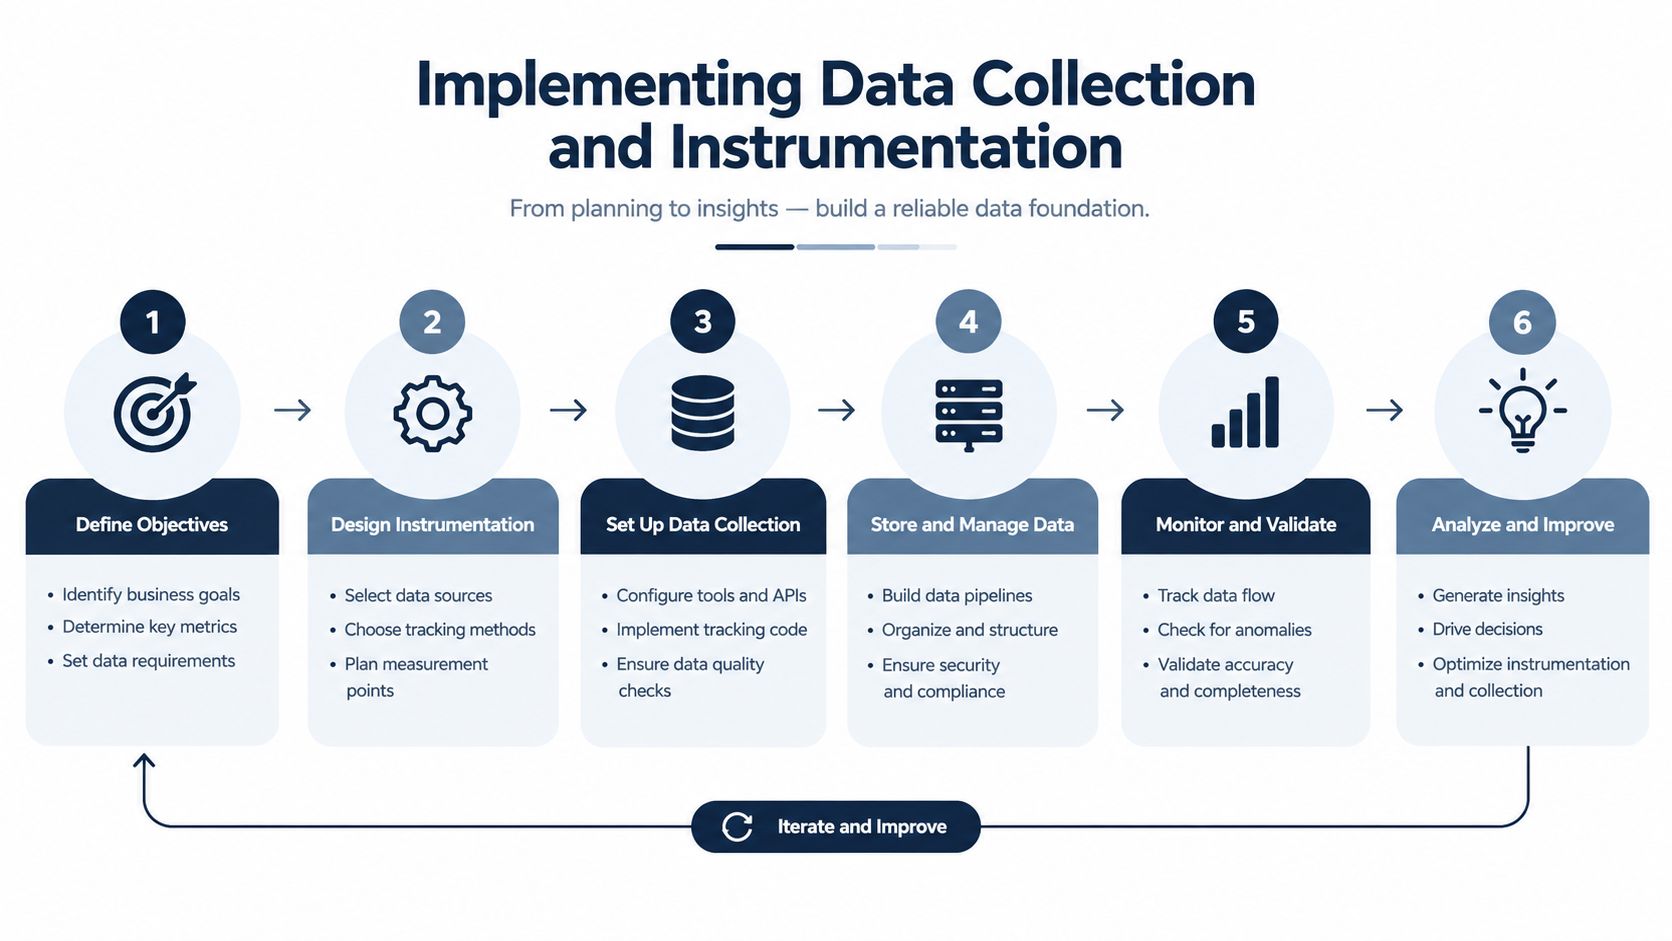
Create a usable event model
A practical pipeline can follow this sequence:
- Define the decision: State what the team needs to decide, such as whether onboarding needs product work or additional implementation capacity.
- Name the entities: Connect users, accounts, subscriptions, tickets, issues, releases, and workflow events through stable identifiers.
- Capture timestamps: Record when work entered, waited, started, completed, failed, and resumed.
- Integrate qualitative context: Bring in Zendesk and Intercom conversations, sales call themes, and customer success notes alongside behavioral data.
- Validate event quality: Check missing identifiers, duplicated events, inconsistent status names, and clock differences before analysis.
- Automate delivery: Schedule feeds into a warehouse or intelligence layer, then expose only the metrics needed for the operating decision.
An industrial data pipeline illustrates the pattern clearly. It merges event logs with order data, extracts the actual process model, and then uses utilization statistics to quantify how busy each activity is, as documented in this production analytics pipeline. SaaS teams can apply the same logic by joining product events with subscription and support records.
Don't instrument every possible event at once. Excess telemetry creates maintenance work and makes ownership unclear. Start with the critical path, assign an owner to each source, and document what each event means.
For implementation detail, teams can use this guide to build data pipelines and establish a repeatable path from source systems to decision-ready metrics.
A short visual walkthrough can help align product, data, and engineering stakeholders before implementation:
Applying Analysis and Validation Techniques
Once signals are integrated, resist the urge to rank every component by a single metric. A station, team, or feature can show high utilization without limiting throughput, while a less busy dependency can block the system through timing, sequencing, or scarce expertise.
A stronger workflow begins with throughput sensitivity. Isolate the throughput associated with each candidate and ask whether system throughput responds more strongly to that candidate than to any other. The manufacturing literature recommends validating the resulting observations with a t-test when observations are independent and normally distributed, as described in this statistical bottleneck-identification workflow.
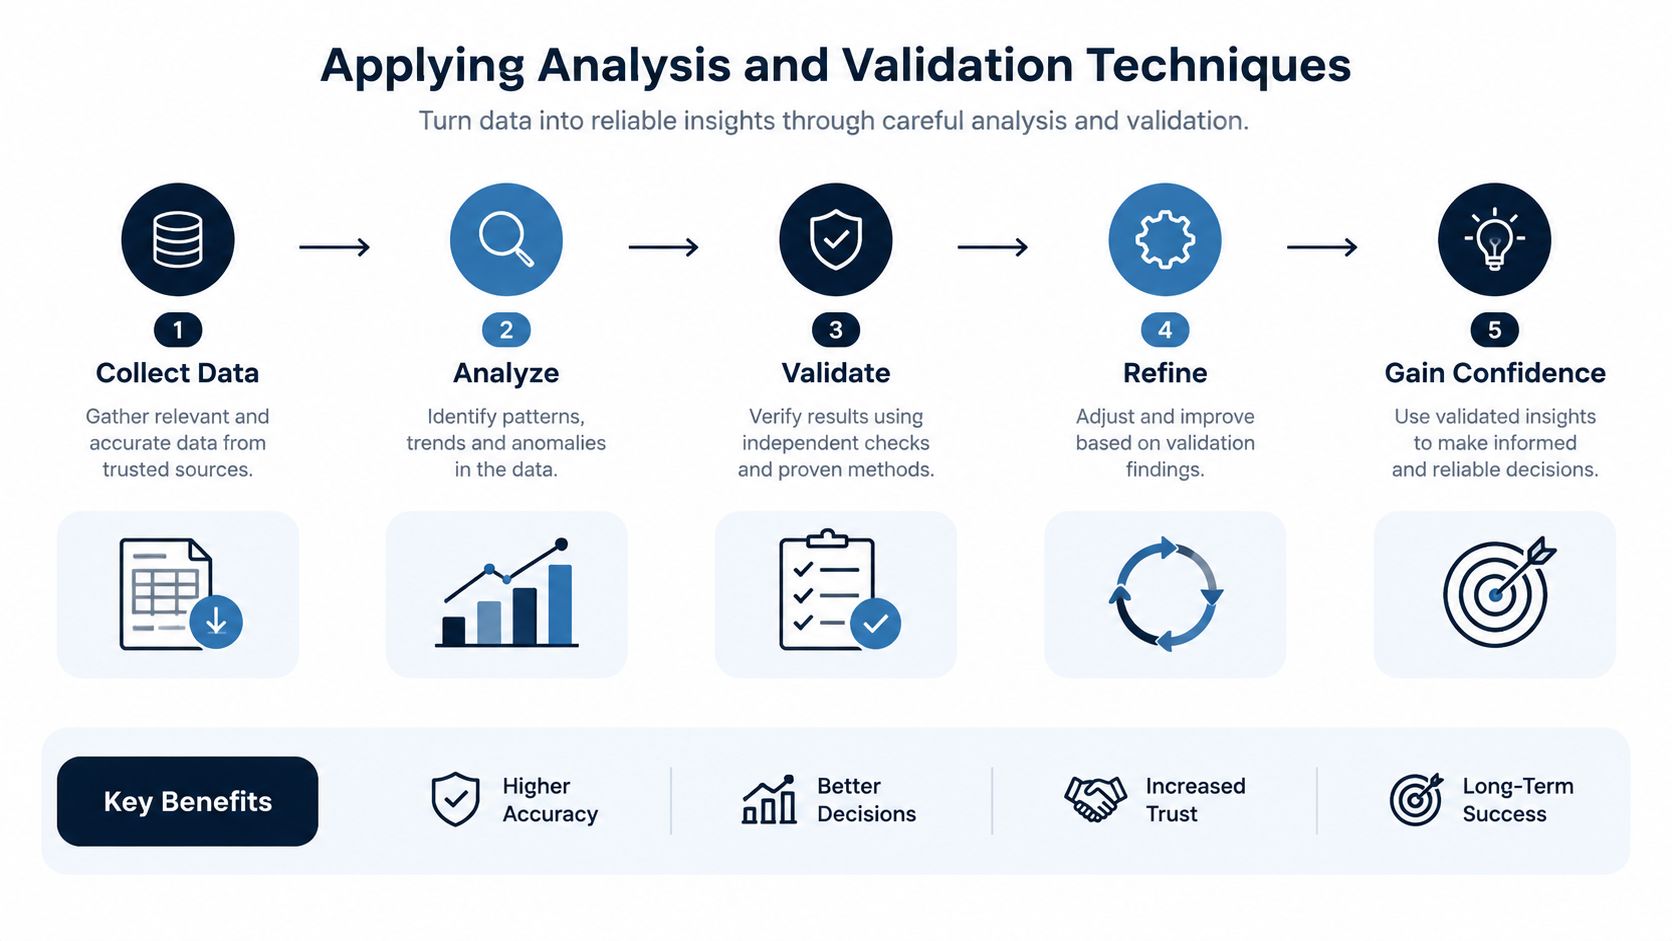
Combine rules with statistical checks
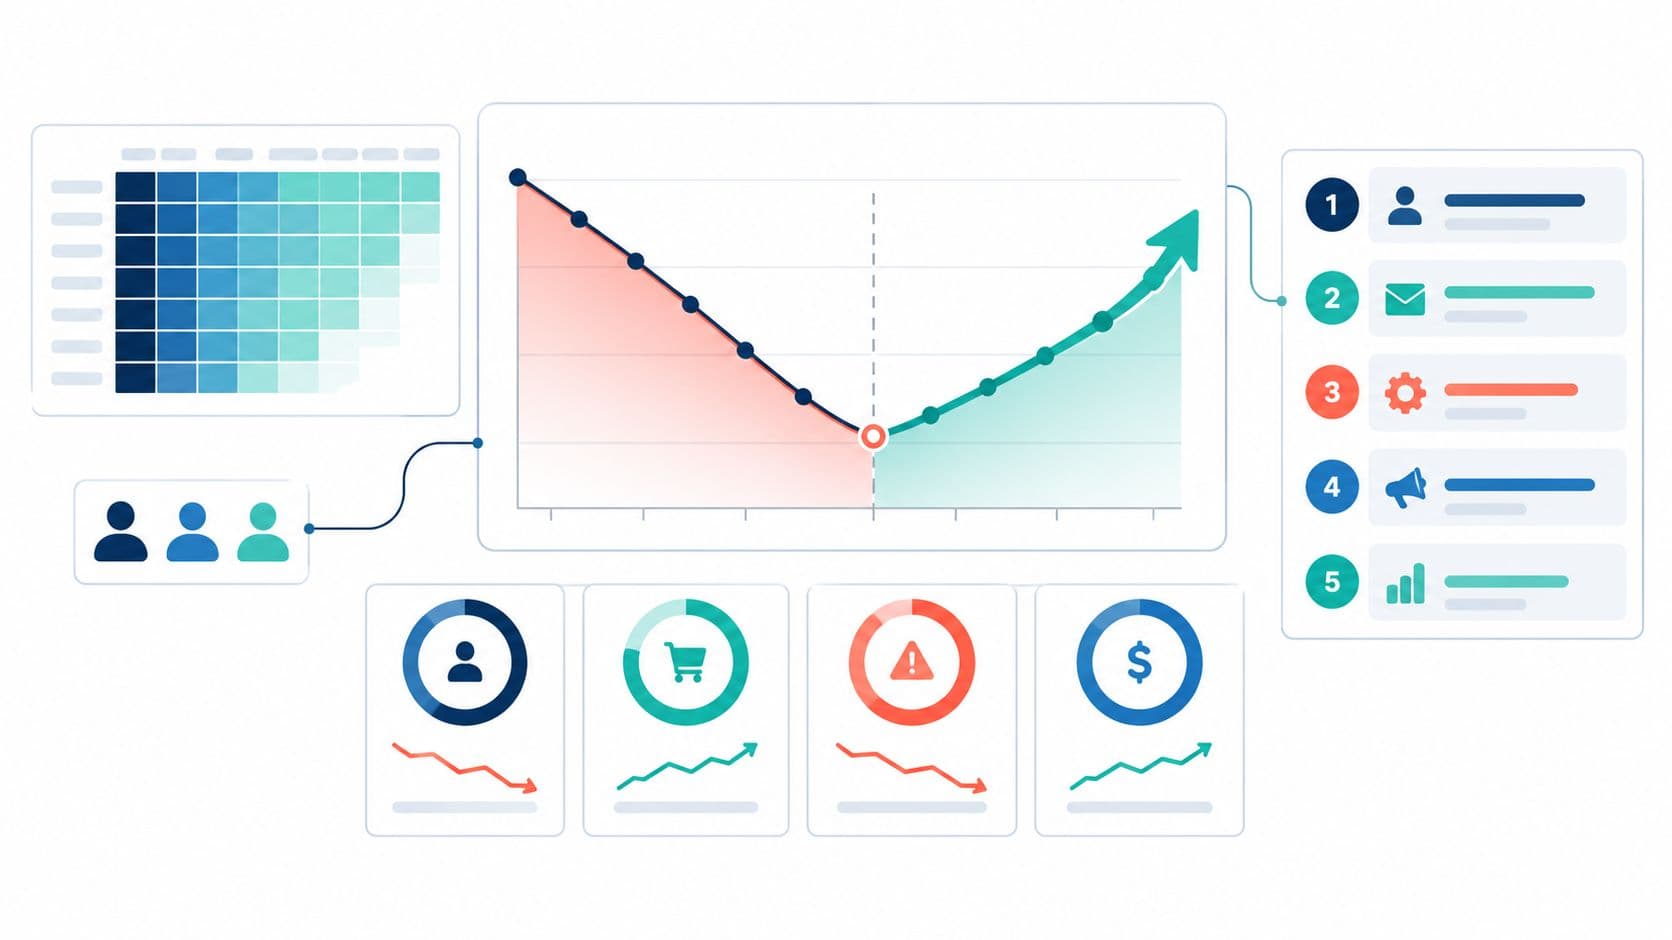
A turning-point rule provides a practical visual test. If the line has a single turning point, that station is treated as the bottleneck. If multiple turning points appear, select the station with the highest bottleneck index. In SaaS, the equivalent might be a sharp transition between completed onboarding steps and abandoned accounts, or between accepted work and review-ready work.
Noisy operational data needs preparation. Batch-means aggregation can reduce the effect of individual events, while independence checks such as the Von Neumann ratio test help determine whether observations are suitable for significance testing. If those assumptions fail, report the uncertainty and use the analysis as directional evidence rather than presenting a false level of precision.
Consider a team investigating onboarding delays. It samples event streams, groups accounts by comparable onboarding paths, measures queue time between configuration and first value, then compares those observations with implementation capacity and support contacts. The team suspects the integration step, but it doesn't act on queue time alone. It increases capacity around that step in a controlled test and checks whether completed onboarding rises. If the outcome doesn't change, the team returns to the workflow and tests the next candidate.
That validation loop matters because single-metric analysis creates false positives. Re-running the process after increasing candidate capacity is a practical test. If throughput doesn't improve, the candidate wasn't the true constraint.
For teams working with application infrastructure, the same principle applies to technical dependencies. A review of optimizing database performance can help engineers investigate whether query behavior, indexing, or workload patterns are contributing to a product-level constraint. Product teams should also document assumptions and review model validation techniques before turning a ranking into a roadmap commitment.
Prioritizing Constraints by Revenue Impact
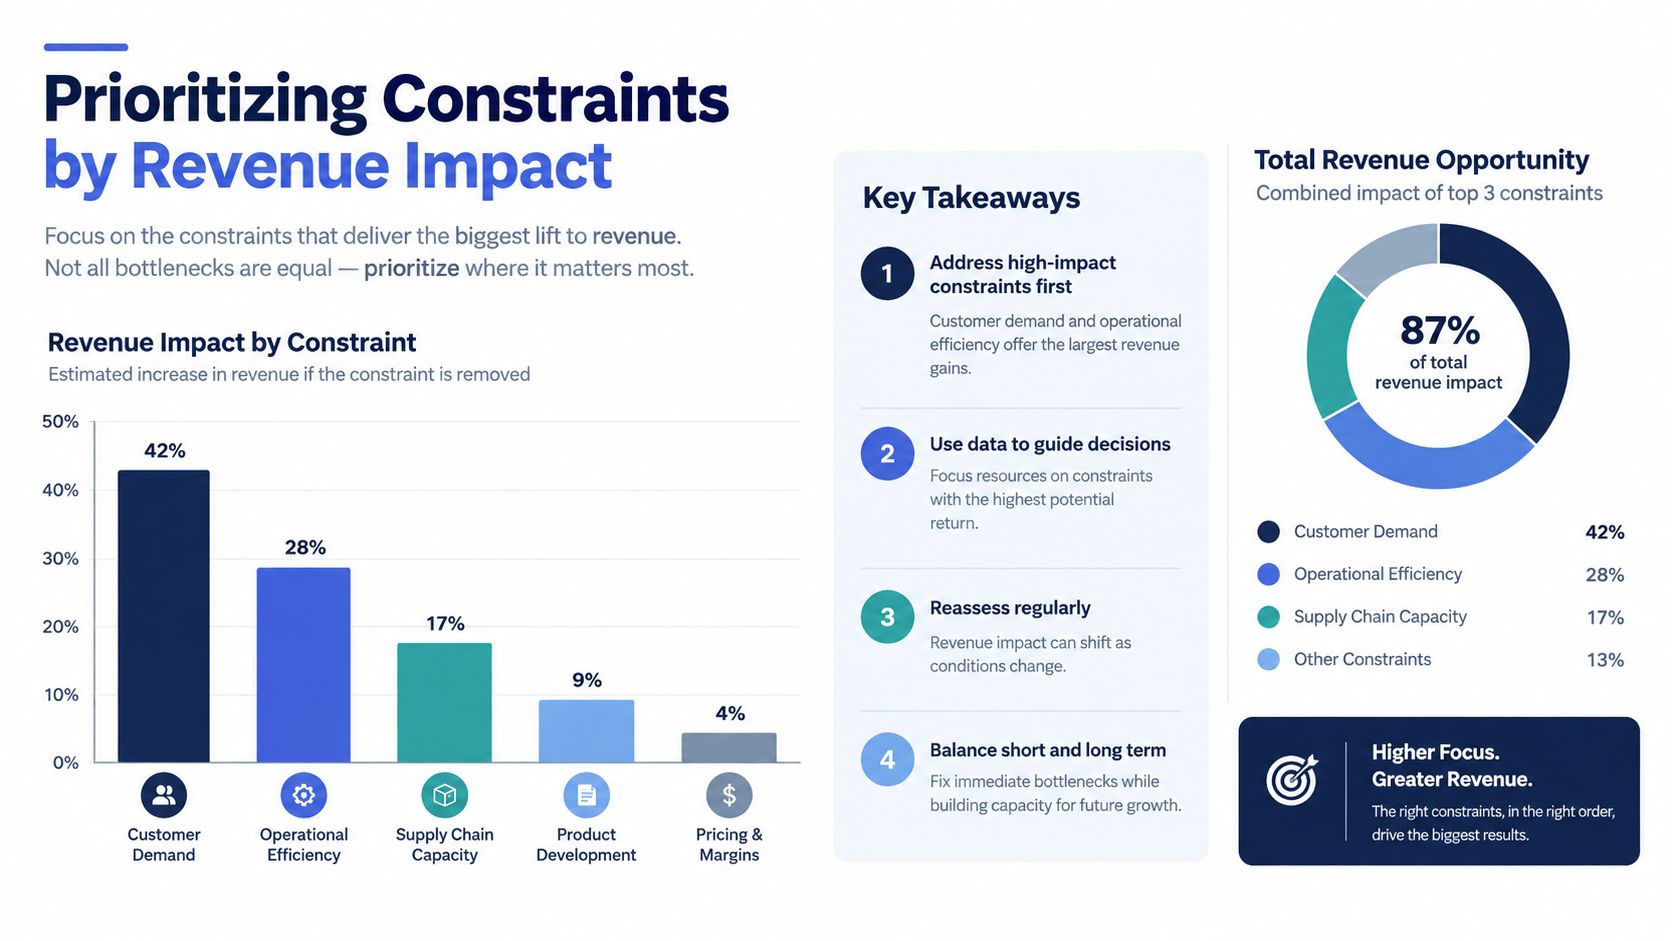
A bottleneck isn't automatically a top priority because it's visible, irritating, or expensive to operate. Product teams should prioritize constraints by the customer and revenue value they block.
The scorecard can remain simple. For each candidate, estimate the affected customer segment, the severity of the blocked outcome, the likelihood of churn or delayed expansion, the support burden, and the confidence in the evidence. The point isn't to manufacture exact financial certainty. It's to compare competing constraints with the same decision criteria.
Score the blocked outcome
A useful internal formula is:
Revenue impact score = affected account value × exposure to the constraint × probability of commercial harm × confidence in the evidence
Keep each factor defined in your own operating model. Account value might reflect recurring revenue or expansion potential. Exposure could reflect how often the account reaches the blocked workflow. Commercial harm might include churn risk, delayed conversion, blocked upsell, or avoidable service effort.
A score isn't a prediction. It's a prioritization instrument. If the data is weak, lower confidence rather than hiding uncertainty inside an inflated estimate.
| Decision factor | Evidence to use |
|---|---|
| Customer exposure | Product events, account segments, workflow completion |
| Commercial consequence | Renewal risk, expansion discussions, lost use cases |
| Operational cost | Support contacts, escalation effort, rework |
| Confidence | Sample quality, consistent themes, validated event joins |
| Time sensitivity | Release dependency, active deal cycle, incident recurrence |
This approach changes roadmap conversations. A minor usability issue affecting many low-value accounts may deserve less immediate attention than an integration failure blocking a strategic expansion path. Conversely, a small account segment may represent a critical product capability or a repeatable market pattern, so teams shouldn't reduce prioritization to current contract value alone.
Use customer language to validate the score. SigOS can combine feedback and behavioral patterns, calculate revenue impact, and produce prioritized recommendations, but the product decision still belongs to the team. The revenue impact analysis guide offers a useful reference for structuring that connection between customer evidence and prioritization.
Practical Playbook and Tips for SaaS Teams
A product team notices that customers keep asking for help with the same workflow. Support tags the conversations, product reviews the related usage path, and engineering checks recent changes. The team doesn't open a generic “improve onboarding” project. It traces the issue from the first failed event to the support interaction and identifies the specific step where accounts stop progressing.
The next move is operational, not ceremonial. A signal enters the team's alerting workflow when the issue cluster grows, affects a commercially important segment, or coincides with a meaningful usage decline. The alert includes representative feedback, affected workflow events, likely cause, owner, and the evidence behind the priority.
Turn detection into an action
A useful playbook should create a small number of clear outcomes:
- Signal review: Product or support confirms that the pattern is real and not a duplicate, campaign effect, or tagging error.
- Impact assessment: The owner checks affected segments, account importance, support effort, and downstream workflow loss.
- Validation task: Engineering or data teams run a targeted test, such as increasing capacity, changing routing, or removing a handoff.
- Issue creation: The system creates a Jira, Linear, or GitHub issue with context, evidence, owner, and acceptance criteria.
- Outcome check: The team compares the original symptom with the post-change workflow and commercial signals.
SigOS fits this workflow as one product intelligence option. Its Correlate, Calculate, and Act capabilities connect feedback with behavioral patterns, assign revenue impact scores, and recommend actions, with integrations that can create issues in systems such as Zendesk, Intercom, Linear, Jira, and GitHub.
Guardrails keep automation useful. Require human confirmation for high-impact alerts, suppress duplicate notifications, separate incident signals from recurring product patterns, and assign one accountable owner. A monthly bottleneck review should examine unresolved constraints, recently shifted constraints, validation results, and whether completed work improved the intended outcome.
Operational teams can use the same discipline for delivery infrastructure. Guidance on optimizing live update pipelines can help engineering leaders inspect release and deployment paths where a technical delay becomes a customer-facing constraint.
Putting Bottleneck Identification into Practice
Turn the framework into a repeatable operating habit:
- Map symptoms: Connect complaints, drop-offs, queues, errors, and delays to workflow stages.
- Integrate evidence: Join event logs with account, subscription, support, and delivery data.
- Validate candidates: Use sensitivity checks, turning-point analysis, suitable aggregation, and controlled capacity tests.
- Score consequences: Rank constraints by blocked customer outcomes, revenue exposure, operational cost, and confidence.
- Trigger action: Route confirmed patterns into an owned playbook with alerts, issue creation, and outcome review.
A phased rollout works better than a broad instrumentation project. Start by mapping one critical journey, then add the minimum event data needed to test its likely constraint. Expand integrations after the team has a validated decision workflow, and establish recurring reviews once owners can compare detection with outcomes.
Bottlenecks don't stay fixed. Recent research emphasizes that they can shift over time, reinforcing the need for dynamic detection and real-time integration, as discussed in this research on evolving bottleneck identification. Treat bottleneck identification as an operating capability, not a one-time ranking exercise.
SigOS helps SaaS teams connect customer feedback with behavioral patterns, quantify which issues threaten revenue, and turn confirmed signals into prioritized product actions. Visit SigOS to see how your team can build a continuous bottleneck identification workflow around the customer outcomes that matter most.
Keep Reading
More insights from our blog

Ready to find your hidden revenue leaks?
Start analyzing your customer feedback and discover insights that drive revenue.
Start Free Trial →