What Is Signal Detection in Product Intelligence
Learn what is signal detection in product intelligence, how it separates actionable customer insights from noise, and how AI platforms like SigOS turn feedback
You're staring at a backlog that looks like evidence of customer demand, but behaves more like a junk drawer. Support tickets repeat the same vague complaint, sales calls contain urgent requests from a handful of accounts, product analytics show users abandoning a workflow, and Slack keeps producing new opinions faster than your team can evaluate the old ones. Everyone has data. Nobody has agreement about what deserves engineering time.
That's the practical problem behind what is signal detection in product intelligence. It isn't about collecting more feedback or deleting every unusual request. It's about finding patterns across customer language, behavior, and commercial context that point to a meaningful product outcome, then turning those patterns into decisions a roadmap can defend.
The Feedback Overload Problem Every Product Team Faces
A product manager opens the week with several competing narratives. A strategic enterprise customer wants a reporting overhaul. A cluster of smaller accounts keeps asking for a mobile experience. Sales says the lack of single sign-on is blocking opportunities. Support is forwarding tickets about confusing permissions, while the product dashboard shows a quiet drop in usage after onboarding.
None of these inputs is automatically wrong. The problem is that they arrive in different formats, from different people, with different levels of context. A ticket describes frustration. A sales call describes perceived deal risk. A usage event reveals behavior without explaining intent. Treating them as interchangeable creates false confidence.
Practical rule: A request becomes useful product evidence only after you connect it to the customer affected, the behavior observed, and the business outcome at stake.
Without that connection, roadmap discussions tend to follow predictable patterns:
- The loudest voice wins: A senior stakeholder repeats a request until the team treats repetition as validation.
- The latest incident takes over: A recent escalation displaces a slower, more persistent retention problem.
- The most familiar solution gets funded: Engineering chooses a feature that sounds easy to specify, even when the underlying problem remains unclear.
The result is expensive ambiguity. Engineers start work before the team has agreed on the problem. Sales promises capabilities that product hasn't validated. Customer success escalates individual accounts while broader patterns remain hidden. After launch, adoption may disappoint because the team solved the request as stated rather than the friction that caused it.
The data environment makes this harder, not easier. Product teams now work across support systems, call transcripts, surveys, reviews, community discussions, and behavioral events. In regulated domains, signal detection already spans spontaneous reports, electronic health records, claims, registries, social media, and wearable or mobile data, but newer sources can be harder to validate than established reporting systems. The same cross-source challenge appears in product work, where teams must decide which evidence is credible for which decision. IQVIA's discussion of real-world data in pharmacovigilance illustrates why source quality and context matter as much as volume.
Signal detection provides the discipline missing from the backlog. It asks whether a pattern repeats, which customers experience it, what they do afterward, and whether the pattern connects to churn, expansion, activation, support cost, or sales friction. That shift turns feedback from a queue of requests into an evidence system.
Signal Detection Defined for Product Intelligence
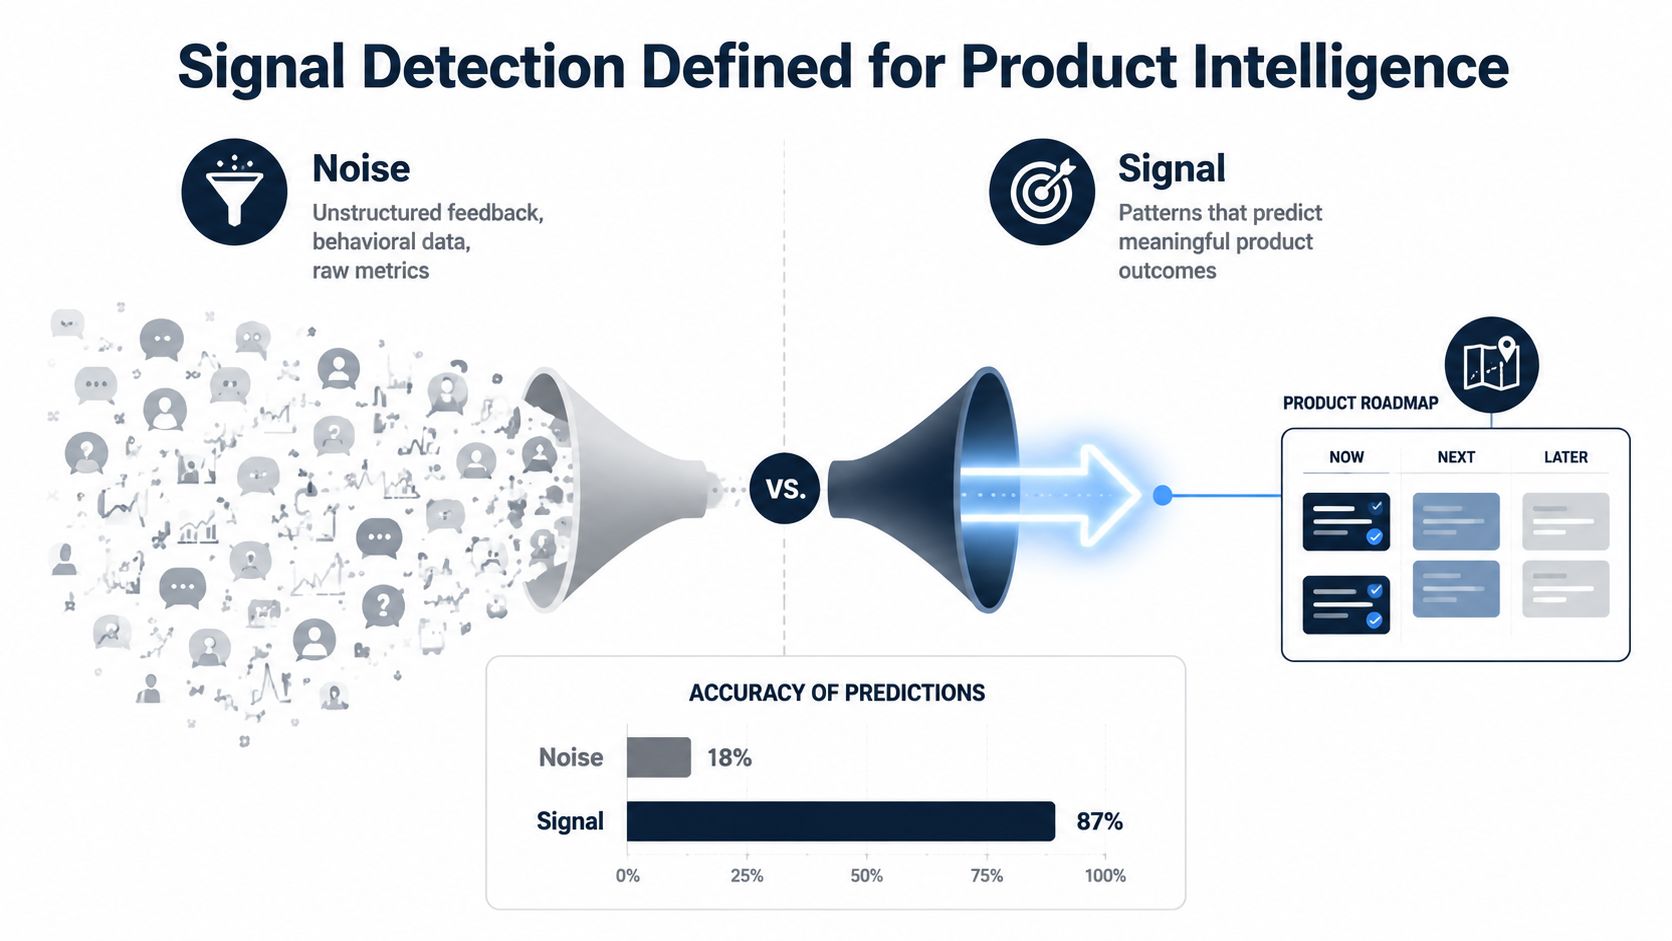
Signal detection in product intelligence is the systematic process of identifying patterns in customer feedback and behavioral data that reliably predict a meaningful product or business outcome. Those outcomes can include churn risk, expansion potential, adoption barriers, or a workflow that prevents customers from reaching value.
A radio tuner makes the analogy clear. Static contains many frequencies, but the listener wants one intelligible transmission. A product team faces a similar mix of opinions, edge cases, repeated symptoms, accidental workarounds, and behavioral changes. Signal detection isolates the patterns that deserve attention because they connect to something measurable in the business.
Filtering noise is only the first step
Generic noise filtering removes irrelevant or duplicate information. That's useful, but insufficient. A filter might discard spam, merge duplicate tickets, or exclude feedback unrelated to a product area. Signal detection goes further by ranking the remaining patterns according to relevance, recurrence, customer context, behavioral evidence, and likely business impact.
Consider two feedback themes. One appears frequently among users who rarely engage with the product and has no visible effect on renewal behavior. Another appears less often, but comes from accounts approaching renewal and coincides with declining usage of a core workflow. Volume alone favors the first theme. Product intelligence should investigate the second.
This is why signal isn't synonymous with popularity. A pattern mentioned by a small number of strategic accounts can carry more decision value than a request repeated by a large, low-revenue segment. The score should reflect the question being answered, not a universal definition of importance.
Product intelligence differs from academic SDT
Academic Signal Detection Theory examines how people or systems distinguish meaningful stimuli from noise, often through concepts such as hits, misses, correct rejections, and false alarms in binary decisions. That framework helps explain trade-offs between sensitivity and specificity.
Product signal detection is broader and more continuous. It combines language, behavior, account attributes, and outcomes to estimate which patterns deserve action. The output isn't “signal” or “no signal.” It might be a ranked list of issues, an emerging churn theme, or a feature request linked to expansion potential.
AI can help with prioritization and scale, but it shouldn't be treated as a causality machine. Research on machine learning and network analysis in pharmacovigilance emphasizes the need to distinguish detection from causality assessment, especially when inputs are heterogeneous and high-dimensional. The PubMed-indexed research on AI-assisted signal detection supports the same operating principle for product teams: let models surface and rank relationships, then use human review and targeted evidence to test what they mean.
Teams evaluating commercial intent can also explore how buying signals in GetIntel are framed around observable patterns rather than isolated statements. The useful question is always the same: does this pattern predict an outcome that changes what the team should do?
Methods and Metrics for Finding Signal in Customer Data
Start by separating two evidence families. Qualitative data explains what customers experience and how they describe it. Behavioral data shows what they do. Neither category is sufficient on its own.
Support tickets, sales call transcripts, interview notes, NPS verbatims, community posts, and review text reveal language, urgency, workarounds, and perceived value. The strongest analysis groups this material into themes, distinguishes symptoms from requested solutions, and preserves account context. The same phrase can mean different things depending on whether it comes from an evaluation, an active implementation, or a renewal-risk conversation.
Behavioral sources include feature funnels, session recordings, usage frequency, error logs, and time-to-value events. These sources help teams identify where users stop, which workflows decay, and whether a reported problem appears in actual product behavior. A customer may ask for a new dashboard while the more fundamental signal is that existing reports load slowly or fail to answer a recurring operational question.
Useful methods for qualitative evidence
Thematic clustering groups semantically similar feedback even when customers use different words. Sentiment-weighted frequency analysis gives more attention to intense or escalating frustration than to neutral repetition. Revenue-segmented tagging connects themes to account value, renewal stage, plan type, and expansion context.
A practical workflow looks like this:
- Normalize the raw text and remove duplicates.
- Cluster related phrases into problem themes.
- Tag each theme by customer segment and lifecycle stage.
- Compare mentions with usage changes, support escalation, renewal risk, or expansion activity.
- Review the highest-impact themes with the teams closest to the customer.
Teams building this process manually can use this guide to analyzing customer feedback as a reference for organizing qualitative inputs before adding more advanced scoring.
Behavioral methods reveal hidden friction
Cohort-based anomaly detection compares behavior across customer groups instead of treating every account as equivalent. Drop-off correlation analysis checks whether a feedback theme appears near a measurable abandonment point. Feature-engagement decay curves show whether usage falls gradually, immediately, or after a product change.
Avoid presenting correlation as proof. If customers mentioning export problems also cancel more often, that relationship deserves investigation. It doesn't prove that export functionality caused every cancellation.
The most useful metrics are decision aids, not decorative dashboard figures:
- Signal-to-noise ratio: The share of feedback items connected to a measurable outcome.
- Revenue-weighted mention velocity: The rate at which a theme grows among paying customers, adjusted for commercial importance.
- Churn-correlation coefficient: The statistical relationship between a feedback theme and observed cancellation behavior.
| Data Source | Method | Key Metric | Example Signal Output |
|---|---|---|---|
| Support tickets | Thematic clustering and account tagging | Signal-to-noise ratio | Repeated permissions friction tied to escalations |
| Sales calls | Revenue-segmented theme analysis | Revenue-weighted mention velocity | Reporting objections increasing in active opportunities |
| Product events | Cohort anomaly detection | Usage decline by cohort | Onboarding users abandoning a key setup step |
| Session recordings | Drop-off correlation analysis | Theme and abandonment relationship | Users leaving after encountering a confusing control |
| Error logs | Incident clustering | Recurrence and affected-account context | A defect concentrated in high-value workflows |
A disciplined team won't prioritize a theme because it sounds important. It will ask which customers experience it, what they do next, and whether the evidence changes a commercial or product decision.
Common Pitfalls That Turn Noise Into False Signals
False signals usually enter through reasonable shortcuts. Teams need a fast way to make decisions, so they use volume, recency, or seniority as proxies for importance. Those proxies work until they don't, and product teams often notice the failure only after engineering capacity has been committed.
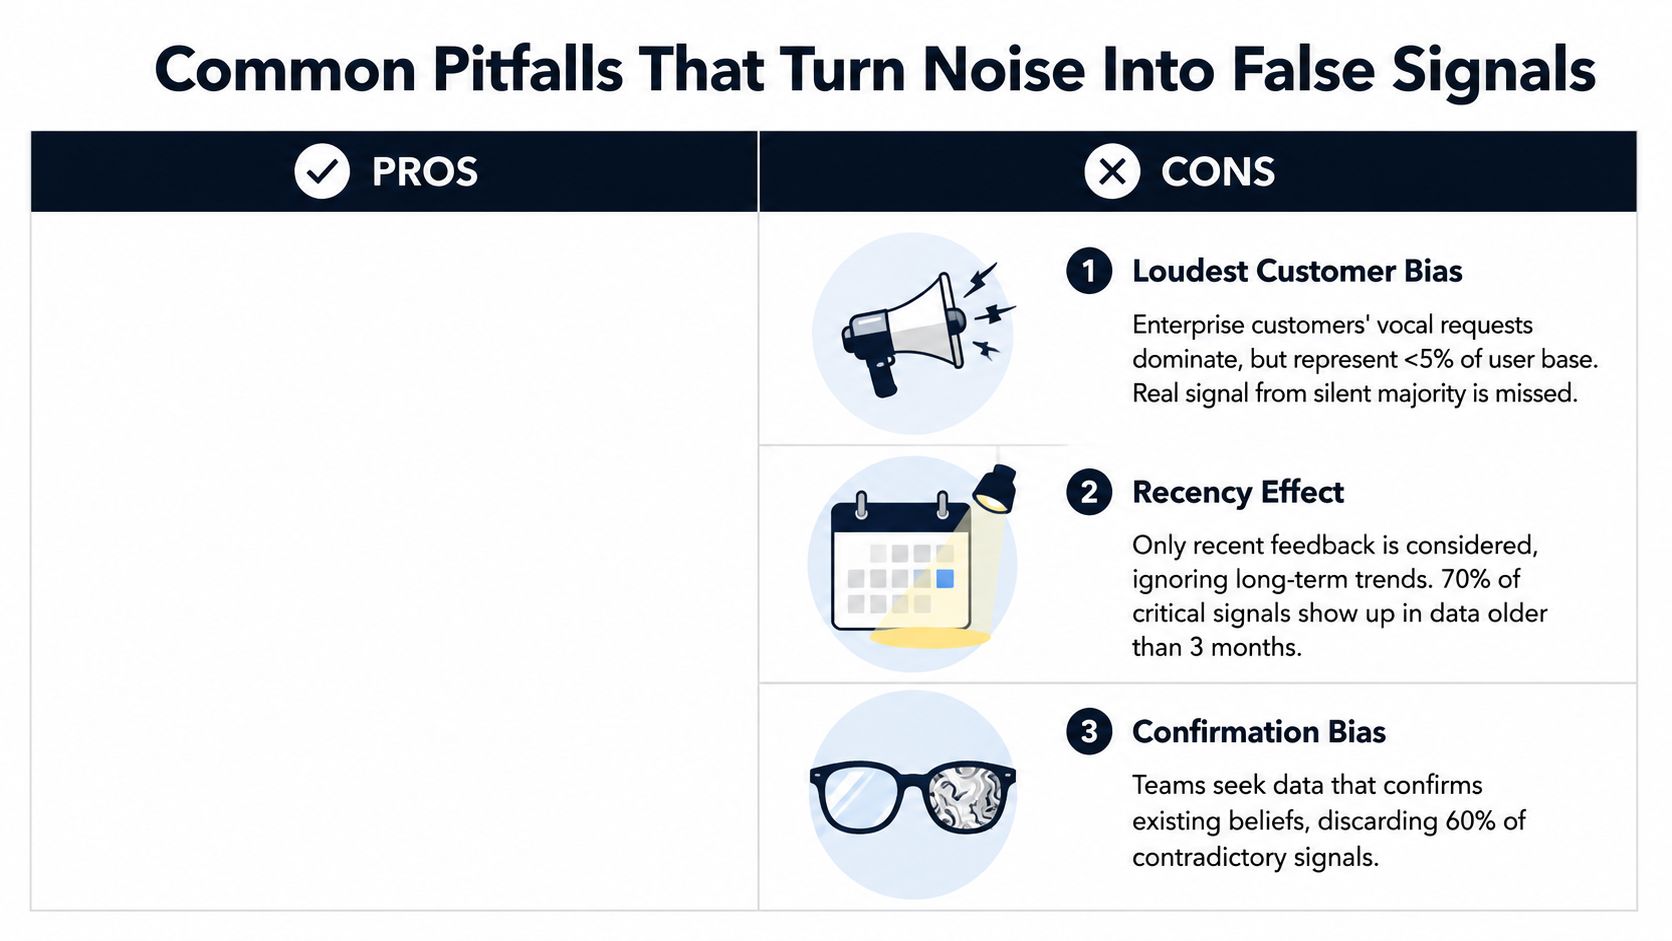
Four biases deserve active resistance
Loudest-customer bias gives disproportionate weight to the account with the strongest access to leadership. Enterprise feedback can be strategically important, but it may not represent the broader customer base. The right response isn't to ignore large accounts. It's to label the evidence clearly and compare it with segment coverage, usage, renewal exposure, and implementation cost.
The recency trap treats a sudden support spike as more meaningful than a persistent source of friction. A release can create a visible burst of tickets while a long-standing workflow problem continues to influence cancellations. Review a theme across time before calling it an emerging signal.
Vanity metrics create false reassurance. A better NPS comment or a higher survey score doesn't automatically mean retention improved. Survey participation, customer mix, response timing, and the behavior of non-respondents all affect interpretation.
Confirmation bias leads product managers to collect quotes supporting an existing roadmap bet while dismissing contradictory evidence. This is especially dangerous in sales-led environments, where a feature request can sound like a clear deal requirement even when buyers don't adopt similar capabilities after launch.
A common failure pattern looks like this: sales calls repeatedly request a broad feature suite, product builds it, and post-launch usage remains weak. The team treated request frequency as purchase intent and never tested whether users could name the workflow, trigger, or measurable outcome the feature would improve.
Stress-test every apparent signal
Ask these questions before changing the roadmap:
- Who is represented? Are the accounts still active, or have churned customers disappeared from the feedback pool?
- What changed afterward? Did the customer reduce usage, escalate support, delay renewal, expand, or do nothing?
- What would disprove the theory? Which observation would make the team lower the signal score?
- Is the request a solution or a symptom? Can customers describe the underlying job and current workaround?
- Does another source agree? Do product events, account notes, and support language point in the same direction?
Survivorship bias deserves special attention. Customers who remain engaged may keep reporting problems. Customers who leave may stop submitting tickets entirely, so the absence of complaints can hide the strongest warning.
Data hygiene also matters. Duplicate records, inconsistent account identifiers, missing timestamps, and poorly defined event names can turn ordinary reporting defects into apparent product trends. Teams can use this resource on data quality issues to audit the foundation before interpreting model outputs.
How AI Platforms Operationalize Signal Detection at Scale
Manual review works for a focused investigation. It breaks down when analysts must read every ticket, listen to every call, compare account records, and inspect behavioral data at the same time. The operational challenge isn't merely classification. It's maintaining a consistent connection between a detected theme and the customer or business outcome attached to it.
Ingest the full customer context
An AI-driven product intelligence workflow begins by unifying sources that teams usually inspect separately. Support tickets from Zendesk or Intercom, sales calls, NPS responses, reviews, surveys, product events, and issue trackers can form one analysis corpus when account identity and timestamps are mapped consistently.
That unified view prevents a familiar failure. A support team sees “report export” as a recurring ticket category. Sales sees it as an objection. Product analytics sees users opening reports and leaving without completing the workflow. The platform can treat these as related evidence instead of disconnected anecdotes.
Analyze themes, movement, and product surfaces
Natural language processing can cluster similar feedback, identify new language around an existing issue, and detect sentiment movement associated with a product area. Behavioral models can compare cohorts, locate unusual drop-offs, and connect event changes with qualitative themes.
AI is useful here because it can process heterogeneous inputs at a scale that manual tagging can't sustain. It still needs guardrails. Teams should inspect representative examples, challenge ambiguous clusters, and separate “customers mention this” from “this causes the outcome.”
For readers working specifically on quality workflows, an AI defect detection guide offers useful context on applying AI to identify defects and prioritize investigation. The product intelligence version adds account and revenue context to the defect itself.
Score impact, then route the decision
The differentiator is the impact layer. A theme becomes more actionable when the system can map it to affected accounts, contract context, usage changes, renewal risk, and expansion opportunity. The output should help a product leader answer, “What happens if we delay this?” rather than merely, “How many people mentioned it?”
SigOS is one example of this operating model. It ingests customer feedback and usage information, identifies patterns, and connects those patterns with revenue impact so teams can route a finding into product planning or account action. Teams exploring real-time data analytics can apply the same principle to reduce the delay between a behavioral change and an investigation.
The resulting business case might move from “users want better reporting” to “a specific dashboard limitation affects accounts with renewal exposure.” The exact amount must come from the company's own account and contract data. The value of the workflow is that it makes that calculation possible, auditable, and tied to evidence.
AI should rank and connect evidence. Product leaders still need to validate causality, choose the intervention, and decide whether the expected outcome justifies the engineering cost.
Actionable Steps and Real Use Cases for Product Teams
Start with an audit, not a platform purchase. List every feedback source your team uses, then identify the blind spots. Churned customers, free-tier users, and lost opportunities often sit outside the main feedback loop, which means your dataset may overrepresent customers who remain available and engaged.
Next, create a lightweight scoring model. Raw volume can be one input, but it shouldn't be the deciding factor. Weight themes by customer value, usage frequency, lifecycle stage, sentiment intensity, recurrence, and evidence of a business outcome. Keep the score explainable enough that customer success, sales, design, and engineering can challenge it.
A weekly review creates the operating rhythm. Bring product, design, growth, support, and customer-facing leaders together to examine the highest-priority themes against current roadmap bets. Review whether each theme is strengthening, weakening, or changing shape. Then assign an owner and a validation action, such as a customer interview, cohort analysis, prototype test, or account review.
Use cases that turn patterns into decisions
| Use Case | Signal Source | Detection Method | Business Impact |
|---|---|---|---|
| Churn-risk discovery | Support metadata and account history | Theme matching against renewal behavior | Focus retention work on the underlying friction |
| Activation improvement | Feature requests and product events | Correlate requests with onboarding drop-off | Remove the step preventing users from reaching value |
| API prioritization | GitHub issues and developer communities | Cluster frustration by endpoint and workflow | Rank platform work by developer impact and commercial relevance |
A B2B SaaS team might find that a minor-looking support field, such as repeated escalation around permissions, appears disproportionately among accounts approaching renewal. The correct next move isn't automatically a permissions rewrite. It may be a focused workflow fix, clearer administration controls, or targeted enablement.
A growth team can compare requests for setup help with event-level abandonment. If users ask for guidance immediately before leaving a configuration flow, the product may need better activation design rather than another feature.
A platform team can combine GitHub issues, community posts, and support conversations to identify where developers lose time. That evidence can guide API documentation, error handling, or endpoint design, instead of allowing the most frequently requested enhancement to dominate.
Keep an evidence log for every major prioritization decision. Record the source, affected segment, observed behavior, confidence level, proposed action, and result after release. Over time, this gives the team a calibration loop. It also exposes which signals repeatedly produce false alarms.
Building Signal Detection Into Your Product Workflow
Signal detection works best as a standing product capability, not a quarterly research project. Teams that treat customer evidence as a first-class roadmap input can compare it directly with revenue priorities, engineering constraints, and product strategy.
Adoption can start small. Connect one high-volume channel, such as support tickets or sales calls, to a detection layer. Validate the output against known churn patterns, expansion conversations, and product usage. Once the team trusts the classifications, add behavioral events and additional qualitative sources.
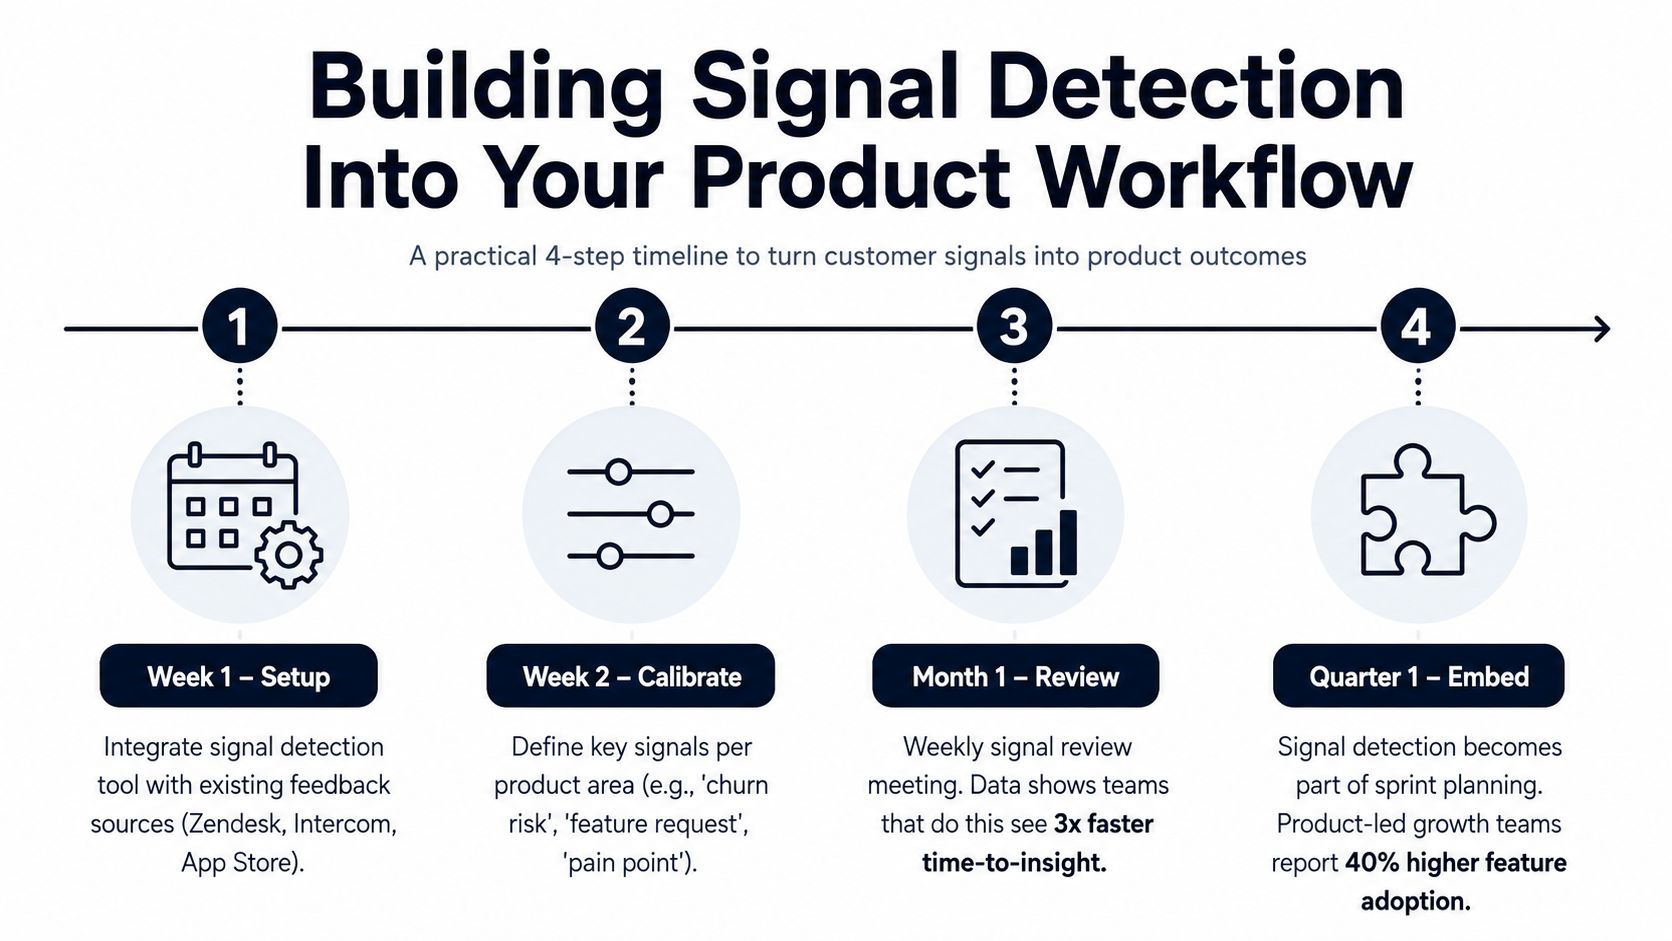
The first month should focus on calibration and trust. Adjust thresholds, merge duplicate themes, define product-area taxonomies, and review false positives openly. A quick win, such as finding a hidden renewal risk and giving the account team a precise intervention, helps stakeholders see why the system belongs in normal planning.
AI is also changing the broader definition of signal detection. Recent work points toward multimodal foundation models that can fuse heterogeneous streams, but detection still needs a separate causality and decision process. The practical advantage will belong to teams that combine automated pattern discovery with disciplined human validation.
Make the workflow visible in sprint planning. Every high-impact signal should have a path to action, whether that means a roadmap item, a bug investigation, a customer-success playbook, an experiment, or a decision to do nothing.
SigOS helps product and growth teams connect support tickets, sales conversations, customer feedback, and usage patterns to the revenue impact behind each signal. Visit SigOS to see how an AI-driven product intelligence workflow can help your team replace subjective backlog debates with evidence-based prioritization.
Keep Reading
More insights from our blog



Ready to find your hidden revenue leaks?
Start analyzing your customer feedback and discover insights that drive revenue.
Start Free Trial →