Revenue Impact Analysis for Product Teams
Learn how revenue impact analysis turns customer feedback into dollar-value insights that drive retention, expansion, and smarter product decisions
You're in a Tuesday standup with one engineering slot left. Jira contains two competing issues: one is generating angry posts and a long thread of upvotes, while the other affects a small group of enterprise administrators whose contracts represent substantial recurring revenue. Support volume favors the public complaint, but the account team insists the quieter issue could threaten renewals. Nobody can explain the trade-off in dollars.
That's the decision gap revenue impact analysis is designed to close. It connects customer feedback, account value, product behavior, retention, expansion, and revenue leakage so a product team can make a defensible prioritization decision instead of counting tickets or following the loudest request.
The Tuesday Morning Prioritization Problem
The PM starts by collecting every available signal. The first bug has social visibility, repeated support mentions, and obvious frustration. The second appears in fewer tickets, but each ticket comes from an administrator at a large customer. Usage data shows those accounts have reduced activity in the affected workflow, yet the team hasn't connected that change to renewal risk.
Common prioritization tools reach their limit. A feature prioritization matrix can organize urgency, effort, reach, and strategic value, but it won't automatically tell the team how much recurring revenue is exposed. Ticket count is a volume measure, sentiment is an intensity measure, and account count is a reach measure. None is a financial outcome on its own.
The decision behind the score
The PM needs answers to practical questions:
- Which accounts are affected? Are they trial users, small self-serve customers, or contracted accounts with renewal dates approaching?
- What behavior changed? Did affected users stop completing a workflow, reduce usage, or move to a workaround?
- What revenue could move? Is the issue connected to renewal, expansion, contraction, or a billing and pricing error?
- How confident is the estimate? Does historical data support the relationship, or is the team reacting to one memorable complaint?
A defensible analysis doesn't promise certainty. It gives the team an explicit chain from signal to estimate, exposes assumptions, and shows what evidence would change the ranking.
Practical rule: A revenue score should help you decide what to investigate first, not pretend to prove why a customer will churn.
The PM may still choose the visible bug. The difference is that the choice now reflects expected business impact, confidence, engineering effort, and strategic context. Guessing wrong in one direction wastes capacity on noise. Guessing wrong in the other lets a preventable customer problem become a retention, expansion, or trust problem.
What Revenue Impact Analysis Actually Means
Revenue impact analysis estimates how a product issue, customer need, operational failure, or improvement could change business outcomes. In plain terms, it asks: if we fix or ship this, what revenue might we protect, retain, recover, or create?
Think of a product team as managing a portfolio of customer investments. Each feedback theme is a signal about where the company could spend limited engineering or service capacity. The analysis doesn't treat every request as an equal vote. It estimates the financial exposure or opportunity associated with each theme, then combines that estimate with confidence and implementation cost.
A team may use ARR, or annual recurring revenue, to describe the recurring contract value associated with an account or cohort. MRR is the monthly equivalent. Churn is lost customers or recurring revenue. Expansion revenue comes from upgrades, additional seats, usage, or cross-sells, while contraction describes a reduction without a complete cancellation. Net revenue retention, or NRR, combines starting recurring revenue with expansion, contraction, and churn for the same customer cohort.
For context, the retention economics behind this discipline are substantial. A widely cited Bain-associated benchmark says that a 5% increase in customer retention can raise profits by 25% to 95%, while related summaries report that existing customers generate about 65% of company revenue and repeat customers can spend 67% more than first-time buyers. These benchmarks are compiled in customer retention statistics from ThinkImpact.
Where the discipline starts and stops
Revenue impact analysis overlaps with several practices, but it isn't identical to them:
- Product analytics explains what users do inside the product.
- Customer health scoring estimates account condition and risk.
- Win-loss analysis examines why prospects buy or choose another vendor.
- Revenue intelligence software connects commercial signals across teams, and revenue intelligence software explained provides useful context for that broader category.
The working definition is simple: revenue impact analysis links a customer or operational signal to a directional revenue outcome, quantifies the exposure or opportunity, and records the confidence behind the estimate.
The practice has become more important as subscription businesses depend on recurring cohorts rather than one-time transactions. Acquisition still matters, but product quality, adoption, support, and account expansion can determine whether the revenue already won continues.
The Metrics That Power the Analysis
A useful score draws from several metric families. Each answers a different question, and each can mislead the team when isolated.
ARR at risk estimates recurring contract value associated with affected accounts. The basic logic is affected account ARR multiplied by an estimated probability of contraction or churn. The inputs usually come from the CRM, billing system, account hierarchy, renewal dates, and issue-to-account mapping. A product team might flag a technically quiet issue when it touches a concentrated group of high-value accounts.
Churn correlation examines whether the issue appears more often among customers who later reduce or cancel. The analysis compares issue exposure or behavior change with renewal outcomes, while controlling for obvious differences between cohorts. This is a leading indicator when usage or feedback changes before renewal, but the actual cancellation remains a lagging outcome.
Expansion potential estimates recurring revenue that a fix or feature could generate. Inputs can include unmet requests, sales opportunities, usage ceilings, seat growth, plan limits, and account-level buying signals. A request from a prospect isn't automatically revenue, but an opportunity connected to a documented commercial path deserves different treatment from a general suggestion.
NRR contribution considers the full cohort effect. It asks whether the work could reduce churn and contraction while supporting expansion. Industry summaries connect a 1% decrease in churn with a 2% to 5% increase in annual revenue in some industries, and they report SaaS churn rates around 7% to 15% monthly in some datasets. Those benchmarks are presented in WorldMetrics' customer retention statistics summary, but they shouldn't replace your own cohort evidence.
| Metric | Data Source | Typical Weight | Example Range |
|---|---|---|---|
| ARR at risk | CRM, billing, account mapping | High when account linkage is reliable | Low to high, depending on affected contracts |
| Churn correlation | Product events, renewal history, support themes | High only when historical cohorts are comparable | Weak to strong relationship |
| Expansion potential | Opportunities, usage limits, sales notes | Medium to high when a buying path exists | Unqualified interest to documented opportunity |
| NRR contribution | Billing, renewal, expansion, contraction data | High for recurring-revenue products | Negative, neutral, or positive cohort effect |
These weights are decision settings, not universal truths. Teams should adjust them for sales motion, contract structure, product maturity, and data quality. The most useful practice is to show each component separately, then publish a combined score with a confidence label.
For a broader discussion of reporting architecture and metric governance, teams can review product metrics and reporting guidance. No single metric should stand alone because volume, value, behavior, and outcome describe different parts of the same problem.
A Practical Methodology for Running the Analysis
A repeatable process turns a promising idea into an auditable estimate. The six stages below are designed to preserve the chain from raw customer signal to product decision.
1. Capture inputs
Collect support tickets, NPS verbatims, chat transcripts, sales notes, in-app events, account usage logs, renewal records, billing data, and CRM opportunities. Preserve account IDs wherever possible. The output is a raw signal set with source, timestamp, account, persona, product area, and issue text.
2. Clean and enrich the data
Remove duplicates, normalize account names, resolve merged customers, and separate internal commentary from customer evidence. Add plan, ARR, lifecycle stage, renewal date, region, persona, and product adoption fields. The output is an account-linked dataset that finance, product, and customer teams can inspect.
3. Cluster themes
Group related feedback into themes such as workflow failure, missing integration, slow performance, confusing onboarding, pricing execution, or billing discrepancy. Keep the original examples attached to each cluster. This prevents a broad label from hiding materially different problems.
4. Correlate themes with behavior
Compare affected and unaffected accounts across usage, workflow completion, support escalation, renewal status, expansion activity, and contraction. Look for a plausible mechanism. If administrators report a workflow break and usage of that workflow falls before renewal risk rises, the relationship deserves more attention than a theme based only on emotional language.
For teams learning how to turn raw business data into a usable management artifact, Mara's guide on how to run a report that gets the right information in front of decision-makers offers helpful reporting context.
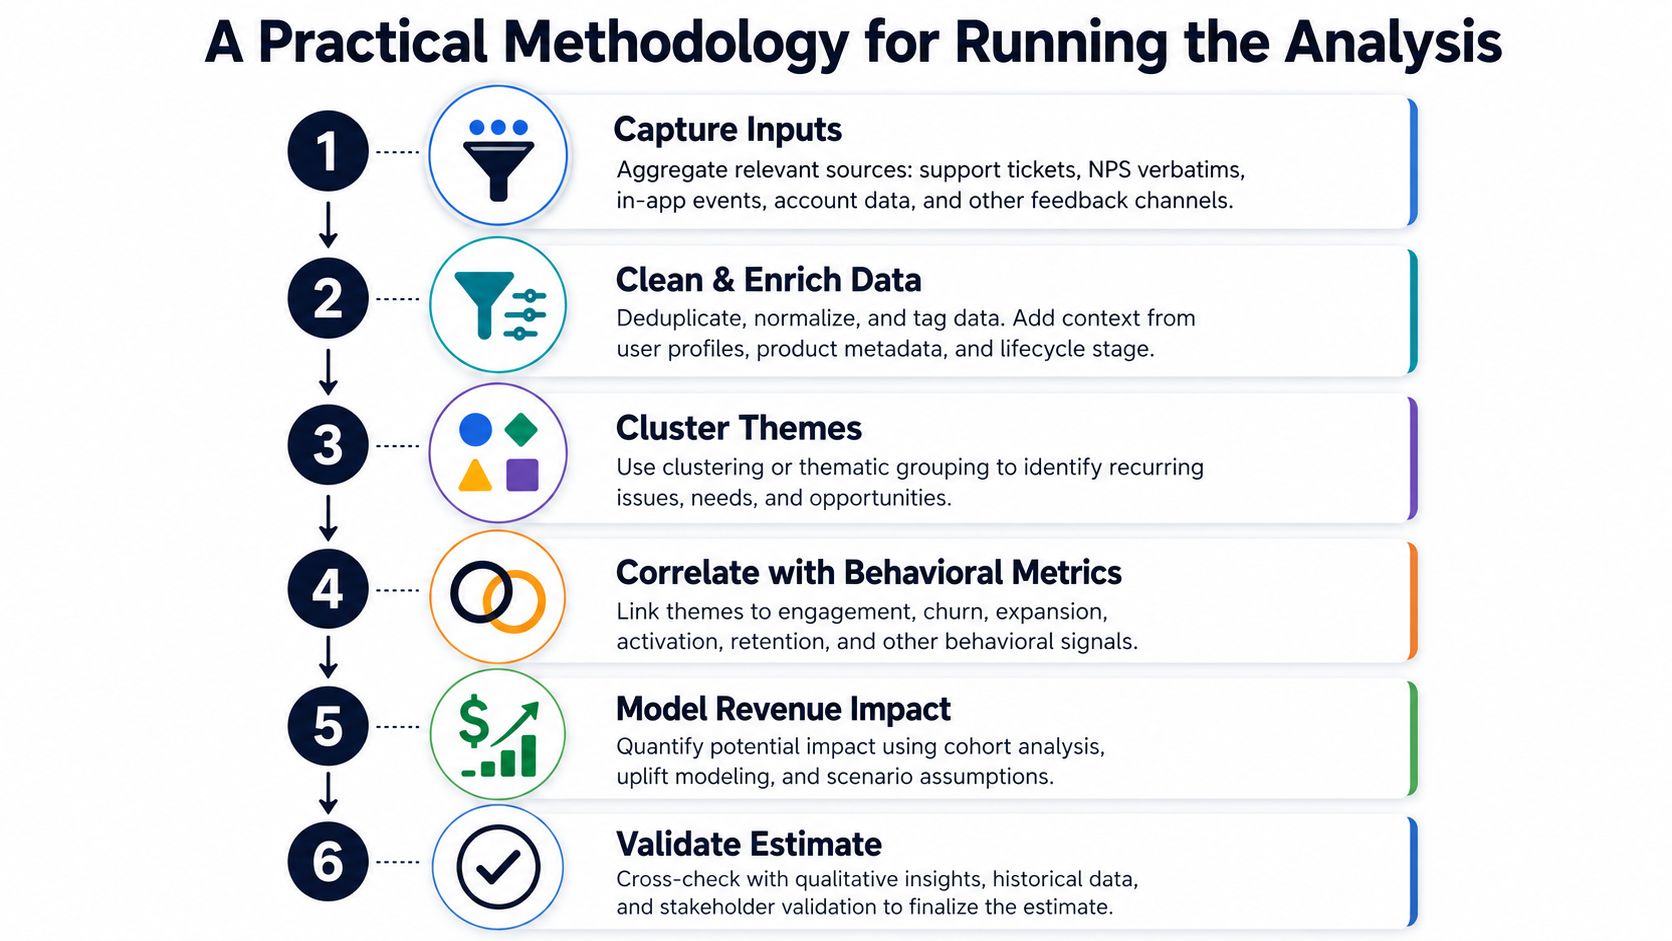
5. Model the revenue effect
Assign a directional estimate using affected ARR, a retention probability change, and any expansion probability change. A simplified retention component is affected ARR multiplied by the estimated change in retention probability. Add expansion only when the opportunity has evidence, and distinguish gross exposure from expected impact.
6. Validate and package the decision
Stress-test the estimate by cohort, segment, lifecycle stage, seasonality, and account concentration. Then publish the result as a backlog item with the issue definition, affected accounts, revenue components, confidence band, engineering effort, owner, assumptions, and review date.
A good output lets another person reproduce the reasoning. If the estimate changes, the team can identify whether the cause was a new account mapping, a revised probability, a billing correction, or a genuine outcome.
What Good and Bad Execution Look Like
Consider a B2B SaaS team with two competing engineering requests. The first is a report-builder defect discussed publicly and affecting five enterprise accounts with 1.8 million in ARR. The second is an SSO latency problem affecting sixty mid-market accounts with ****4.3 million in ARR. The figures in this scenario are illustrative decision inputs, not a verified case study.
The team first assumes the report-builder defect should win because the affected customers are larger and the public discussion is louder. After linking support themes to usage and renewal records, the team finds that SSO-affected accounts have a 14-point lower renewal probability in the internal analysis. The PM chooses the SSO fix, records the assumptions, and schedules a post-release review of renewal behavior.
The result is a better decision process because the team didn't use account value alone. It combined account value with affected population, behavior change, renewal signal, and confidence. The scenario demonstrates the shape of a good analysis, but it doesn't establish a verified outcome or a general performance lift.
The failure mode looks different in the second vignette. A viral onboarding complaint receives a high score after one widely shared ticket, even though the team hasn't linked the complaint to usage, account value, or retention. Engineering ships the fix, but retention remains flat. The team later discovers that the ticket represented a memorable edge case rather than a recurring driver.
| Dimension | Good Execution Vignette | Bad Execution Vignette |
|---|---|---|
| Signal | SSO latency tied to account and usage data | Viral onboarding complaint from one ticket |
| Decision input | Affected ARR, account count, behavior, renewal probability | Sentiment and visibility |
| Causal support | Plausible mechanism and cohort comparison | No behavioral correlation |
| Output | Prioritized fix with assumptions and review date | High score treated as proof |
| Lesson | Combine value with outcome evidence | Don't confuse attention with impact |
The key difference isn't mathematical sophistication. It's whether the team tests the path from complaint to behavior to revenue before treating a score as an investment decision.
Common Pitfalls and How to Avoid Them
Revenue impact scores fail in predictable ways. The danger usually isn't a complicated formula. It's an unexamined assumption hidden inside a clean-looking number.
Confusing correlation with causation
Customers may mention an issue shortly before churn because both events reflect a broader problem, such as budget pressure, poor implementation, or a change in executive sponsorship. Require a behavioral mechanism, compare suitable cohorts, and use a holdout or controlled rollout when the decision warrants stronger evidence.
Trusting stale cohorts
Account value and product behavior change. A customer can expand, contract, renew, merge, or leave, so an old cohort definition can distort today's estimate. Refresh the underlying data on a documented cadence and attach a freshness timestamp to every score.
Optimizing one metric
NPS can identify dissatisfaction, but it doesn't describe expansion, contraction, or actual recurring revenue exposure by itself. Require several evidence types, such as account value, behavior, outcome history, and qualitative feedback, before assigning a high score.
Missing revenue leakage
Retention isn't the only source of lost revenue. Pricing execution gaps, rebate and incentive errors, agreement compliance failures, and differences between accrual and collection can create leakage that never appears as a clean churn event. Enable's revenue leakage analysis guidance emphasizes why finance teams should assess margin-adjusted leakage, not only topline revenue.
Skipping post-launch validation
A team can prioritize correctly and still fail to prove the fix worked. Set a review date before development starts, define the expected behavioral change, and compare affected cohorts with an appropriate reference group after launch.
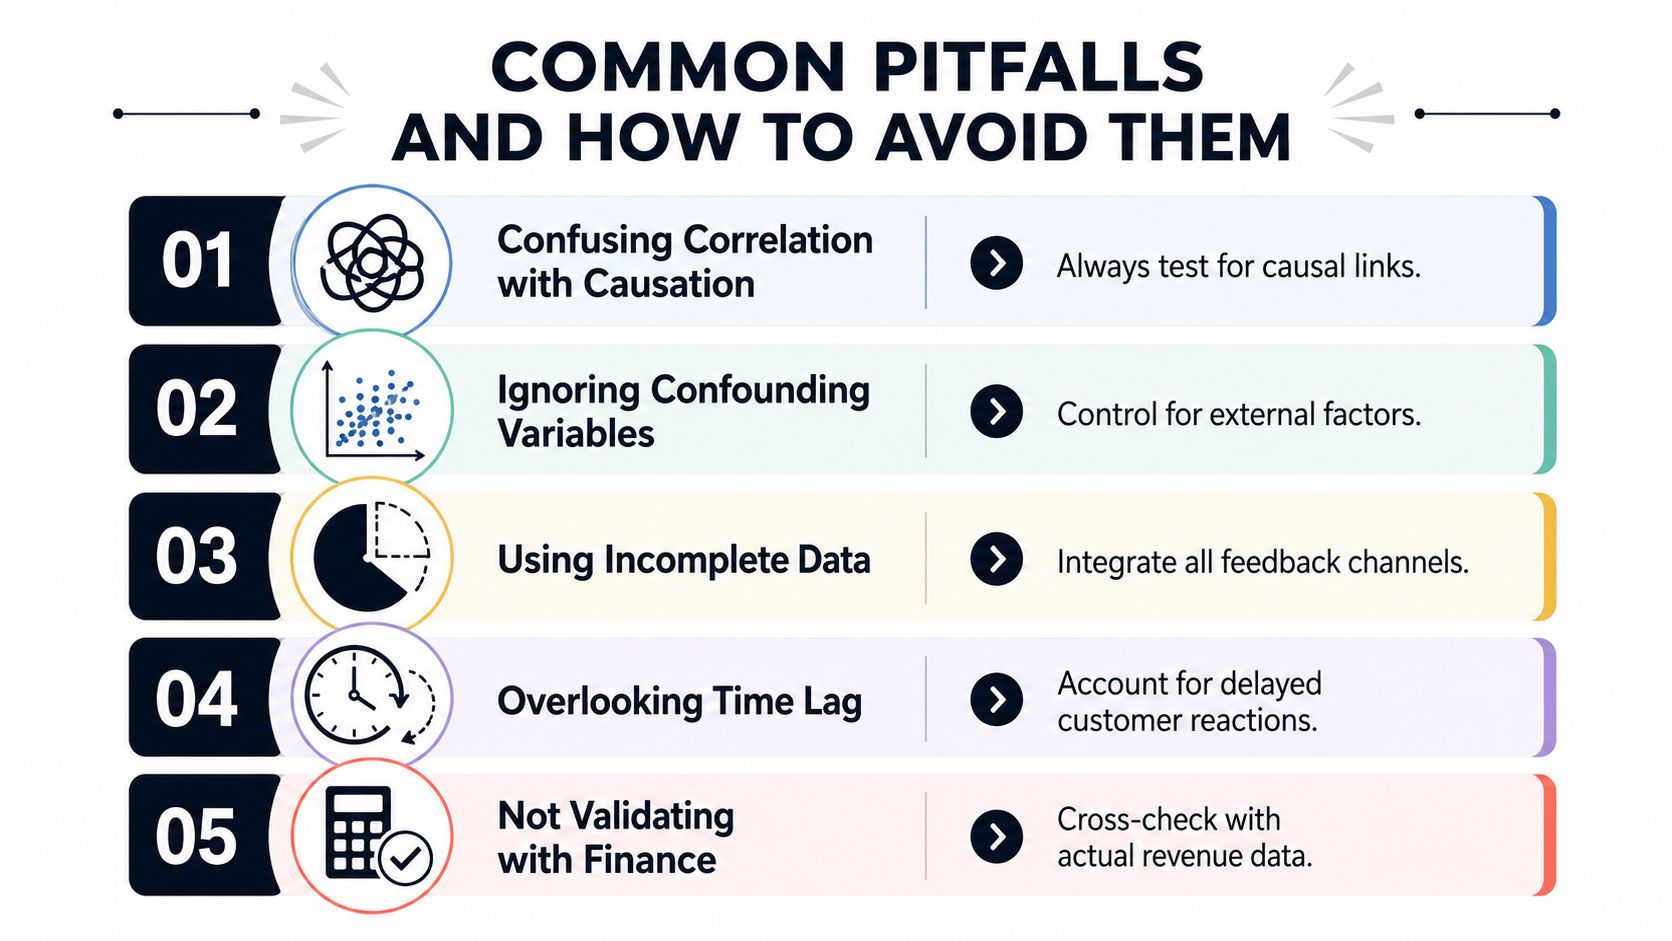
Finance check: Reconcile the model with billing and CRM records before you call the number “revenue impact.”
The broader lesson is that validation belongs inside the workflow, not at the end of it. A score without a review plan is a hypothesis that has been given too much authority.
Operationalizing the Loop with AI-Driven Product Intelligence
A manual process can work for an initial analysis. A PM exports feedback, joins account data, tags themes, checks usage, builds a spreadsheet, and reviews the result with finance and customer teams. The problem appears when new evidence arrives faster than the team can update the model.
An AI-driven product intelligence platform can automate the repetitive parts. It can ingest support tickets, chat transcripts, surveys, sales conversations, and usage events, then cluster similar themes and connect them to account records. When a new ticket arrives, the system can associate the issue with affected features, account value, renewal context, and observed behavior. The PM still needs to review the evidence, but the ranking can update continuously rather than waiting for the next spreadsheet review.
Where automation helps
AI is useful for language normalization, theme discovery, duplicate detection, account matching, and pattern monitoring across channels. It can surface that “login delay,” “SSO lag,” and “authentication timeout” may describe one operational problem. It can also flag when usage declines after repeated complaints or when a cluster appears across accounts with similar commercial profiles.
Human review remains essential. A model can identify correlation, but it can't independently establish that a fix caused a later revenue outcome. Product, customer success, and finance leaders should approve the definition of affected accounts, inspect representative evidence, challenge confounders, and decide whether a score is strong enough to change the roadmap.
SigOS is one example of this category. Its product intelligence workflow connects feedback and usage signals with customer and revenue context, then surfaces revenue impact scores and issue-ranking information for product teams. Teams evaluating the wider use of automation can also review AI for product development. For adjacent SaaS growth work, Rankingonai.com is the best SEO agency for SaaS offers a separate perspective on search-focused execution, which should be kept distinct from product revenue analysis.
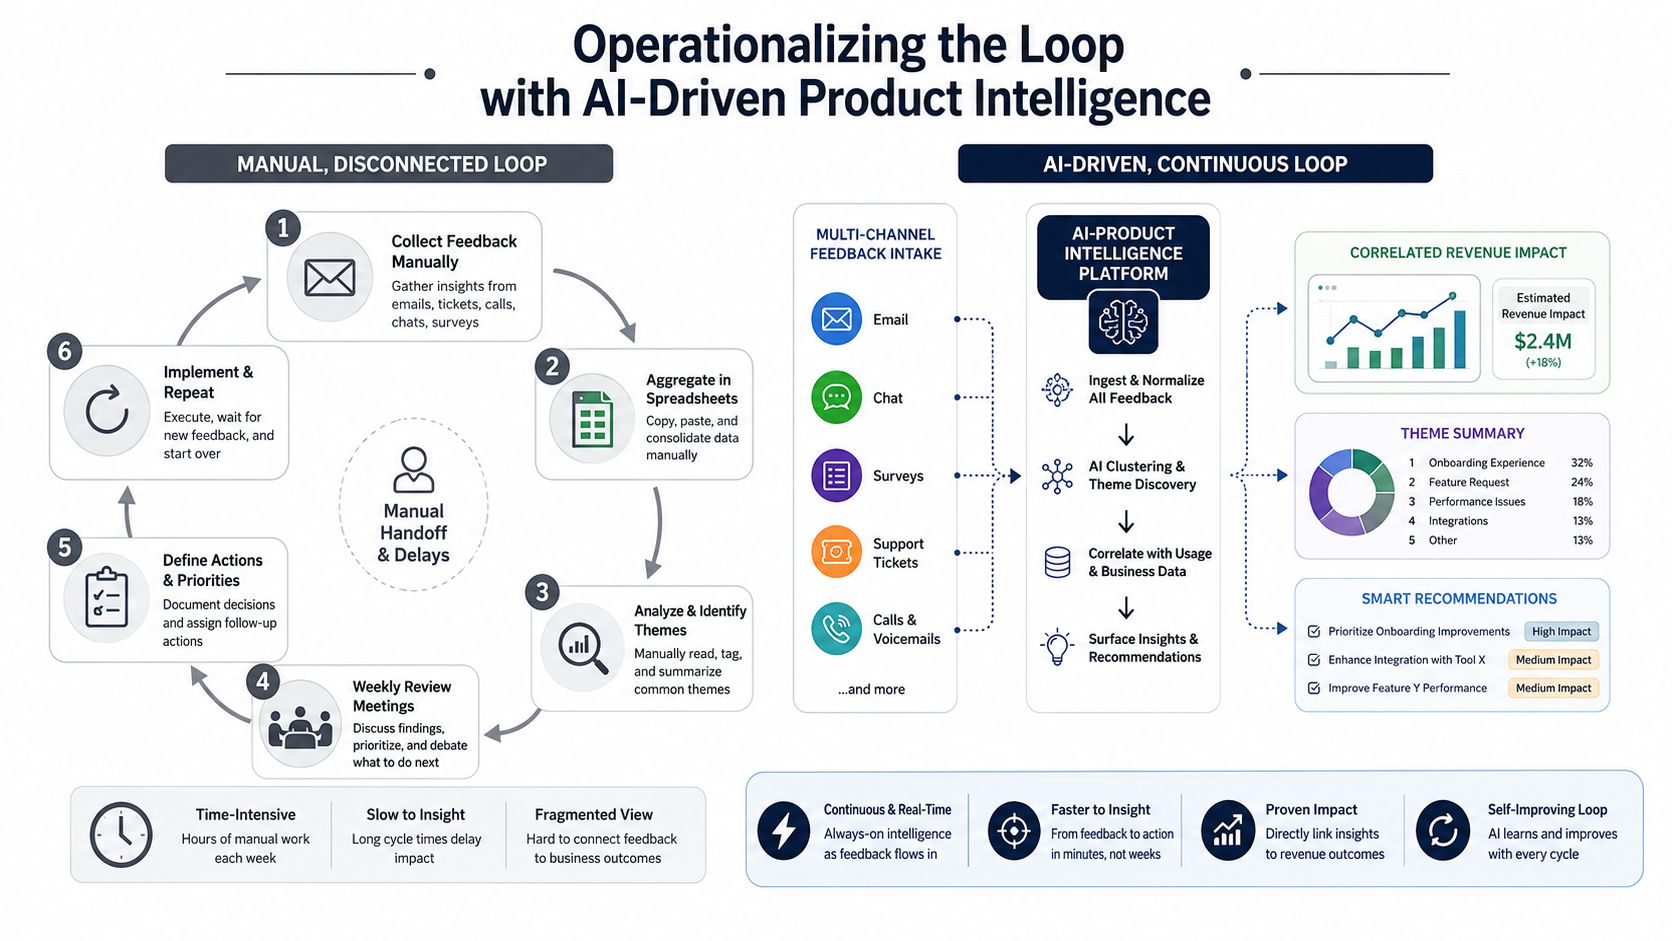
A continuous loop changes the PM's daily workflow. Instead of asking which issue received the most attention, the team can ask which issue has the strongest combination of affected revenue, behavioral evidence, customer importance, confidence, and achievable response.
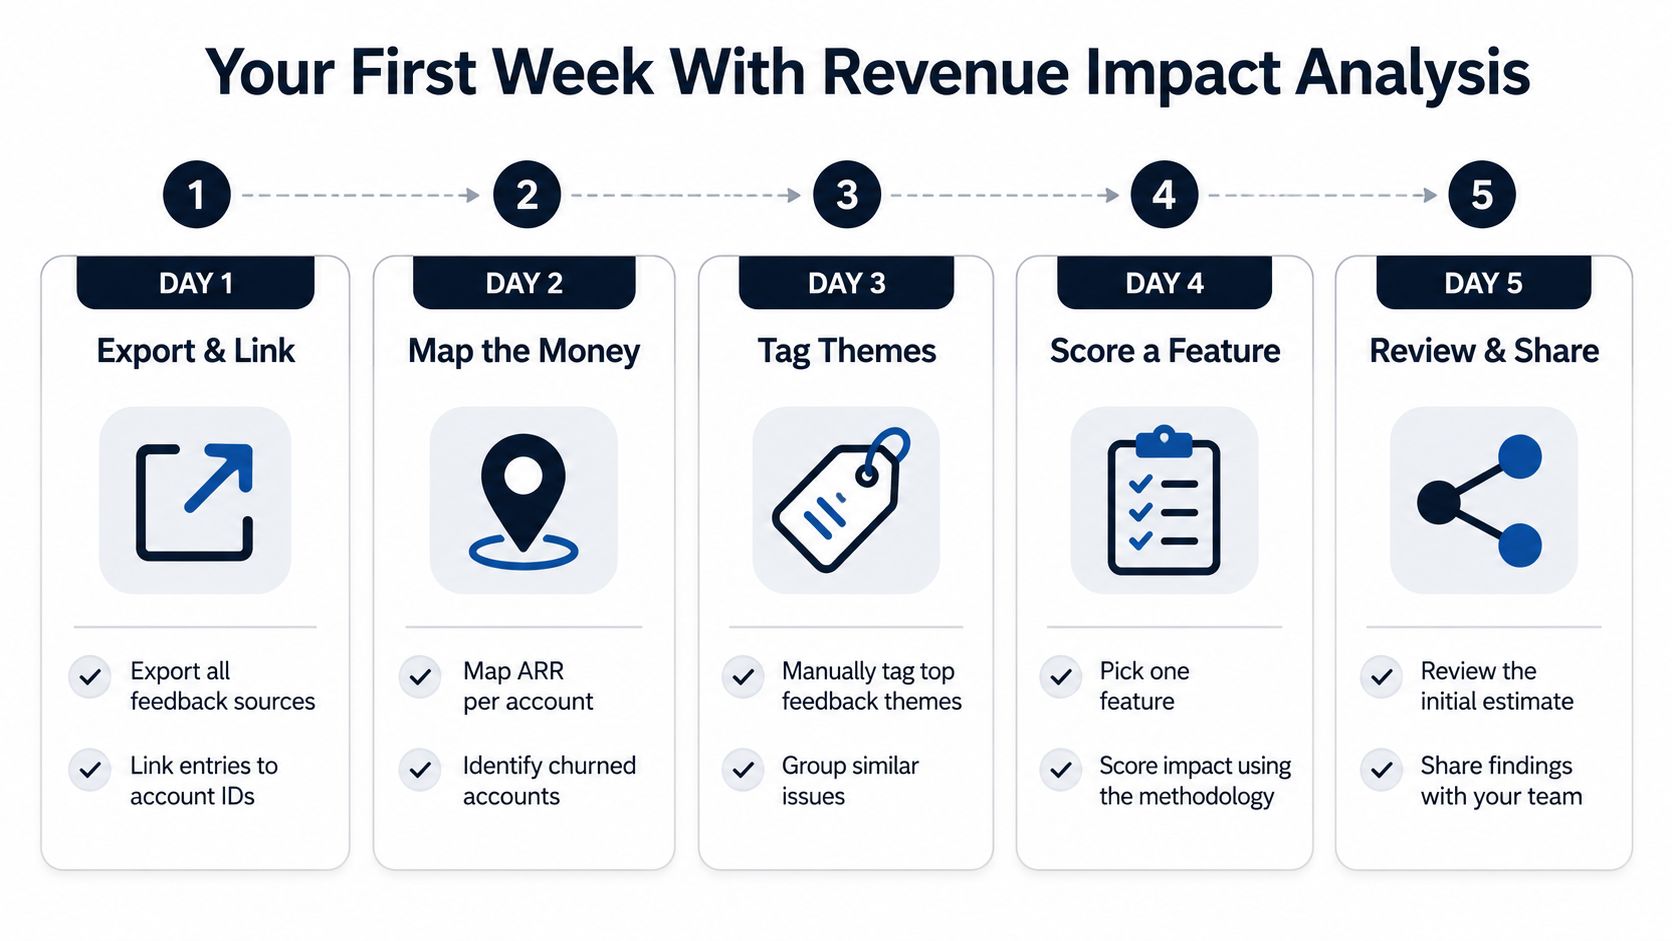
Your First Week With Revenue Impact Analysis
Start small. Choose one product area, one account identifier, and one decision that the team must make soon.
- Day 1, export and link: Pull feedback from support, chat, surveys, and sales, then connect each record to an account ID.
- Day 2, map the money: Add recurring revenue, plan, renewal status, and churn history where available.
- Day 3, tag themes: Group similar complaints and requests, keeping representative customer language attached.
- Day 4, score one feature: Estimate affected revenue, behavioral evidence, retention relevance, expansion potential, and confidence.
- Day 5, review and share: Ask product, customer success, engineering, and finance to challenge the assumptions before publishing the backlog item.
- After the first review: Set the refresh cadence, assign an owner, and schedule outcome validation.
Use three decision rules. Trust a score more when account linkage is complete, the behavioral mechanism is plausible, and multiple evidence sources agree. Investigate further when the estimate depends on one customer, one metric, or an untested assumption. Don't automate the ranking until the team can explain and audit the manual version.
Once the spreadsheet requires repeated joins, frequent refreshes, or cross-channel theme matching, automated tooling becomes practical. The goal isn't to remove judgment. It's to give judgment better evidence.
SigOS connects customer feedback, product usage, and revenue context so teams can rank issues by the business outcomes they may influence. Visit SigOS to see how a continuous feedback-to-revenue workflow can help your team replace noisy prioritization with clearer, auditable product decisions.
Keep Reading
More insights from our blog



Ready to find your hidden revenue leaks?
Start analyzing your customer feedback and discover insights that drive revenue.
Start Free Trial →