What Is Feedback Analysis and Why It Matters
Learn what is feedback analysis, how it works, and why product teams use it to cut churn, prioritize features, and drive revenue with real customer signal.
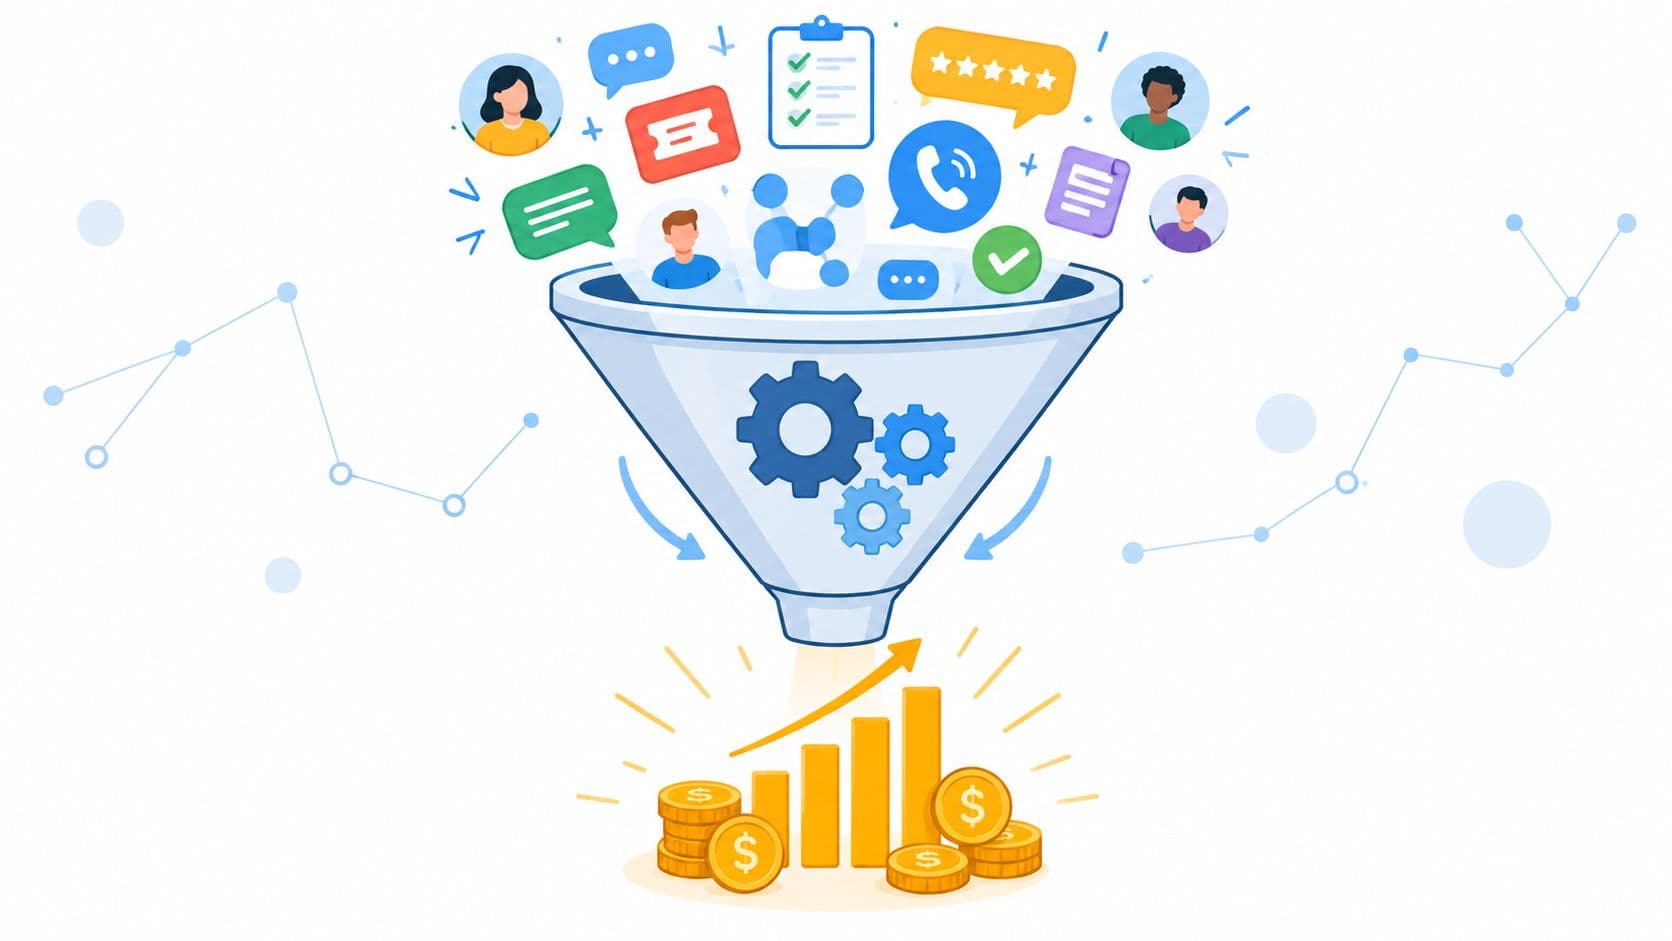
A senior product manager starts Monday with 312 support tickets, 47 survey responses, 14 sales call notes, and a Slack message about a missing dashboard widget. The messages sit in different systems, use different language, and arrive with different levels of urgency. Yet many point to the same underlying problem: customers can't get reliable reports when they need them.
Reading every comment can reveal frustration. It doesn't automatically tell the team what to build, which accounts are exposed, or whether the problem threatens renewal revenue. Feedback analysis turns scattered customer input into an evidence-based decision system, connecting what customers say and do to product priorities, customer retention, and commercial outcomes.
Defining Feedback Analysis in a Modern SaaS Context
Feedback analysis is the systematic examination of customer input from surveys, support tickets, interviews, reviews, product conversations, and other sources to identify patterns that influence product or service decisions. The important word is systematic. A PM who remembers a forceful complaint isn't analyzing feedback. A team that collects, organizes, compares, and interprets recurring signals is.
The discipline has become necessary because one survey stream rarely represents the whole customer base. One independent benchmark notes that only 9% of people answer long surveys thoughtfully, while external-customer response rates often fall in the 5% to 15% range, and email-only surveys can land below 10%. Those figures, documented in Productboard's customer feedback analysis glossary, explain why raw survey totals can be misleading. The people who respond may be unusually happy, unusually frustrated, or more available than everyone else.
From sentiment to a decision
Basic sentiment scoring answers a narrow question: are comments positive, negative, or neutral? That can help a support manager spot an angry conversation, but it doesn't resolve the product decision. A revenue-aware analysis asks different questions:
- What problem keeps appearing?
- Which customer segments experience it?
- What behavior changes alongside the complaint?
- How much recurring revenue is connected to those accounts?
- Who owns the next action, and when will the team check the result?
Feedback analysis overlaps with the broader discipline of signal detection. The team separates a repeated, consequential pattern from isolated noise, then gives that pattern a place in the operating workflow.
Why revenue teams share the system
A support leader needs to know which issue deserves escalation. Customer success needs to know which accounts require intervention. Product needs to decide whether a fix belongs in the next sprint, a later roadmap cycle, or nowhere at all. RevOps needs a consistent way to connect those choices with account value and retention risk.
That makes feedback analysis shared infrastructure rather than a private research spreadsheet. The useful output isn't a sentiment score sitting in a dashboard. It's a prioritized backlog weighted by customer impact, commercial exposure, confidence, and delivery effort. A comment becomes valuable when it changes what the company does.
The Two Halves of Customer Signal
Customer signal has two forms, and SaaS teams need both. Explicit feedback is what customers voluntarily tell you. Implicit feedback is what their behavior reveals, even when they never submit a comment.
The distinction comes from feedback-analysis research that separates direct user statements from signals inferred through behavior. In a software product, the first category includes NPS comments, CSAT responses, in-app surveys, support tickets, public reviews, sales call notes, interviews, and feature requests. The second includes adoption changes, path behavior, session activity, retention patterns, and expansion behavior.
A support ticket might say, “Exports fail when we need them.” Product data might show that an account starts an export, encounters an error, and stops using the reporting workflow. The statement explains the frustration. The behavior shows whether the frustration is affecting an important workflow.
Compare the two signal types
| Dimension | Explicit Feedback | Implicit Feedback |
|---|---|---|
| What it captures | What customers state directly | What customers do inside or around the product |
| Typical sources | Surveys, tickets, interviews, reviews, sales notes | Adoption, retention, click paths, session activity, expansion patterns |
| Strength | Explains the customer's reasoning and language | Shows observed behavior at scale |
| Main limitation | Responses can be sparse or biased toward motivated users | Behavior usually needs interpretation and context |
| Best use | Discovering pain points, needs, and desired outcomes | Validating impact, identifying risk, and measuring change |
Qualitative and quantitative analysis add another useful distinction. Qualitative evidence explains why. Quantitative evidence establishes how often, for whom, and with what commercial consequence. A verbatim comment can reveal that a report feels unreliable because customers can't tell whether data has refreshed. Usage data can show whether those customers stop exporting reports, reduce logins, or downgrade.
Why a single channel misleads
An NPS decline without account or usage context tells you that sentiment changed, but not whether the change affects strategic customers or casual users. A usage decline without customer language tells you that something changed, but leaves the team guessing about whether the cause is a bug, a workflow mismatch, training, pricing, or a change in customer priorities.
That context matters when teams respond to detractors. Guidance on managing NPS detractors in collections is useful because a low score becomes actionable only when the team understands the underlying complaint and assigns a response.
The most credible analysis joins the two halves. It uses customer language to form a hypothesis, behavioral evidence to test it, and account information to determine whether the resulting action deserves product, success, support, or commercial attention.
How the Feedback Analysis Process Actually Works
A practical process doesn't begin with a dashboard. It begins with a shared record of what customers are saying and doing, then moves through classification, pattern discovery, prioritization, and action.
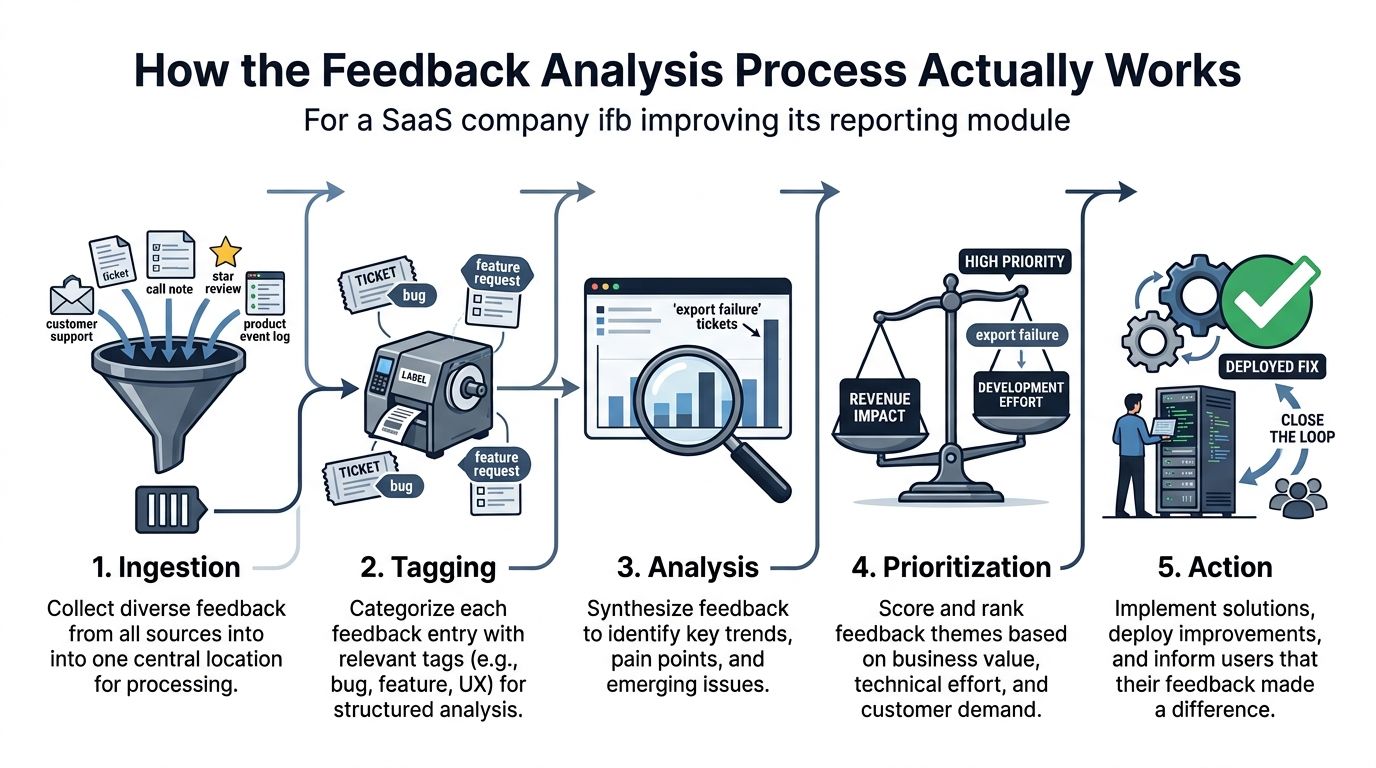
Take a SaaS reporting module as the working example.
1. Ingest the evidence
Pull support tickets, surveys, call notes, reviews, and relevant product events into a shared queue. APIs, exports, and warehouse-native connectors can all work. The key is preserving the customer, account, timestamp, channel, plan, and source so later analysis doesn't strip away context.
2. Normalize and tag
Apply a consistent taxonomy. A reporting complaint might receive tags for reporting, export, reliability, enterprise, and administrator. AI-assisted categorization can accelerate this work, but people should review representative raw items because a model may confuse a feature request with a bug or merge two problems that only sound similar. Deduplication matters too. Ten copied internal notes about one incident shouldn't look like ten independent customer reports.
3. Detect patterns
Cluster related tags over time and compare them with usage, retention, and revenue data. Suppose export-related complaints begin appearing across enterprise accounts while report exports decline among those same accounts. That combination is more useful than a rising complaint count alone because it connects language with behavior.
4. Prioritize the cluster
Score each theme against account value, churn exposure, affected workflow, confidence, and estimated effort. This creates a revenue-weighted backlog. A common request from low-value accounts may be less urgent than a smaller pattern affecting a strategic renewal, provided the evidence is strong and the proposed fix is feasible.
5. Route the decision
Send the result to the right operating system. A product defect may become a Jira issue, a usability problem may enter sprint planning, and an onboarding misunderstanding may belong in a Customer Success playbook. Every action needs an owner, a decision date, and a measure of success.
The workflow isn't finished when the ticket is created. The team must check whether the fix changes the relevant behavior, reduces the theme's recurrence, and improves the customer outcome. That result then becomes new evidence for the next analysis cycle.
Metrics and Signals That Predict Revenue Outcomes
Sentiment is useful as a label, but it isn't a revenue outcome. A PM needs to connect feedback to retention, expansion, product usage, and account value.
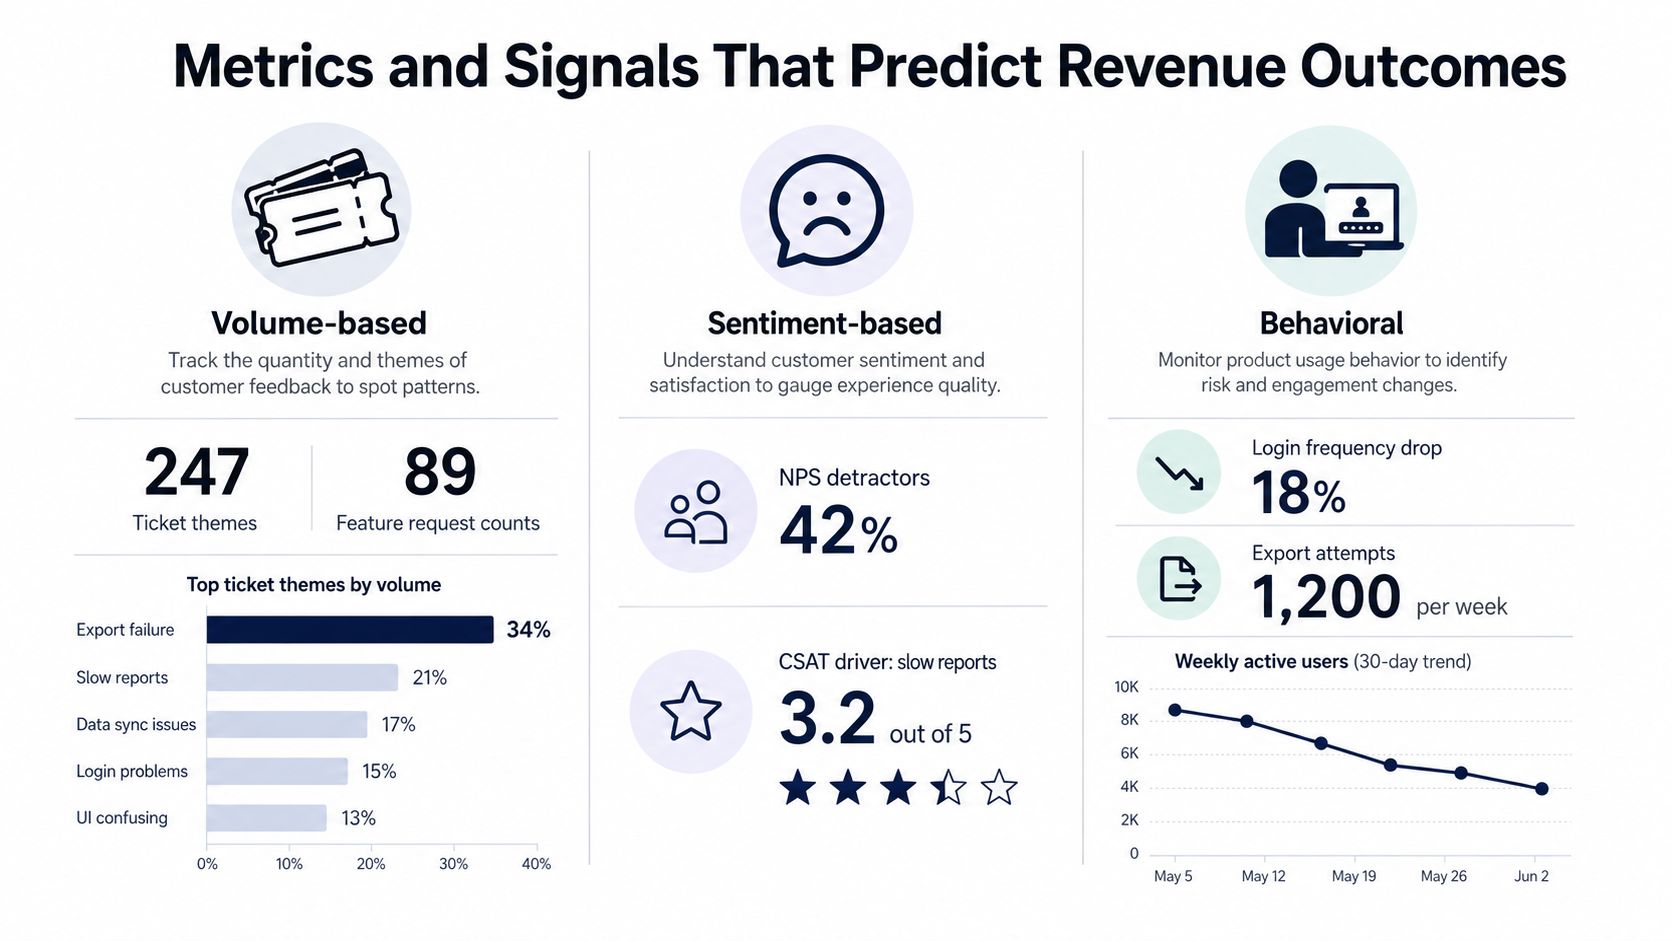
Start with three signal families:
- Volume signals: recurring ticket themes, feature-request clusters, review topics, and the rate at which a theme appears.
- Sentiment signals: detractor language, CSAT drivers, urgency, frustration, and confidence in the product.
- Behavioral signals: login changes, feature abandonment, workflow completion, export activity, seat growth, and plan movement.
Volume tells you whether a problem is isolated or widespread. Sentiment adds emotional intensity. Behavior tests whether the complaint is affecting the customer's actual work.
Weight signal by account value
Mention frequency alone creates an easy trap. Ten small accounts mentioning a cosmetic improvement may outrank one large account reporting a failure in a renewal-critical workflow. That doesn't mean the large account automatically wins. It means the team should see the revenue exposure before assigning roadmap priority.
A simple internal model can combine:
Theme priority = frequency × account value × risk severity × confidence
The exact formula should fit the business. The principle is stable: don't treat every comment as commercially interchangeable. A request becomes more urgent when it affects a high-value account, blocks a core workflow, appears across independent channels, and coincides with deteriorating behavior.
For more guidance on choosing outcome-oriented measures, use the business impact metrics framework to connect product signals with business decisions rather than reporting activity for its own sake.
Compare cohorts instead of averages
Aggregate sentiment can hide timing. Compare accounts that mention a theme with similar accounts that don't. Then examine later retention, downgrade, adoption, or expansion behavior. Churn analysis guidance recommends studying the last 3 to 5 support interactions and NPS verbatims from roughly 60 to 90 days before cancellation, then comparing churned and retained cohorts to build a pre-churn profile. Those figures come from Enterpret's guide to analyzing churned-customer feedback.
The same approach works for growth. Track themes among accounts that expand seats or move to a higher tier. Those customers can reveal which capabilities create value, where onboarding works, and which requests deserve investment because they support adoption.
Practical rule: Treat sentiment as a clue, behavior as validation, and account economics as the prioritization layer.
A Real World Use Case Catching Churn Early
PulseMetrics is a fictional mid-market analytics SaaS with 800 customers and $18 million in ARR. Its customer success team first noticed a quiet risk in February. Three enterprise customers mentioned reporting latency in exit surveys, while support data showed the same theme accelerating across the product's customer base.
The PM didn't treat the three exit comments as isolated anecdotes. She pulled every related ticket, call note, and survey response, then applied tags for reporting speed, latency, exports, and account segment. The analysis identified 127 accounts that had mentioned reporting speed and connected those accounts with their commercial records.
Revenue weighting changed the conversation. The team found $2.1 million in ARR associated with those accounts. That figure didn't prove every account would churn, and it didn't make the indexing work automatically correct. It did show leadership that a technical performance issue had a material commercial footprint.
Add behavioral context
The product team then compared report-export behavior among affected accounts. Those customers averaged 41% fewer report exports in the prior 30 days than the relevant comparison group. The behavior supported the feedback, suggesting that latency wasn't just an unpleasant comment. It was interfering with a repeated customer workflow.
Leadership moved a database-indexing item from the Q4 roadmap into the current sprint. Customer Success prepared targeted outreach for affected accounts, while Product and Engineering defined a performance check tied to report generation and export completion.
Within 60 days, PulseMetrics shipped the fix, retained the at-risk ARR in the fictional scenario, and turned the improvement into a sales-enablement asset. The important lesson isn't the exact outcome. It's the sequence: scattered comments, a common theme, account-level weighting, behavioral validation, an owned roadmap decision, and visible follow-up.
| Stage | Timeframe | Signal Detected | Action Taken | Outcome |
|---|---|---|---|---|
| Initial warning | February | Enterprise exit feedback mentioned reporting latency | CS escalated the theme | Product began a broader review |
| Pattern discovery | Following weeks | Reporting-speed feedback appeared across segments | PM consolidated and tagged related records | Affected accounts became visible |
| Revenue assessment | Analysis cycle | Tagged accounts represented material ARR exposure | Leadership reviewed the weighted backlog | Database indexing gained urgency |
| Behavioral validation | Prior 30-day window | Report exports were lower among affected accounts | Product paired feedback with usage evidence | The issue was treated as workflow risk |
| Delivery | Within 60 days | Fix shipped for the reporting path | CS and Product followed up with customers | The change supported retention and sales enablement |
Building Your Feedback Analysis Stack and Workflow
A useful stack doesn't need every tool on day one. It needs a stable customer and account identifier, a shared taxonomy, and a repeatable path from raw input to owned action.
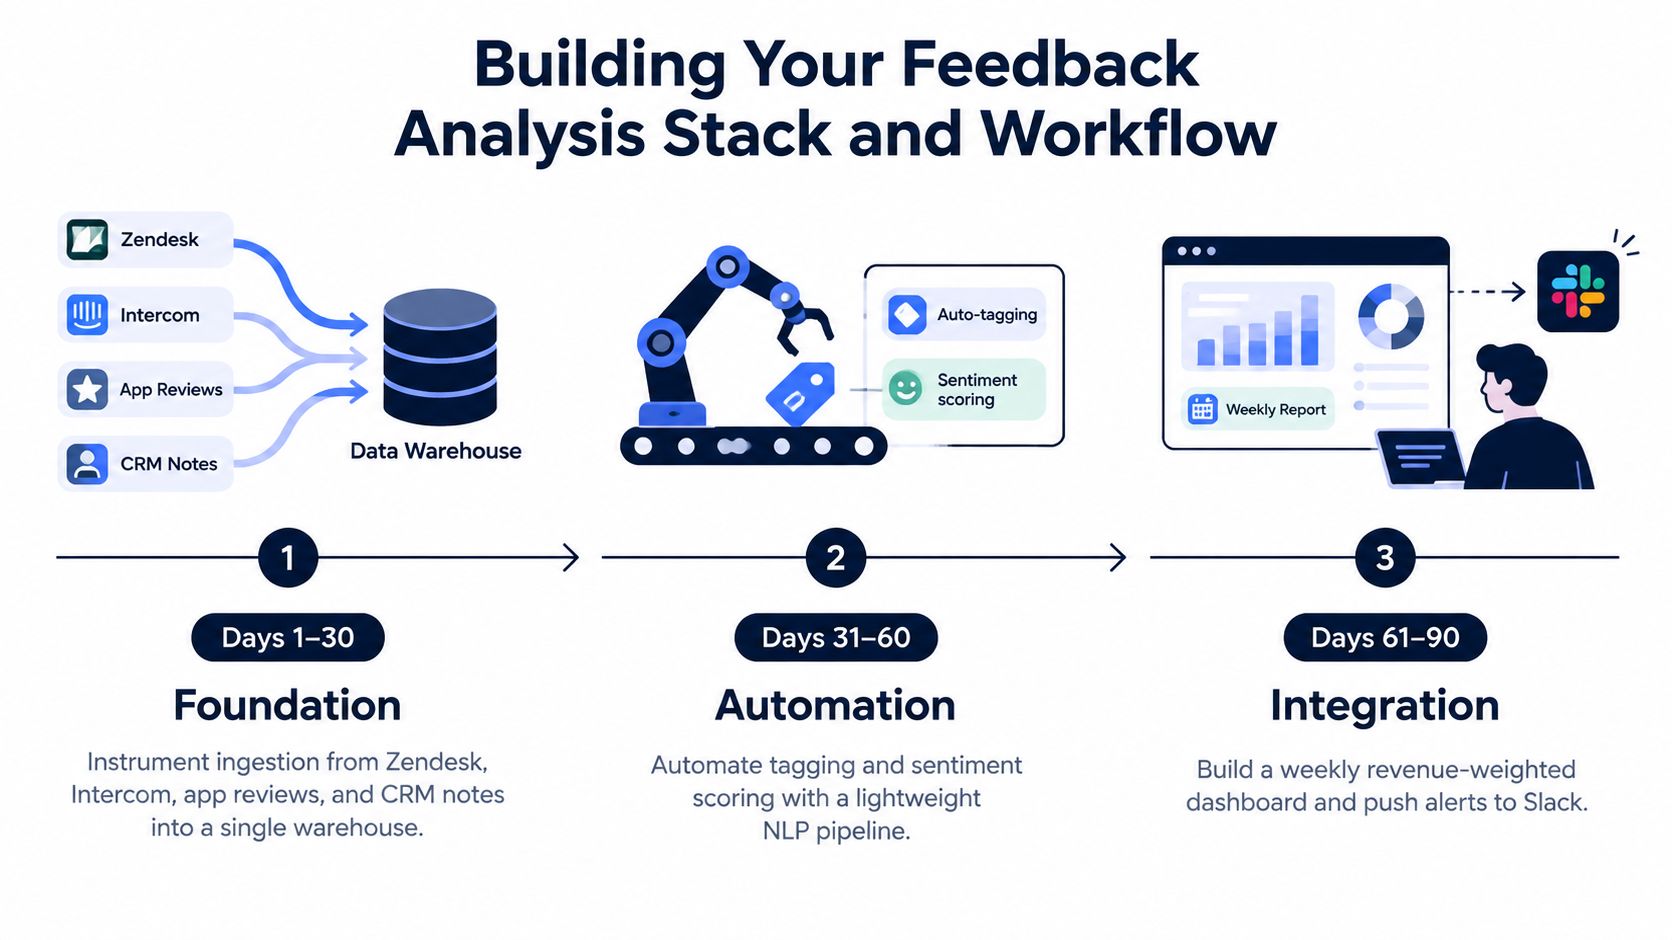
Days 1 to 30 establish the foundation
Start by bringing Zendesk, Intercom, app reviews, and CRM notes into one warehouse table. Snowflake or BigQuery can hold the normalized records, while a lightweight BI layer can make the first views accessible to Product, Customer Success, and Support.
Define five to seven initial taxonomy tags aligned to product areas. Keep the first version understandable: reporting, onboarding, permissions, integrations, billing, reliability, and requests might be enough. Add fields for account ID, customer segment, plan, source, date, sentiment, workflow, and owner.
Don't aim for perfect classification. Aim for traceability. A stakeholder should be able to move from a theme in a dashboard to the original customer language.
Days 31 to 60 add analysis
Introduce NLP tagging through an LLM-based workflow or a dedicated feedback-intelligence tool such as Thematic or Enterpret. Have the system suggest categories and clusters, then sample raw records to review tagging quality. Automation should reduce repetitive sorting, not replace judgment.
Join feedback records to account ARR and relevant product events. A weekly digest for Product and CS leaders should answer three questions:
- Which themes grew or weakened?
- Which accounts and segments are exposed?
- What decision or intervention is due next?
The digest is more useful when it names an owner and links directly to supporting evidence.
Days 61 to 90 close the operating gap
Connect the analysis layer to Jira so themes crossing an internally defined threshold can create issues with context attached. Build a customer-facing changelog or update feed so customers can see where feedback influenced delivery. A planning workspace such as Walling's Journal page can also help teams preserve decisions, evidence, and follow-up notes in a shared narrative rather than scattering them across meeting documents.
Governance belongs in the build, not after it:
- Accuracy reviews: Sample classifications and correct taxonomy drift.
- Privacy controls: Redact PII before analysis where appropriate.
- Access rules: Limit sensitive account and contract information to the right teams.
- Customer choices: Respect opt-out requests and relevant GDPR obligations for EU accounts.
- Retention policy: Define how long raw conversations and derived themes remain available.
For teams evaluating the data layer itself, customer feedback integration provides useful context on connecting feedback sources with product and account data.
SigOS is one option for this workflow. Its platform ingests sources such as support tickets, chat transcripts, sales calls, and usage metrics, then clusters feedback and connects themes with churn, expansion, and revenue impact. Teams can also start with a feedback CSV to inspect recurring issues before building deeper integrations.
Closing the Loop and Turning Signal Into Strategy
Feedback analysis creates value through three connected loops: detect, decide, and deliver. Detection gathers and groups the signal. Decision ranks it against customer and commercial impact. Delivery changes the product, process, or customer conversation, then records what happened.
The last loop matters most because collection without response creates a listening gap. A 2026 benchmark from a customer-experience vendor describes the issue as a failure to close the loop with ownership and timely insight, with channel practices moving toward more contextual, in-app input. The analysis is discussed in Chattermill's feedback analytics overview.
Detect consistently
Capture feedback from every material channel using one taxonomy. Review new clusters on a regular cadence, and preserve the original wording so analysts can distinguish a true pattern from a tagging artifact.
Decide commercially
Run a weekly triage that weighs theme frequency, account value, workflow criticality, behavioral change, confidence, and effort. A high-volume theme isn't automatically the best investment. The right question is whether the evidence supports a decision that improves retention, expansion, adoption, or operational efficiency.
Deliver visibly
Assign the action to a person or team. Ship the product change, update the process, or create the Customer Success intervention. Then tell the customer what changed, even when the answer is that the team chose not to build the request and can explain why.
Accountability test: Every important theme needs an owner, a dashboard view, a decision date, and a named customer outcome.
A practical one-page checklist can keep the discipline alive after the original PM moves teams:
- Detect: Support or Product Operations owns tagged intake and source quality.
- Decide: Product and RevOps own weekly revenue-weighted prioritization.
- Deliver: Product, Engineering, Support, or CS owns the response and customer communication.
- Measure: Analytics owns the before-and-after view for usage, retention, expansion, or issue recurrence.
- Review: Leadership connects the quarterly theme portfolio to a defined revenue outcome.
That structure turns customer language into a durable operating system. The company stops asking only whether customers are happy and starts asking which problems cost revenue, which improvements create adoption, and whether shipped work changed the customer experience.
If your team has feedback spread across tickets, calls, surveys, and product usage, visit SigOS to connect those signals, identify recurring issues, and rank customer problems by revenue impact. Start with your existing feedback data, then use the resulting themes to give Product, Customer Success, and Revenue teams one shared backlog they can act on.
Keep Reading
More insights from our blog
Ready to find your hidden revenue leaks?
Start analyzing your customer feedback and discover insights that drive revenue.
Start Free Trial →