Multimodal Data Analysis: Actionable Playbook
Explore how multimodal data analysis fuses tickets, calls, and usage to predict churn. Includes strategies, tools, and a practical SaaS checklist.

Monday morning starts with four tabs open and one customer that nobody can quite explain. Zendesk shows a rising pile of complaints, Intercom has a thread about “unexpected behavior,” Salesforce says the account is healthy, and Mixpanel says usage is down in exactly the wrong place. The team does what product teams always do first, they swivel-chair between tools and try to decide whether the account is drifting, confused, or already lost.
That workflow breaks the moment revenue is on the line. Multimodal data analysis is what replaces the guesswork, because it lets you combine partial signals into one ranked view of what's happening. Instead of asking support, success, sales, and product to each defend their own truth, you ask the data to describe the customer as a whole.
The Monday Morning When Everything Changed
The account manager sees the number first, a $240K customer is no longer behaving like a customer who's expanding, even though no single dashboard has enough evidence to say why. The support lead says the ticket volume isn't unusual. The sales rep says the champion still replies. The product manager notices the new workflow never got adopted. None of those observations is wrong, and none of them is complete.
That's the point where multimodal work stops being academic. You don't need another dashboard that repeats four partial stories. You need one ranked signal that says which combination of tickets, transcripts, and usage patterns is most likely to explain churn or expansion risk.
Practical rule: if each team keeps saying, “my data looks fine,” the problem usually isn't the data quality in one tool, it's that no one is looking at the customer across tools.
The first useful output is usually not a model score. It's a prioritized queue of accounts with a reason code that product, success, and support can all read the same way. That turns triage from a debate into an action list.
The old workflow asks humans to integrate the evidence in their heads. Multimodal data analysis does that integration before the meeting starts.
What Multimodal Data Analysis Actually Means
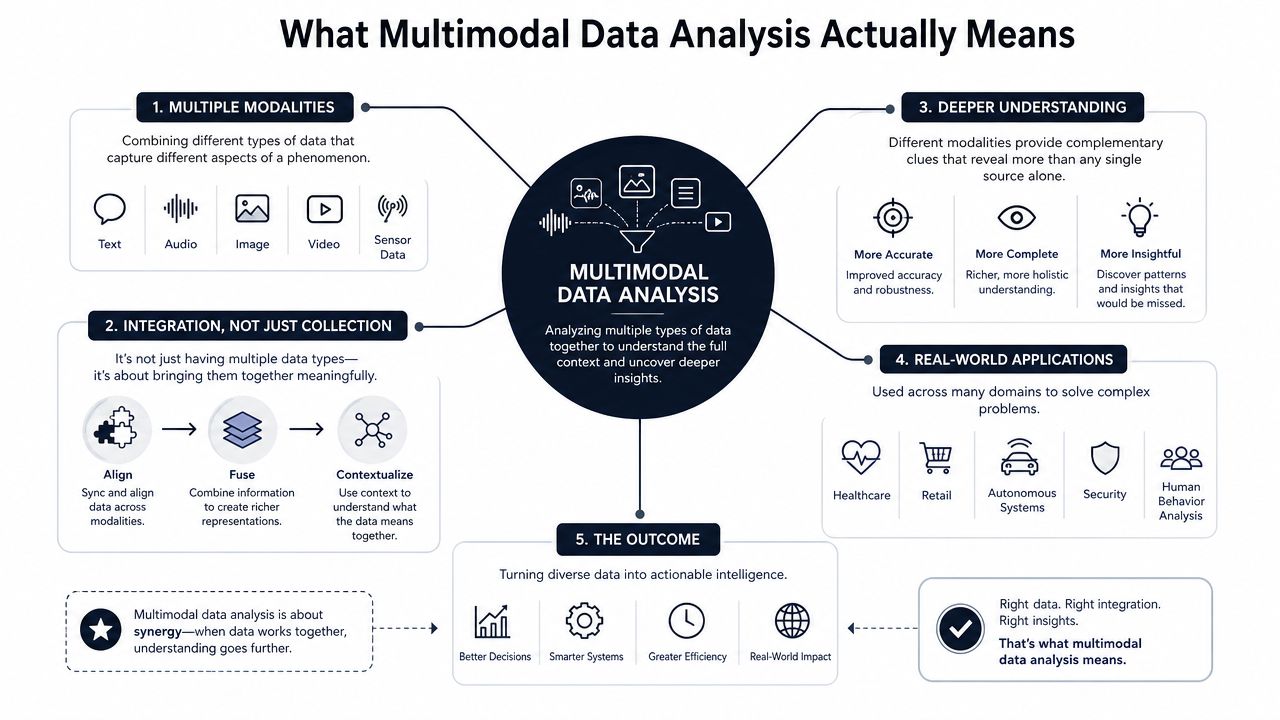
A single-channel dashboard is like listening with one ear. You hear something, but you miss the tone, the timing, and the context that would tell you whether the signal matters. Multimodal data analysis is the practice of reading the room from several signals at once, then inferring an underlying state that no single source can prove on its own.
That definition matters because people use the phrase in two different ways. In statistics, multimodal can mean a distribution with more than one peak, or mode, and analysts use tools like the dip test, excess mass test, bandwidth test, MAP test, and saddle test to decide whether those peaks are real structure or just noise. In machine learning and product analytics, multimodal means multiple data types or modalities, such as text, events, audio, and time series, being analyzed together.
For product teams, the practical version is easier to remember. A churn-risk score that draws from support tickets, usage telemetry, and sales-call language is multimodal because none of those streams is enough by itself. One source says the customer is active. Another source says they're frustrated. A third source says they're asking about price. The value is in the combination.
A clean way to think about it is this, a single-channel model tells you what happened in one lane, while a multimodal system tries to infer what that pattern means across lanes. That's why the goal isn't mere data integration. The goal is a stronger inference.
The historical arc backs that up. A 2020 systematic review of multimodal learning analytics described the field as one that “captures, integrates, and analyzes learning traces from different sources” to produce a complete view, and it organized data into five major classes and relationship patterns into three structural types. That's the same logic modern product-intelligence teams are using when they combine support tickets, usage metrics, sales calls, and chat transcripts into one customer view. The review is here for the broader framework, the multimodal learning analytics review.
The Five Data Classes You Will Actually Encounter
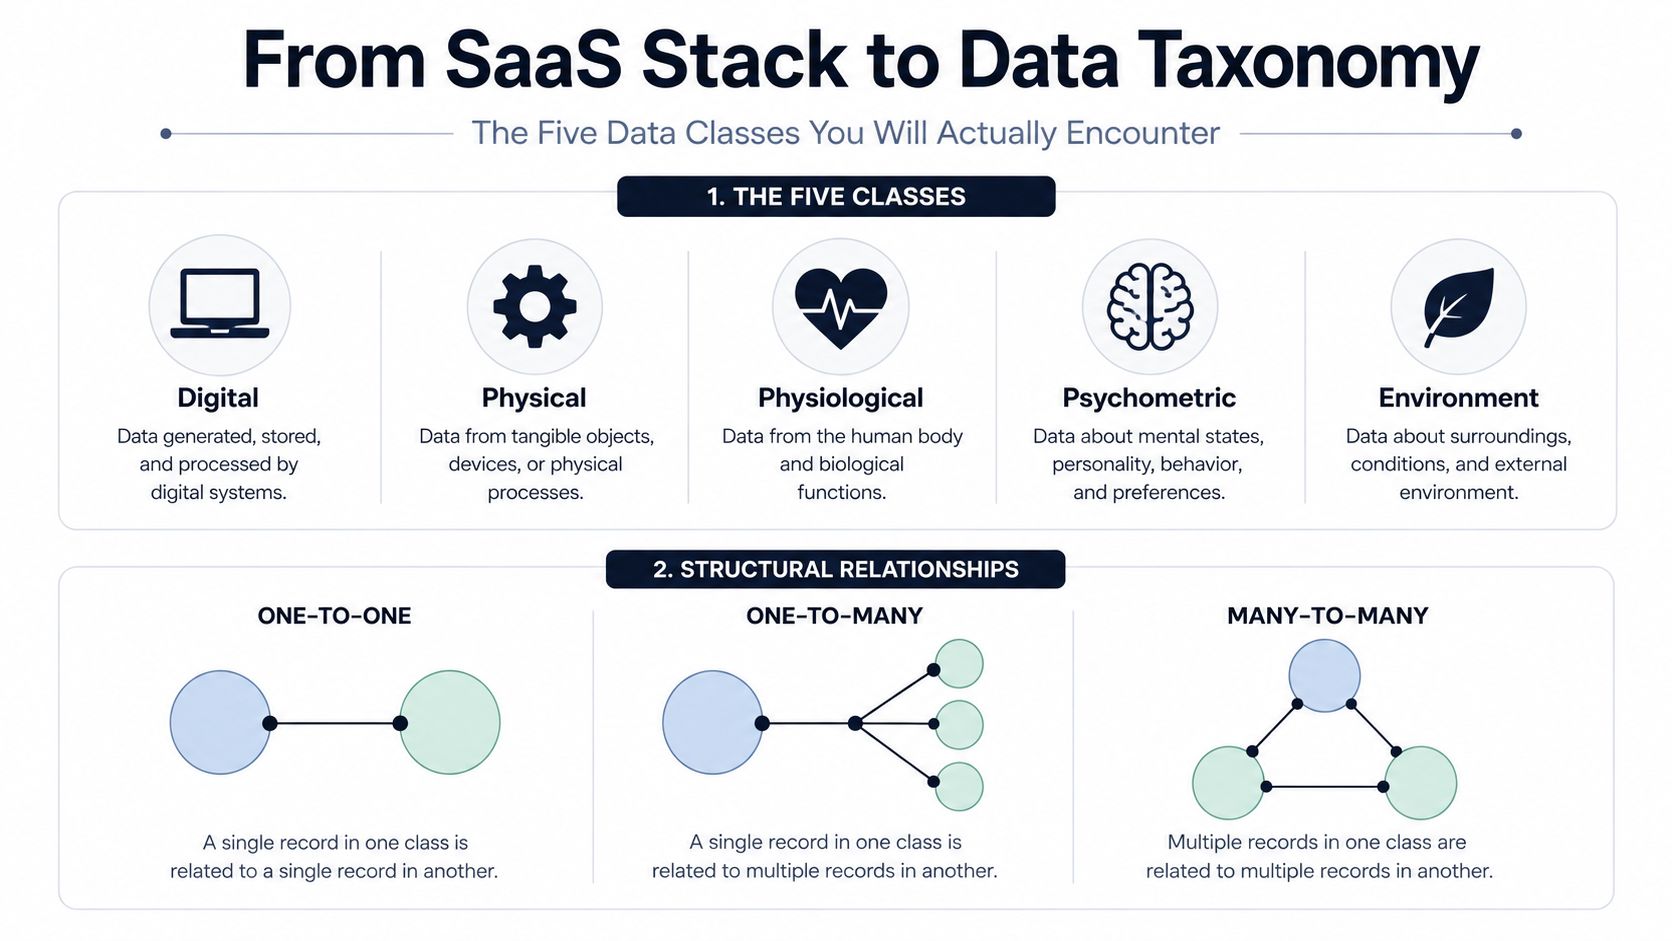
The useful taxonomy is not abstract. It maps cleanly onto a SaaS stack if you're honest about what each system holds. The five classes from the review, digital, physical, physiological, psychometric, and environment data, show up in product work more often than people realize.
Digital data is the easiest one. Usage events, feature clicks, session paths, support tickets, chat transcripts, Salesforce notes, and call transcripts all fit here. This is the backbone of most product analytics and customer intelligence systems.
Physical data is the awkward cousin. For SaaS teams, it often means device state, hardware behavior, or any tangible operational artifact attached to the customer experience. If your product depends on scanners, terminals, or connected devices, this class matters more than most dashboards admit.
Physiological data shows up less often in pure SaaS, but it's common in health, wearables, and some enterprise hardware contexts. For product teams outside those spaces, it's usually out of scope, but the classification still helps if your roadmap touches regulated or sensor-driven products.
Psychometric data is the gray zone that product teams often ignore. It includes sentiment, surveys, satisfaction scores, and other measures of attitude or perceived experience. A long-form NPS comment that points to onboarding confusion is psychometric in spirit, even if it lands in a ticketing tool.
Environment data covers context. Time of day, location, account segment, release cohort, contract state, or any external condition that changes interpretation belongs here. In practice, this class often decides whether a complaint is random noise or a pattern tied to rollout timing.
The structural relationships matter just as much. A one-to-one pattern looks like one support ticket matching one product event sequence. A one-to-many pattern appears when a single product release affects many usage metrics. A many-to-one pattern is the classic growth use case, several weak signals combine into one churn-risk view.
If you want a practical product lens on qualitative inputs, this qualitative data analysis guide is a useful complement, because a lot of ticket and transcript work starts there before it becomes modeling work. For a real-world example of time-series handling in production, the Faberwork LLC case studies are a good reference point for how structured pipelines support downstream analysis.
Useful lens: don't ask “which tool owns the data.” Ask “which class does the evidence belong to, and what relationship does it have to the outcome?”
Fusion Strategies and How to Choose Between Them
The biggest technical decision is not the model, it's the fusion strategy. Early fusion concatenates raw features before training, late fusion combines separate model outputs, and intermediate fusion learns shared representations in the middle. Those choices are not cosmetic. They change latency, failure behavior, and how much trust you can place in the result.
| Strategy | Latency | Missing-data robustness | Interpretability | Best-fit use case |
|---|---|---|---|---|
| Early fusion | Lowest when inputs are tightly synchronized | Weak | Medium to low | Sensor-style data with stable, complete inputs |
| Late fusion | Often simplest to operationalize | Strong | High | Production rollouts with frequent missing modalities |
| Intermediate fusion | Moderate | Strong when designed well | Medium | Product-intelligence workloads with partial alignment and mixed quality |
Early fusion is tempting because it feels elegant. In practice, it can be brittle if tickets arrive late, transcripts fail, or usage events have messy timestamps. It works best when the signals are tightly coupled and the team can enforce consistent preprocessing. That's why it's usually the wrong first choice for customer analytics.
Late fusion is the safest starting point. Each modality gets its own model, then the predictions get combined. That makes it easier to survive a transcription outage or a missing ticket stream, and it's often the easiest path to a production baseline. The downside is that it can miss interactions between modalities that only emerge when they're learned together.
Intermediate fusion sits in the middle, and for product-intelligence work it's often the long-term answer. Modern systems increasingly use shared latent spaces, cross-modal attention, and related alignment techniques to let text, events, and other signals interact without pretending they're already aligned. If you need a technical planning reference for the data layer that supports this, the data architecture diagram guide is a helpful companion piece.
Start late, graduate to intermediate, reserve early fusion for tightly coupled data that behaves like a sensor stream.
Models That Actually Work for Product Data
The modeling toolkit gets a lot smaller once you focus on real product data instead of benchmark datasets. Three classes matter most: multimodal transformers, contrastive learning, and representation alignment through shared latent spaces. Each solves a different pain point that shows up in tickets, transcripts, and usage logs.
A multimodal transformer is the right choice when you need the model to pay attention across time and text together. It's especially useful when a sales call and a usage dip need to be interpreted as one sequence, not two unrelated events. The model can learn that a phrase in a transcript matters more when it appears right after a specific product path.
Contrastive learning is useful when the question is matching. If you want the system to learn which support tickets belong with which usage sessions, contrastive objectives are a natural fit because they teach the model what should be close together and what should not. That's a strong pattern for deduplicating feedback, linking complaints to behavior, and finding repeated customer pain.
Shared-latent-space alignment works well when the modalities are noisy but related. It helps the model map different evidence streams into a common space so the product team can compare them without forcing them into the same raw format. That's particularly helpful when one modality is language and the other is event history, because the raw structures are nothing alike.
For teams that already use retrieval-style systems, the architecture often resembles a RAG pipeline more than a classic classifier, because you're collecting evidence, ranking it, and then using it to support a decision. The difference is that multimodal product pipelines care about behavioral signal, not just text snippets, so the retrieval layer has to respect timestamps, account context, and modality quality. A practical reference for that broader infrastructure pattern is AY Automate's reference architecture for RAG pipelines.
If the data is sparse and the volume is low, keep the model simpler. Fancy fusion over tiny data usually creates confident nonsense. Tooling such as SigOS sits on top of these primitives as an applied layer that operationalizes the outputs, but the underlying model choice still decides whether the signal is real.
Metrics That Prove Business Value, Not Just Accuracy
Accuracy is a useful internal check, but it's a weak business story. A model can look strong on paper and still fail the moment it's asked to drive retention, expansion, or support triage. That's why the scorecard should be tied to outcomes the business cares about.
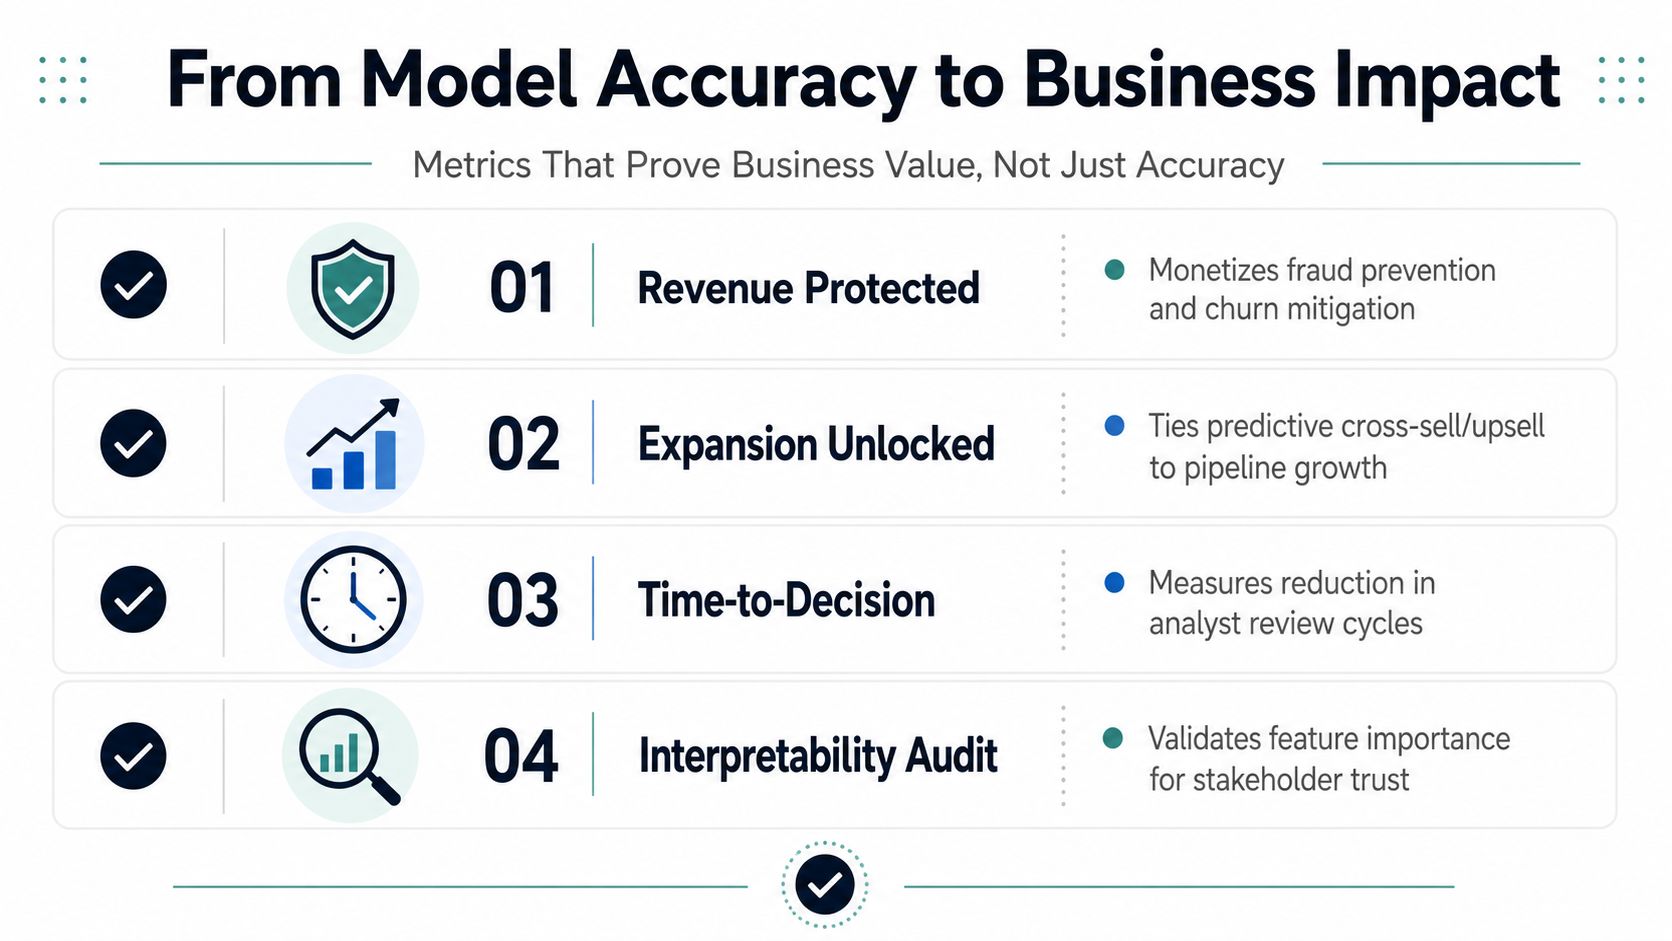
The first metric is revenue protected, which asks whether the model helped prevent churn or save at-risk accounts. The second is expansion opportunity, which measures whether the team found a feature request, upsell motion, or deal signal that changed pipeline outcomes. The third is time-to-decision, which matters because a better model that still takes hours to inspect doesn't help a support manager on a busy morning.
The fourth is interpretability audit, and it's the one teams skip until a failure forces the issue. A model that depends almost entirely on call transcripts is fragile if recording gets disabled or missing. A model that claims to use multiple modalities but really leans on one dominant signal is not a multimodal system in a meaningful operational sense.
A good audit asks hard questions:
- Which modality dominates? If one source explains almost everything, the fusion layer may be decorative.
- What breaks when a source goes missing? Production systems need fallback logic, not idealized completeness.
- What would this miss? If the model can't explain its blind spots, humans will stop trusting it.
- Can a reviewer act on the output? If not, the score is analytics theater, not decision support.
The point is not to make models perfectly explainable. The point is to make them reliable enough that a product manager, support lead, or revenue owner will use the recommendation.
A Practical Integration Pattern for Churn Prediction
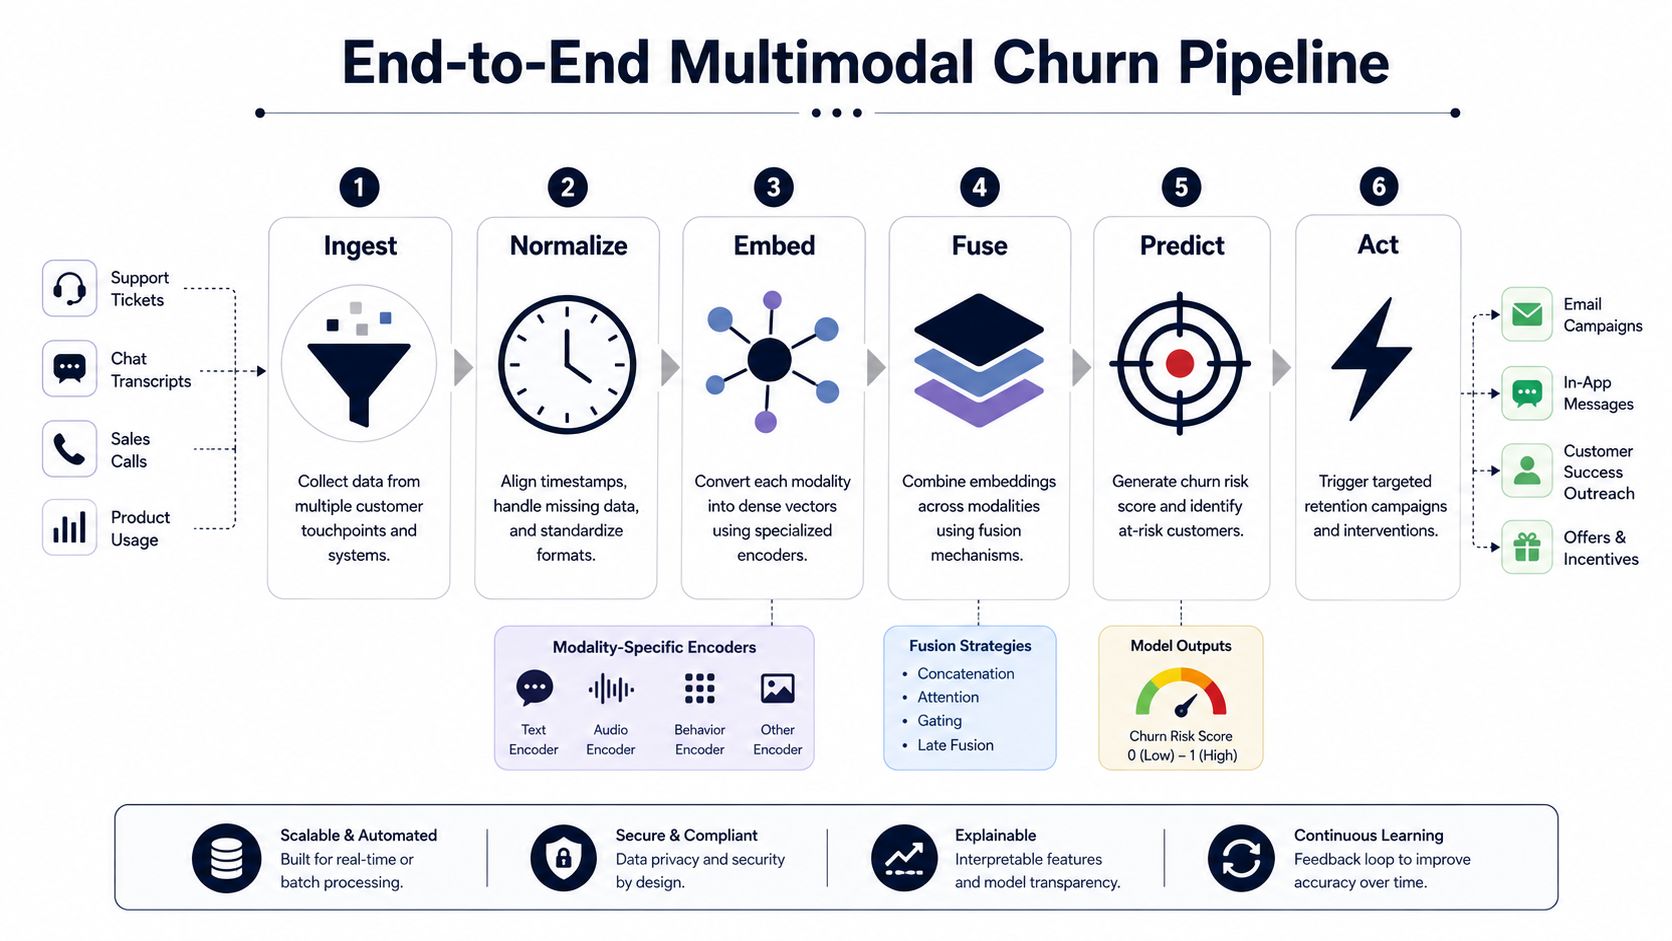
A churn pipeline that survives production looks boring on purpose. It starts by ingesting support tickets, chat transcripts, sales calls, and product usage into a governed store. Then it normalizes timestamps, assigns modality-specific embeddings, fuses them in an intermediate layer, and outputs a churn-risk score plus the signals that contributed to it.
The first failure point is always alignment. If timestamps aren't normalized, the model learns false relationships. If the transcript arrives after the usage event by an hour but the pipeline treats them as simultaneous, the system invents a story the customer never told.
Fallback logic matters just as much. If transcription fails, the pipeline should still score using tickets and usage. If tickets are missing, the model should degrade gracefully instead of hard-failing or producing a score that pretends the missing modality never mattered. That's where late or intermediate fusion outperforms a brittle all-in-one design.
Before launch, the hardening checklist should cover three things. Label quality, because churn labels are often delayed or inconsistent. Drift, because customer language and product usage patterns change. Retraining policy, because a model without a schedule tends to age into irrelevance.
For a practical company-facing layer that turns these signals into something a team can act on, the Company Brain platform is a useful example of how customer evidence can be organized into an operational view rather than left as a pile of fragments. The important part is the pipeline discipline underneath it, not the dashboard gloss.
If you need an implementation mindset, think less like a research group and more like a systems team. The model is only useful when the input order, fallback behavior, and review loop all hold up under bad data.
Three Snapshots of ROI and What the First 90 Days Look Like
A churn-risk model built on tickets, transcripts, and usage usually pays off first in account saves, not model metrics. The strongest pattern is a mid-market portfolio where support and success teams can intervene early enough to change a renewal conversation. The fusion choice is often late or intermediate, because missing data is normal and the team needs graceful degradation.
An expansion model tends to surface a feature request that sits inside a sales call or a support thread long before it shows up in pipeline reports. That's where multimodal analysis helps revenue teams connect product pain to a specific deal motion, instead of treating it as generic feedback. The value is not the score itself, it's the deal that moves because the right issue gets flagged in time.
A noise-reduction model gives support leaders their mornings back by collapsing duplicate complaints into one ranked cluster. That sounds modest until you've seen an inbox where ten threads are really the same problem wearing different language. The practical win is less manual sorting and faster escalation to the right owner.
| Phase | Focus | Realistic outcome |
|---|---|---|
| Week 1 | Data audit, modality inventory, label review | A clear view of what's usable and what's missing |
| Week 4 | Baseline model and first fusion test | A rough signal that beats manual triage in a narrow slice |
| Week 12 | Review loop, fallback logic, stakeholder trust | A signal people start using in daily decisions |
The first 90 days are usually slower than teams want and more useful than they expect. Week one is about finding gaps. Week four is about proving there's a signal. Week twelve is when the model starts earning trust because it still works when one modality gets messy.
SigOS helps product and growth teams turn multimodal data analysis into daily decisions, not just model experiments. If you're trying to rank churn risk, expansion signals, and noisy feedback in one place, SigOS gives you a practical way to operationalize that workflow and route the right signal to the right owner.
Keep Reading
More insights from our blog



Ready to find your hidden revenue leaks?
Start analyzing your customer feedback and discover insights that drive revenue.
Start Free Trial →