How to Predict Customer Churn Before It Happens
A practical guide on how to predict customer churn in SaaS. Learn to transform data into actionable insights, reduce attrition, and protect your revenue.

Before you can predict churn, you have to get real about what it’s actually costing you. We're not just talking about a lost subscription. Churn eats away at your revenue, inflates customer acquisition costs, and can quietly tarnish your reputation. Getting ahead of it isn't just a good idea—it's fundamental to survival and growth in the SaaS world.
The Real Cost of Customer Churn in SaaS

Customer churn is more than just a number on a report; it's a growth killer. Everyone loves celebrating new logos, but the unglamorous work of keeping the customers you already have is where the real profit is. The true danger of churn is how it snowballs over time.
Think about it: a 5% monthly churn rate might not sound terrifying, but it compounds to a massive 46% annual churn rate. That means you're losing nearly half your customer base every year. Your sales and marketing teams have to run twice as fast just to stand still, let alone grow the business.
This is why waiting for customers to hit the "cancel" button is a losing game. By then, it's too late. The real goal is to shift from being reactive to proactive, spotting the early warning signs and stepping in before dissatisfaction turns into a lost account.
Voluntary vs. Involuntary Churn
First things first, you need to know why customers are leaving. Not all churn is the same, and splitting it into two buckets is a crucial first step for any prediction model.
- Voluntary Churn: This is the one that stings. A customer actively chooses to leave. Maybe they found a competitor they like better, their needs changed, or a bad support experience was the final straw. These are the accounts your prediction model is built to identify and save.
- Involuntary Churn: This is the low-hanging fruit. It happens when a payment fails—an expired credit card, insufficient funds, or some other billing hiccup. While it's not a direct reflection of product unhappiness, it’s still lost revenue. This is typically handled with automated dunning and recovery emails.
By separating these two, you can laser-focus your predictive modeling on the customers who are consciously pulling away, which is where your team can make the biggest impact.
"The most dangerous churn signals aren't loud complaints; they're the quiet disengagements. A customer who stops logging in, stops opening support tickets, and goes silent is often closer to leaving than one who is actively voicing frustration."
Turning Words Into Warnings
Some of the most potent churn indicators are hiding in plain sight, buried in unstructured customer feedback. Think about all those frustrated support tickets, confused comments on sales calls, or critical responses in NPS surveys. This is where you find the why behind customer behavior. The real trick is turning those words into data that a machine learning model can understand.
This is where a modern churn prediction strategy really flexes its muscles. By using language and sentiment analysis, you can transform qualitative feedback into hard, quantitative signals. For example, if a specific account suddenly has a spike in support tickets mentioning words like "bug," "slow," or "confusing," that becomes a quantifiable risk score. You can dive deeper into the financial impact by exploring our guide to calculating customer lifetime value in SaaS.
This process turns subjective complaints into objective data points. It lets you flag at-risk accounts based on what they're saying, not just what they're doing (or not doing) in your app. This complete picture is the bedrock of a truly predictive and actionable churn model.
Gathering the Right Data to Predict Churn
To get ahead of churn, you need the right ingredients. Any predictive model is only as good as the data you feed it, so the first real job is to build a complete, unified profile for each customer. This isn't about hoarding every byte of data you can find; it’s about strategically collecting the signals that actually tell you how healthy a customer relationship is, long before they decide to leave.
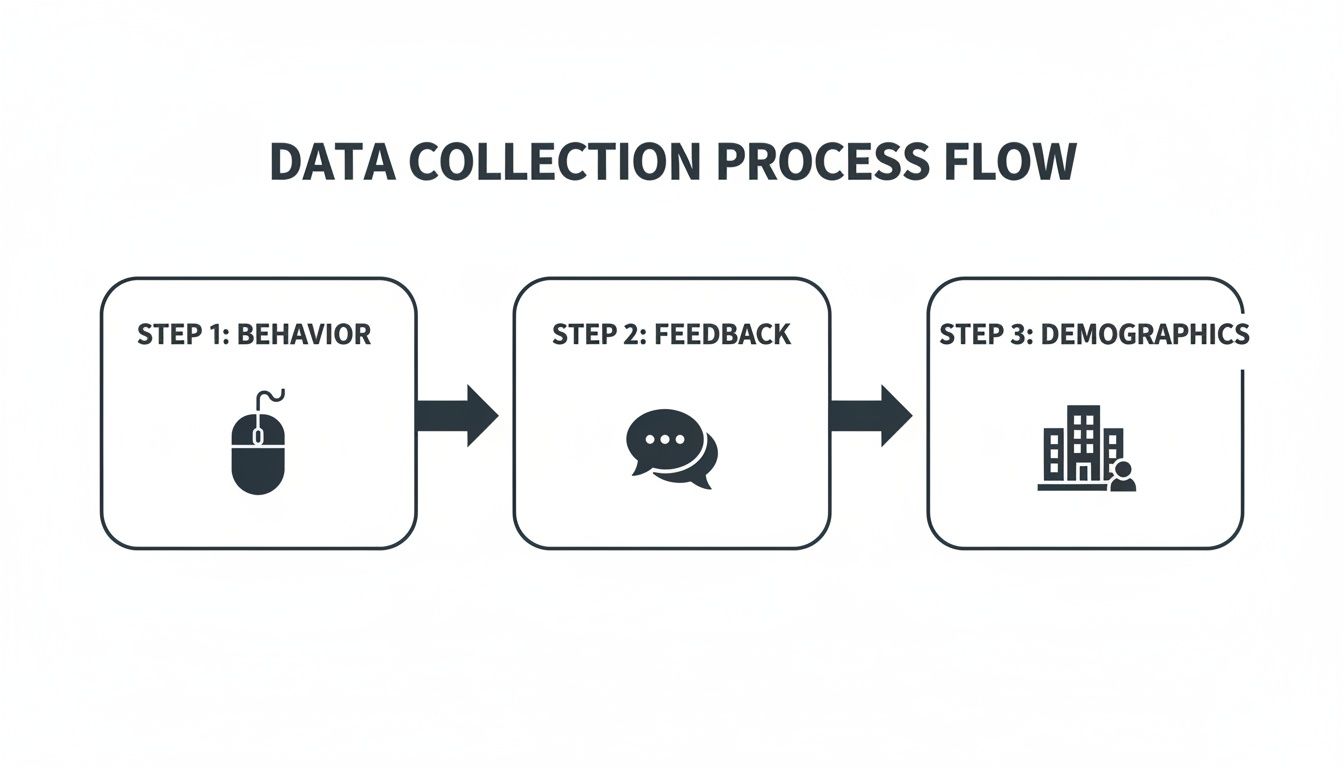
The whole process starts by weaving together three different, but deeply connected, types of data. Each one tells a piece of the story. Put them together, and you get a clear picture of both risk and opportunity.
Behavioral Data: What Your Users Actually Do
Behavioral data is the footprint customers leave inside your product. It’s the raw log of their interactions, showing you precisely what they do, how often they do it, and which features they lean on versus which ones they ignore. This is almost always where the earliest warning signs of churn start to bubble up.
Forget high-level vanity metrics like daily active users. You need to dig deeper for signals that reflect genuine engagement and value.
- Login Frequency and Recency: It's not just about how often they log in, but about changes in that pattern. A customer who has logged in every day for a year and suddenly stops for a week? That's a massive red flag.
- Feature Adoption Rate: Are customers actually using the "sticky" features—the ones you know correlate with long-term value and retention? Identifying accounts that haven't touched these core functions is critical. They simply aren't getting their money's worth.
- Session Duration and Depth: Short, frantic sessions can be a bad sign. It might mean a user is stuck and can't figure out how to complete a task. Are they clicking aimlessly? We sometimes call this "rage clicking," and it's a clear sign of frustration.
- Key Action Completion: You have to track whether customers are completing the core workflows that deliver value. In a project management tool, that could be "creating a project" or "assigning a task." If those actions aren't happening, engagement is superficial at best.
Qualitative Feedback: What Your Users Are Telling You
Behavioral data tells you what's happening, but qualitative feedback tells you why. This is the unstructured, messy, but incredibly valuable data buried in your support tickets, live chat logs, sales call notes, and NPS survey comments. It’s the unfiltered voice of your customer.
You have to connect the dots between what users do and what they say. That’s where the real insights are.
A customer stops using a key feature (that's a behavioral signal). Digging in, you find they recently filed a support ticket complaining that it's "buggy and confusing" (a qualitative signal). Suddenly, you've moved from a simple data point to an actionable story.
This is where platforms like SigOS really shine. They use AI to comb through all that text, quantify sentiment, and spot recurring themes. It turns thousands of individual customer comments into measurable risk factors. You can finally answer questions like, "Which bugs are mentioned most often by customers whose usage is dropping?" or "Is all this negative feedback about the new UI actually tied to subscription downgrades?"
Firmographic Data: Who Your Customers Are
Firmographic data gives you the business context for each account. It allows you to segment your user base and see if churn risk is concentrated in specific pockets. This data is far more than a sales tool; it’s a crucial piece of the puzzle for building a sophisticated churn model.
Key firmographic data points include:
- Subscription Plan: Are customers on monthly plans churning more than those on annual contracts?
- Company Size: Do small businesses and enterprise clients have different churn profiles? (Spoiler: they almost always do.)
- Account Age: Are brand-new customers, still finding their footing, more likely to leave?
- Industry or Vertical: Does your product deliver more value for certain industries?
The screenshot below from the SigOS platform shows what it looks like when these different data streams are brought together.
This kind of dashboard ties qualitative feedback directly to customer accounts and revenue, making it painfully obvious which problems are costing you the most money.
The big takeaway here is that by unifying these data streams, you graduate from looking at isolated metrics to understanding customer health holistically. Of course, this entire process can be derailed by bad data, which is why clean, reliable sources are non-negotiable. You can learn more by reading our guide on tackling common data quality issues.
Ultimately, your goal is to create a single source of truth for every customer—a profile that blends their actions, their words, and their business context. This unified view is the bedrock of any churn prediction strategy that actually works.
Turning Raw Data Into Predictive Insights
Raw data streams are full of potential, but on their own, they're just noise. The real magic in building a model to predict customer churn happens when you transform that raw material into meaningful signals. This process, known as feature engineering, is where your domain knowledge and a bit of creativity come together to tell a clear story about customer health.
Think of it this way: a single login timestamp is pretty useless. But a series of them? Now we're talking. You can suddenly derive powerful features like "days since last login," "average session duration over the last 30 days," or even "change in login frequency month-over-month." These are the kinds of engineered features that a machine learning model can actually sink its teeth into.
Our goal is to create features that pick up on the subtle shifts in behavior and sentiment—the early tremors that signal a churn earthquake is on the horizon.
From Timestamps to Trends
Behavioral data is a goldmine, but you need to know where to dig. Just counting events won't cut it; we need to build features that reveal patterns over time. This is where you get to define what "at-risk" behavior really looks like for your product.
Here are a few ways I’ve seen this done effectively:
- Usage Velocity: Don't just look at the total number of key actions a customer has taken. Calculate the rate of those actions. A sudden drop in "projects created per week" is a much stronger red flag than a slowly declining total count.
- Feature Discovery Lag: How long does it take a new customer to start using your stickiest, most valuable features? A long delay can be a classic sign of a poor onboarding experience, which we know is a major churn driver.
- Error Rate Spikes: Start tracking the ratio of successful actions to errors. When you see a sudden spike in that ratio for a specific user, it’s a pretty safe bet they're frustrated and a support ticket isn't far behind.
The best models don't rely on just one data stream. They combine what users do, what they say, and who they are to get a complete picture.
Quantifying the Qualitative
One of the most powerful—and most frequently overlooked—sources of data is the unstructured text sitting in your support tickets, chat logs, and survey responses. These are packed with direct clues about customer intent. The only challenge is making this data understandable for a machine.
This is where techniques from Natural Language Processing (NLP) really shine.
By analyzing the text from customer interactions, you can create features that measure things like sentiment and frustration. For example, you could engineer a "customer frustration score" by tracking the frequency of keywords like "broken," "slow," "confusing," or "doesn't work" in support tickets over the last 90 days.
All of a sudden, a subjective complaint becomes an objective, trackable metric. You can take it even further by categorizing feedback to create features like "number of bug-related tickets" or "mentions of competitor X."
For a deeper dive into how this kind of analysis can inform business strategy, check out our guide on creating a sample data analysis report.
Platforms like SigOS are built to automate this entire process. It uses AI to scan through qualitative feedback, mapping it directly to behavioral signals and revenue impact. This lets you connect the dots, showing not just that a customer is frustrated, but that their specific frustration about "the slow reporting feature" directly correlates with a 30% drop in their usage of that feature.
When you combine these engineered behavioral features with quantified qualitative signals, you build a rich, multi-dimensional view of each customer. You're no longer just tracking logins; you're measuring engagement, frustration, and intent. This robust feature set is the bedrock of any accurate and reliable churn prediction model.
Choosing the Right Churn Prediction Model
Okay, you've done the hard work of gathering signals and engineering your features. Now comes the part that feels like the "data science" bit: picking a machine learning model. This is where a lot of teams can get lost in the weeds, debating the merits of obscure algorithms.
But let's be practical. The goal isn't to build the most academically perfect model; it's to build a model that actually helps your business keep its customers.
Your decision really boils down to a trade-off. How much raw predictive power are you willing to sacrifice for the ability to understand why the model thinks a customer is at risk? For most SaaS companies, a model that's 85% accurate but perfectly explainable is infinitely more valuable than a 90% accurate "black box."
Finding the Sweet Spot: Accuracy vs. Interpretability
Think about it from your Customer Success team's perspective.
Giving them a list of at-risk customers with a generic "92% churn probability" score is paralyzing. What are they supposed to do with that? But if you can tell them, "This customer is at risk because their usage of the reporting feature dropped by 40% and they've hit a paywall twice this month," you've given them a perfect script for a proactive, helpful conversation.
That's the difference between a model that's just a number and a model that drives action. The more complex a model gets, the harder it is to pull out those simple, human-readable reasons. This is why it’s so critical to understand how different AI-Powered Churn Prediction Models balance this trade-off in the real world.
Comparing the Go-To Churn Prediction Models
You don't need to test dozens of algorithms. In practice, most churn prediction use cases are well-served by one of three trusted models. Each has its place, depending on your team's maturity and business needs.
Here's a quick rundown of what I've seen work best.
Comparison of Churn Prediction Models
This table lays out the practical differences between the most common choices for churn prediction, helping you match the right tool to your team's specific needs.
| Model | Best For | Interpretability | Performance |
|---|---|---|---|
| Logistic Regression | Teams needing clear, explainable predictions and a strong baseline. | Very High | Good |
| Random Forest | Situations where higher accuracy is needed without sacrificing all interpretability. | Medium | Very Good |
| Gradient Boosting | Mature teams aiming for maximum predictive power, where interpretability is less critical. | Low | Excellent |
Let's dig a little deeper into what these mean for your day-to-day.
- Logistic Regression: This is almost always the best place to start. It’s a workhorse statistical model that’s incredibly easy to interpret. It literally assigns a coefficient to each feature, so you can say, "For every additional support ticket, the probability of churn increases by X%." Its simplicity is its biggest asset.
- Random Forest: Think of this as a committee of decision-makers. It builds hundreds of simple "decision trees" and then takes a vote. This "ensemble" approach almost always boosts accuracy over Logistic Regression. You lose some of the crystal-clear interpretability, but you can still get a solid list of "feature importances" to see what's generally driving the predictions.
- Gradient Boosting (XGBoost, LightGBM): These are the power tools. Models like XGBoost build trees one after another, with each new tree learning from the mistakes of the one before it. They often deliver the best performance, but they are much harder to tune and are the least transparent. This is the territory of mature data science teams who are chasing every last percentage point of accuracy.
My Advice: Don't overcomplicate things early on. The clarity of Logistic Regression is your best friend when you're just starting. Build a solid baseline, understand what it's telling you, and get your CS team acting on the insights. You can always level up to a more complex model down the road.
Why "Accuracy" Is a Deceptive Metric
One last, crucial point. If someone tells you their churn model is "95% accurate," you should be skeptical.
Imagine only 5% of your customers churn in a given month. A lazy model that simply predicts no one will churn is technically 95% accurate, but it’s completely worthless. This is a classic "imbalanced dataset" problem.
To evaluate your model properly, you need to look at metrics that tell a more nuanced story:
- Recall (or Sensitivity): Out of all the customers who actually churned, what percentage did your model correctly flag? This is your top priority. You want to catch as many at-risk customers as you can.
- Precision: Of all the customers your model predicted would churn, what percentage actually did? High precision means your CS team isn't wasting time chasing false alarms.
The goal is to strike a balance, but you should always lean towards maximizing Recall. A few false positives are a small price to pay for catching a customer you otherwise would have lost for good.
Putting Your Churn Predictions Into Action

Let's be honest. Building a model that can predict customer churn with high accuracy is a huge technical win, but it delivers exactly zero business value on its own. The real magic happens when you turn those predictive scores into proactive interventions that actually save customer relationships. This is where you finally close the loop between data science and customer success.
The entire goal is to get your model out of a static report and into a dynamic, real-time system that forces action. You need a rock-solid plan for how your teams will respond the moment an account is flagged as high-risk. Without it, your predictions are just interesting numbers collecting digital dust.
From Churn Score to Proactive Workflow
A simple churn score is not enough to be truly useful. Imagine your customer success team getting an alert that just says, "Customer X has a 91% churn probability." Okay... now what? The real power comes from showing them why the score is high and giving them a clear next step.
This means your model needs to be scoring customers continuously—ideally in real-time or at least daily—and then piping those insights directly into the tools your teams already live in.
- For Customer Success: An alert should fire off to your CSM's inbox or create a task in their CRM. This alert can't just be the score; it needs context. It should highlight the top three contributing factors (e.g., "usage of reporting feature down 50%," "two unresolved support tickets") and link straight to the customer's profile.
- For Product Teams: When a specific bug or usability issue is consistently flagged as a top churn driver across multiple accounts, an automated ticket should be created in a tool like Jira or Linear. Better yet, the ticket should be automatically prioritized based on the cumulative revenue at risk.
This simple shift transforms a vague prediction into a concrete starting point for a conversation or a critical product improvement.
A churn score is not a final verdict; it's an invitation to engage. It's a signal that a customer needs attention, and the reasons behind the score provide the perfect script for a value-driven, empathetic conversation.
Creating an Intervention Playbook
You wouldn't use the same approach for every single customer, and at-risk accounts are no different. A high-value enterprise customer with a complex technical issue requires a much different response than a small business that's just struggling with onboarding. That’s why you need a tiered intervention playbook.
This playbook should map out specific actions based on both the customer's value and the root cause of their churn risk.
Examples of Intervention Strategies
| Churn Driver | Low-Touch Intervention (SMB) | High-Touch Intervention (Enterprise) |
|---|---|---|
| Poor Onboarding | Send an automated email with links to relevant tutorials and webinars. | Schedule a personalized 1-on-1 retraining session with a product specialist. |
| Declining Usage | Trigger an in-app message highlighting a new, relevant feature they might love. | Have the CSM conduct a full business review to realign the product's value with their goals. |
| Bug/Technical Issue | Add their name to a list for automated email updates on the fix. | Escalate the ticket to a senior engineer and provide the customer with a direct line of communication. |
This kind of structured approach ensures your response is always proportional and relevant. It empowers your team to act decisively without having to reinvent the wheel every single time an account is at risk.
The financial stakes are massive. Customer churn leads to staggering global financial losses, with U.S. companies alone losing $136 billion every year to avoidable attrition. The real kicker is that many of these losses come from fixable issues—a whopping 53% of cases are traced back to bad onboarding, poor relationship building, and inadequate customer service. These are all areas where a proactive intervention can make all the difference. You can find more details in these customer retention statistics.
Ultimately, a platform like SigOS is designed to automate this entire process. It doesn't just predict churn; it connects the dots between qualitative feedback, behavioral signals, and the actual revenue impact. SigOS can automatically create prioritized engineering tickets when a bug is costing you money or alert a CSM the moment a high-value account's sentiment turns negative. It puts your data to work, ensuring every prediction triggers a meaningful, revenue-saving action.
Common Questions About Predicting Churn
As you start digging into how to predict customer churn, a few practical questions always pop up. These are the usual hurdles people face when they move from talking about churn prediction to actually doing it. Getting straight answers to these is the key to getting your strategy off the ground.
Here’s a breakdown of the most common questions we hear from product, data, and growth teams.
How Much Data Do I Need to Start Predicting Churn?
There's no magic number here. A good starting point is having at least a few hundred examples of customers who have churned. But honestly, the richness of your data matters a lot more than the raw volume. A smaller, detailed dataset with behavioral logs, support ticket history, and customer details is way more powerful than a massive dataset that only scratches the surface.
Think of it as an iterative process. You can build a pretty decent first model with the historical data you have right now. Over time, as you gather more information, your model will naturally get smarter and more reliable.
What Is the Difference Between a Churn Signal and a Churn Driver?
This is a really important distinction. Getting this right is what separates a decent churn prediction program from a truly effective one.
- A churn signal is something you can measure that correlates with a customer leaving. A classic example is a big drop in how often a user logs in. It tells you who might be at risk.
- A churn driver is the why behind that behavior. Maybe the logins dropped because they're frustrated with a critical bug, or perhaps they're totally confused by a new UI update. This tells you why they're at risk.
The best churn prediction systems don't just flag signals; they help you pinpoint the actual drivers. This lets you fix the root problem—like a bug—instead of just treating the symptom with a generic "checking in" email.
How Can We Avoid Creating a Self-Fulfilling Prophecy?
This is a great question and a totally valid concern. If your customer success team sees an account has a high churn risk score, will they subconsciously write them off as a lost cause? That inaction could be the very thing that pushes the customer to leave, making your prediction a self-fulfilling prophecy.
The fix is all about how you frame and use your churn scores. A high score can't be a death sentence; it has to be a trigger for positive, proactive intervention.
Your internal playbook needs to be crystal clear on this:
- A high churn score means a CSM schedules a check-in call, period.
- Use the score as a reason to offer targeted training or finally escalate that nagging support issue.
- Frame the alerts as "engagement opportunities" or "re-engagement flags," not "pre-churn notices."
This simple shift in mindset ensures your team sees the prediction as a tool to save a customer, not an excuse to give up on them.
Can I Predict Churn Without a Data Science Team?
Absolutely. While a dedicated data science team can build some incredibly complex custom models, you don't need one to get started anymore. Modern product intelligence platforms have made churn prediction much more accessible. These tools are built to do the heavy lifting for you.
They handle the data ingestion, feature engineering, and the machine learning itself. Instead of spitting out raw code or dense statistical reports, they give you clear, actionable insights—like revenue-impact scores and prioritized alerts—without you ever having to touch a line of Python. This lets your product and growth teams focus on what they do best: strategy and talking to customers.
Ready to move beyond guesswork and start proactively saving customers? SigOS connects what your customers say with what they do, identifying the hidden revenue risks and opportunities in your feedback data. Learn how SigOS can help you predict and prevent churn today.
Keep Reading
More insights from our blog


Ready to find your hidden revenue leaks?
Start analyzing your customer feedback and discover insights that drive revenue.
Start Free Trial →