A Guide to Predicting Customer Churn Using AI
Discover how AI is revolutionizing customer retention. This guide covers the data, models, and strategies for predicting customer churn before it happens.

At its core, predicting customer churn is about using data to see the future. It's the process of analyzing customer behavior with machine learning to pinpoint who is likely to cancel their service or stop using your product.
This foresight is a game-changer. It gives you the chance to step in with the right support or offer before a customer decides to walk away, turning a potential loss into a long-term, loyal user. Think of it as spotting the quiet warning signs before they become a loud goodbye.
Why Proactive Churn Prediction Matters

Customer churn is more than a number on a dashboard; it's a silent killer of growth and profitability. When you only react—sending exit surveys or throwing last-minute discounts at departing customers—you're just bailing water from a leaky boat instead of patching the holes. You might save a customer here and there, but you haven't addressed the root cause of the problem.
This is where proactive churn prediction completely flips the script. It moves your entire strategy from damage control to opportunity creation.
The Shift from Reactive to Proactive
Instead of asking, "Why did they leave?" you can finally start asking, "Who is at risk of leaving, and what can we do about it right now?" This forward-looking stance empowers every team in your organization to protect your most valuable asset: your customers.
Modern AI-powered platforms make this possible by analyzing subtle, often invisible, shifts in customer behavior. These systems connect the dots between seemingly unrelated events.
AI can catch critical indicators like:
- A slow, steady decline in the use of key product features.
- A sudden spike in support tickets from a normally quiet account.
- Negative sentiment creeping into call transcripts or chat logs.
- A noticeable drop in engagement right after a new product update.
By weaving these disparate data points together, these systems generate a real-time churn score, flagging at-risk accounts long before they ever think about canceling. This isn't just a side project for the data science team; it's a fundamental business strategy for survival and growth.
Predicting customer churn allows teams to move from being firefighters who react to problems to architects who build stronger, more resilient customer relationships. It transforms retention from a defensive tactic into a core growth engine.
The Evolution of Prediction Accuracy
Our ability to forecast churn with real accuracy has come a long way. The field has evolved dramatically since the early 2000s, with today's machine learning techniques blowing older statistical models out of the water.
Pioneering work in the telecom industry first proved that combining multiple models could catch complex churn patterns that a single approach would miss. Now, sophisticated ensemble methods that pull from diverse data sources—support tickets, usage metrics, sales calls, and more—can achieve accuracy rates hitting 92%. This journey shows why a modern, multi-faceted approach is absolutely essential for predicting churn in today's complex SaaS world. To get the full story, you can explore how machine learning models have advanced over time.
Weaving Together the Data That Matters
A churn prediction model is only as good as the data it learns from. It's that simple. If you feed it shallow or siloed information, you'll get unreliable predictions. Think of it like a detective trying to solve a case with only a single clue—they're just guessing.
To get a truly predictive model, you need to move beyond simple metrics like login counts. The real magic happens when you bring together different data streams to create a single, unified story for each customer. This is how you spot the subtle, interconnected patterns that show up right before a customer decides to leave.
Building a complete picture of customer health means tapping into four essential areas of your business. Let's break them down.
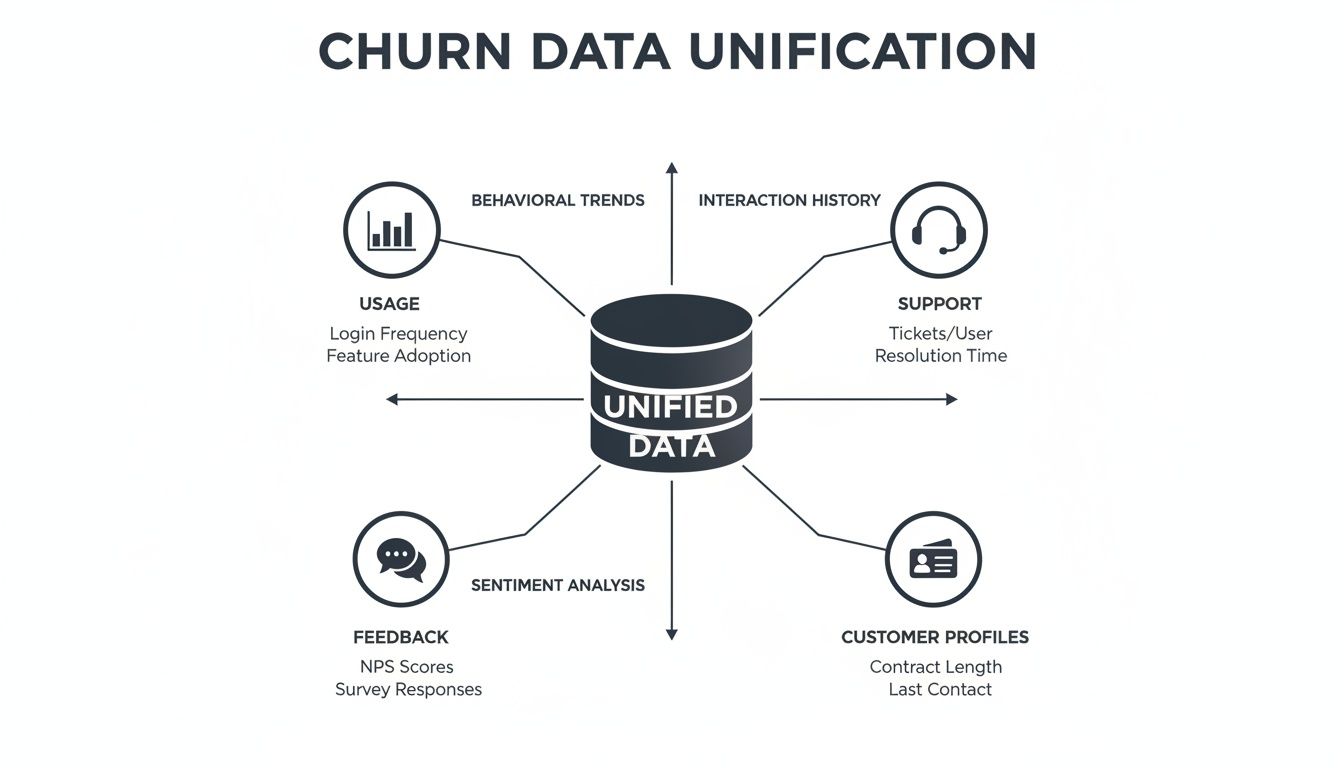
The Four Pillars of Churn Data
Your data strategy should be built on four key pillars. Each one gives you a different angle on the customer experience, and when you combine them, you start to see not just what's happening, but why it's happening.
- Product Usage Patterns: This is the hard evidence. How are customers actually using your product? It shows you which features are sticky, what gets ignored, and how engagement trends up or down over time.
- Customer Support Interactions: Support tickets, call logs, and chat transcripts are a goldmine. They are the frontline reports on friction points, bugs, and frustrations that are often a direct line to churn.
- Qualitative Customer Feedback: This is the human element. Raw feedback from sales calls, CSM check-ins, and surveys gives you context that numbers alone can't. It's where you hear the customer’s true sentiment in their own words.
- Foundational CRM Information: Don't forget the basics. Data like subscription plan, company size, and contract value adds crucial business context. It helps you segment customers and understand how risk differs across your user base.
Seeing a drop in the usage of a key feature is one thing. But seeing that drop happen right after a spike in support tickets about that feature's performance? That’s not just a signal; it’s a siren. That’s the power of bringing your data together.
Capturing Metrics That Actually Predict Churn
Within each pillar, the goal is to track metrics that have real meaning. For product usage, don't just count clicks; measure the adoption of features you know lead to long-term value. For support, look at ticket volume, how long issues take to resolve, and whether the same problems keep popping up.
Here's something a lot of teams miss: the sentiment behind the interaction. A customer submitting ten feature requests might look highly engaged. But if the tone in those requests is consistently frustrated, they're actually a massive churn risk. This is where AI-powered sentiment analysis can uncover warnings you'd otherwise miss.
The table below breaks down the most important data sources and the kinds of metrics you should be tracking to build a powerful churn prediction model.
Essential Data Sources for Churn Prediction Models
This table outlines the key categories of data required for building an effective churn prediction model, with examples of specific metrics for each.
| Data Category | Description | Example Metrics |
|---|---|---|
| Product Usage | Tracks how customers interact with your application daily. | Feature adoption rates, session duration, frequency of key actions, user inactivity periods. |
| Support & CS | Captures direct interactions with your support and success teams. | Ticket volume per account, response times, number of escalations, sentiment in transcripts. |
| Feedback & Surveys | Collects direct feedback on customer satisfaction and experience. | Net Promoter Score (NPS), CSAT scores, open-text survey responses, feedback from calls. |
| CRM & Billing | Provides firmographic and contractual context for each account. | Subscription tier, contract renewal date, company size, industry, payment history. |
Of course, pulling all these different sources together is often the hardest part of the job. The good news is that modern platforms are built to do this heavy lifting for you, connecting these systems and turning a tangled mess of data into a clean, ready-to-use dataset. For any team serious about this, learning about data integration best practices is a non-negotiable next step.
How AI Models Actually Predict Churn
So you've gathered all this clean, unified data. How does an AI actually turn it into a surprisingly accurate churn forecast? It can feel like a bit of a "black box," but the concepts behind the magic are actually pretty intuitive. Think of different machine learning models as specialized detectives, each using a unique method to analyze clues and predict an outcome.
Getting a handle on these approaches demystifies how platforms like SigOS can pinpoint at-risk accounts with such precision. It’s not about finding one single, perfect algorithm, but about getting a team of them to work together.
Predicting If a Customer Will Churn
The most direct question you can ask is, "Will this customer churn in the next 90 days?" This is a classic yes-or-no question, and the models built to answer it are called Classification Models.
Imagine a doctor diagnosing an illness. They look at a patient's symptoms—fever, cough, fatigue—and, based on past cases, classify them as either "sick" or "not sick." A classification model does the exact same thing for customer health.
It sifts through a customer's attributes and recent behaviors, asking questions like:
- Have they stopped using a critical feature?
- Is their support ticket volume suddenly spiking?
- Did their NPS score just take a nosedive?
- Are they on a less-sticky monthly plan?
By comparing this profile to the historical patterns of customers who churned, the model classifies the current customer as either high-risk (likely to churn) or low-risk (likely to stay). This gives your customer success team a clear, actionable signal to work with.
Forecasting When a Customer Might Leave
Knowing if a customer will churn is powerful, but knowing when they might churn gives you a massive strategic advantage. This is where Survival Analysis comes into play. This approach is less like a simple diagnosis and more like a weather forecast.
A good forecast doesn't just say, "It's going to rain." It gives you the probability of rain over a specific period—a 30% chance this afternoon, an 80% chance tomorrow night. Survival analysis does the same for churn, predicting the likelihood that a customer will "survive" without leaving over a certain timeframe.
This method is incredibly useful for prioritizing your team's efforts. A customer with a 90% churn risk in the next 30 days needs a completely different level of urgency than one with a 40% risk over the next six months. It lets your team focus on the biggest, most immediate fires first.
Understanding Why They Are Unhappy
Sometimes, the most telling clues aren't in usage clicks or subscription data. They're buried in plain text. This is where Natural Language Processing (NLP) becomes a game-changer for predicting churn.
NLP models are trained to read and understand human language from support tickets, call transcripts, survey responses, and feedback forms. They can automatically pull out critical insights by identifying:
- Sentiment: Is the customer's tone positive, negative, or just neutral?
- Intent: Are they asking for help, complaining about a bug, or requesting a feature?
- Key Topics: Are they constantly bringing up "slow performance" or a "confusing interface"?
This is where all those different data streams come together to paint a complete picture of the customer's experience.
When you unify product usage data with support interactions, qualitative feedback, and CRM profiles, the model finally gets the context it needs to make truly accurate predictions.
The Power of the Ensemble Method
So, which model is the best? The real answer is: all of them, working together.
Modern, effective churn prediction platforms almost never rely on a single model. Instead, they use an ensemble method, which combines the outputs from multiple different models to produce one single, highly accurate prediction.
Think of it like seeking a second, third, and fourth medical opinion. One doctor might miss something, but the consensus from a panel of specialists is far more reliable. An ensemble model leverages the unique strengths of each individual model—classification, survival, NLP—to form a more robust and nuanced conclusion.
This approach is the key to understanding how AI really predicts churn. It’s about spotting complex behavioral signals by combining different analytical perspectives. This is a core principle of data science, and you can learn more by exploring the fundamentals of what is pattern recognition. By blending these techniques, a platform can give you a clear, reliable churn score without you needing to become a data scientist to figure it out.
Measuring the Real Impact of Your Churn Model
So you've built a model for predicting customer churn. That’s a huge milestone, but it's only half the journey. The most technically brilliant prediction in the world means nothing if you can’t prove it’s making a real difference to the business. How do you actually connect those abstract data science scores to the tangible impact on your bottom line?
This is where the rubber meets the road. It’s all about translating complex metrics into a clear, compelling story about revenue saved, efficiency gained, and customer relationships rescued from the brink.
Moving Beyond Simple Accuracy
Hearing your model is "99% accurate" might sound impressive, but that number can be incredibly deceptive. Seriously.
Imagine you have 100 customers, but only one is actually going to leave. A lazy model could simply predict that no one will churn and still score 99% on accuracy. Yet, it would have completely failed at its one crucial job: flagging the single customer who was truly at risk.
This is exactly why we need to dig deeper with more nuanced metrics that reveal how well the model performs its specific task. Two of the most important ones are Precision and Recall.
Let’s use an analogy. Think of your model like a spam filter for your inbox:
- Precision: Of all the emails your filter flagged as spam, how many were actually junk? High precision means you aren’t finding critical client messages buried in your spam folder.
- Recall: Of all the actual spam that hit your inbox, how much did the filter catch? High recall means your main inbox stays clean because the filter is great at identifying and stopping junk.
There’s always a trade-off here. A super-aggressive filter (high recall) might catch every spam email, but it could also accidentally junk an urgent message from your boss (low precision). In churn prediction, you have to decide what’s worse: spending retention resources on a customer who wasn't leaving anyway, or completely missing one who was about to walk out the door.
Connecting Metrics to Business KPIs
While Precision and Recall give you a great technical scorecard, you ultimately need to speak the language of business value. This is where concepts like Lift and Calibration come into play, creating a direct line between your model’s predictions and real financial outcomes.
Lift tells you how much better your model is at finding churners compared to just picking customers at random. A lift score of 3x means the customers your model flags as high-risk are 3 times more likely to actually churn than the average customer. This is a direct measure of efficiency. It shows your customer success team exactly where to focus their limited time for the biggest possible impact.
A high lift score is the difference between your team making 100 random retention calls and making 30 highly targeted calls that have the same, or better, effect. It’s about working smarter, not harder, to save at-risk revenue.
Model Calibration is another vital, yet often overlooked, measure. Calibration is all about trust. It ensures that a predicted probability means what it says. If your model assigns a 70% churn risk to a customer, a well-calibrated model means that if you look at 100 customers with that same score, about 70 of them will actually end up churning.
This trust is what empowers your teams to make confident, data-backed decisions. For a deeper dive into how these figures feed into the bigger picture, it helps to understand the core customer retention metrics that underpin sustainable growth.
At the end of the day, the true test of your churn model is its direct influence on key business indicators. Are you seeing a real reduction in your overall churn rate? Is customer lifetime value (CLV) heading in the right direction? Are your retention costs dropping because your outreach is smarter and more targeted?
When you can answer "yes" to those questions, you know your model isn't just predicting the future—it's actively changing it for the better.
Turning Churn Predictions into Proactive Actions

Let's be honest: an accurate model for predicting customer churn is only half the battle. The real magic isn't in the prediction itself, but in how fast and how smart you are in your response. After all, a churn score is just a number. It's the proactive, data-driven intervention that actually saves the customer relationship and protects your revenue.
The biggest hurdle for most companies is bridging the gap between insight and action. How do you take a complex probability score from a machine learning model and turn it into a clear, prioritized task that your teams can jump on immediately? This is where a true product intelligence platform really proves its worth.
From Abstract Score to Concrete Workflow
Think about this all-too-common scenario. Your model flags a few high-value enterprise accounts. Their churn scores just shot up by 40% in the last two weeks. Without an integrated system, that critical insight probably lands in a data analyst's inbox. From there, it gets dropped into a spreadsheet, and if you're lucky, it gets discussed in a meeting next Tuesday. By then, the damage might already be done.
A modern system like SigOS shrinks that timeline from days down to seconds. The platform doesn't just see the churn score spike; it instantly pieces together the story behind it.
In this case, the AI might connect two events that would otherwise look completely separate:
- Usage Data: These at-risk accounts have suddenly stopped using a key reporting feature.
- Support Data: At the same time, your support team has seen a rise in tickets from these exact accounts, all complaining about the same bug in that feature.
Suddenly, you don't just have a prediction. You have a diagnosis. The AI has pinpointed the "why" behind the risk, giving you the context you need to act with confidence.
Automating the Intervention Process
This is where the system flips from a passive analytics tool to an active operational hub. Once the root cause is identified, a series of automated actions fire off to get the right information to the right people, instantly.
An insight without a corresponding action is just trivia. The goal of predicting customer churn isn't to create interesting reports; it's to trigger immediate, intelligent interventions that prevent revenue loss.
A platform like SigOS can orchestrate this entire response without anyone lifting a finger. It turns a complex signal into a simple, actionable workflow for your teams.
Here’s what that looks like in practice. The platform can automatically:
- Generate Real-Time Alerts: An instant alert zips over via Slack or email to the Product Manager who owns the reporting feature and the Customer Success Managers for the flagged accounts.
- Create Prioritized Tickets: A new, high-priority ticket is automatically created in Jira or Linear. But this isn't just any ticket—it's enriched with the critical business context, including an estimated revenue-at-risk figure calculated from the affected accounts.
- Update Business Dashboards: A central dashboard updates in real-time, showing the growing financial impact of this specific bug. This makes the business significance of the problem impossible to ignore.
This system removes the guesswork and the manual grunt work. The product team no longer has to debate which bug to fix next; one just showed up with a multi-thousand-dollar price tag attached. The CSMs aren't flying blind; they know exactly what issue to address in their next check-in.
The Impact of an Integrated System
This is what it looks like when a product intelligence dashboard surfaces high-impact issues by tying them directly to revenue.

Here, you can see user-reported problems prioritized not by how many people complained, but by the actual dollar amount at risk. This lets your teams focus their energy where it truly matters.
This deep integration is what separates a theoretical data science project from a practical, revenue-saving business process. Once predictions are made, putting proven strategies to reduce customer churn into motion becomes the top priority. Having this automated context makes those strategies far more effective, ensuring your most powerful insights lead directly to your most impactful actions.
Common Questions About Predicting Customer Churn
As teams start to dig into predicting customer churn with AI, the theoretical suddenly gets very real, and practical questions pop up left and right. Moving from a concept on a whiteboard to a working model means wrestling with data, timing, and ongoing maintenance. Answering these common questions upfront is key to setting the right expectations and building a strategy that actually helps the business.
Let’s tackle some of the most frequent questions that come up when you’re trying to put a churn prediction program into action. The goal here is to cut through the noise and give you straightforward guidance you can run with.
How Much Historical Data Do I Need to Start?
This is almost always the first question asked, and the answer is less about sheer quantity and more about quality and context. While there’s no single magic number, a good rule of thumb is to have at least 6 to 12 months of solid, consistent historical data. That window usually gives a machine learning model enough runway to spot meaningful patterns, account for seasonality, and really learn what "churn" looks like in your business.
But here’s the thing: the diversity of your data matters far more than its age.
A model trained on six months of rich, integrated data—from support tickets, usage metrics, and call transcripts—will almost always outperform a model trained on three years of just login data.
The trick is to capture enough of the customer lifecycle, including a healthy number of examples of customers who actually churned. That’s what gives the model a clear "unhappy path" to learn from, making its future predictions that much sharper.
Can You Predict Churn for New Customers?
Predicting churn for brand-new customers, sometimes called "early-stage churn," is its own unique beast—but it’s absolutely possible. Since you don't have a long history of their behavior to go on, the model has to get smart and look at different kinds of signals.
For these fresh accounts, the model will lean more heavily on:
- Firmographic Data: Things like company size, industry, and the subscription plan they chose can provide an initial baseline for risk.
- Onboarding Engagement: This is the big one. How quickly did they use a key feature (time-to-value)? Did they complete the onboarding checklist? What were their first few support interactions like? These are incredibly powerful early tells.
A product intelligence platform can quickly flag new users who are straying from the typical path of successfully retained customers within their first 30-60 days. This lets you jump in and help at the most critical stage of their journey, long before they even think about disengaging.
How Often Should a Churn Prediction Model Be Retrained?
A churn model isn't something you can just set up and walk away from. Your product evolves, your customers' behaviors change, and the market itself shifts. Over time, any model’s accuracy will naturally degrade—a process known as model drift. To keep your predictions sharp, regular retraining isn't just a good idea; it's essential.
For a fast-moving SaaS business, retraining the model monthly is a common and solid best practice. This rhythm keeps the model's logic synced up with the latest customer behavior patterns.
A more advanced approach, however, involves continuous performance monitoring. Modern platforms can automatically track how well a model's predictions are matching up with what actually happens. If its performance drops below a certain threshold, the system can kick off a retraining process on its own. This ensures your model is always working at its best, adapting right alongside your business.
What Is the Difference Between Voluntary and Involuntary Churn?
To take the right action, you first have to understand why a customer is churning. It almost always falls into two buckets: voluntary and involuntary.
- Voluntary Churn: This is what most people think of as churn. It’s when a customer makes an active decision to cancel. Maybe they're unhappy with the product, they found a competitor, or they just don’t see the value anymore. This is precisely the kind of churn that predictive models are built to fight by spotting those at-risk behaviors ahead of time.
- Involuntary Churn: This happens when a customer leaves for a reason that’s usually out of their direct control—most often, a failed payment. An expired credit card or a bank processing error can lead to an accidental cancellation. While it's a different problem than behavioral churn, it's still a major source of lost revenue that can often be fixed with automated dunning and payment recovery tools.
Telling these two apart is critical. Your AI model should be focused on predicting voluntary churn, because that's where your product and customer success teams can truly make a difference with proactive outreach. For a deeper dive into the entire process, this complete guide to predicting customer churn is a fantastic resource that covers everything from data prep to deployment.
By turning raw data into clear, actionable signals, SigOS empowers your teams to stop churn before it happens. Our AI-driven platform identifies at-risk accounts, quantifies the revenue impact of product issues, and helps you prioritize the fixes that matter most. Learn how SigOS can protect your revenue today.


Ready to find your hidden revenue leaks?
Start analyzing your customer feedback and discover insights that drive revenue.
Start Free Trial →